Back to Journals » Clinical Ophthalmology » Volume 16
Optical Coherence Tomography Can Predict Visual Acuity in Children with Optic Nerve Hypoplasia
Authors Skriapa-Manta A ![]() , Nilsson M, Svoboda J
, Nilsson M, Svoboda J ![]() , Olsson M, Nilsson M, Teär Fahnehjelm K
, Olsson M, Nilsson M, Teär Fahnehjelm K
Received 22 August 2022
Accepted for publication 17 October 2022
Published 17 November 2022 Volume 2022:16 Pages 3785—3794
DOI https://doi.org/10.2147/OPTH.S387084
Checked for plagiarism Yes
Review by Single anonymous peer review
Peer reviewer comments 4
Editor who approved publication: Dr Scott Fraser
Athanasia Skriapa-Manta,1,2 Mattias Nilsson,1 Jan Svoboda,3 Monica Olsson,1,2 Maria Nilsson,4 Kristina Teär Fahnehjelm1,2
1Department of Clinical Neuroscience, Karolinska Institutet, Stockholm, Sweden; 2Department of Paediatric Ophthalmology, Strabismus and Electrophysiology, St. Erik Eye Hospital, Stockholm, Sweden; 3Department of Paediatric Radiology, Karolinska University Hospital, Stockholm, Sweden; 4Unit of Optometry, Department of Clinical Neuroscience, Karolinska Institutet, Stockholm, Sweden
Correspondence: Athanasia Skriapa-Manta, St Erik Eye Hospital, Eugeniavägen 12, Stockholm, 17164, Sweden, Tel +46 739 491 186, Email [email protected]
Purpose: Optic nerve hypoplasia (ONH) is a common cause of visual impairment in children. Clinical complexity can cause diagnostic delay and difficulties predicting visual outcome. We evaluated whether optical coherence tomography (OCT) can improve the diagnosis and prediction of vision.
Methods: Thirty-seven eyes with ONH from 12 girls and 8 boys, median age 10.5 years (range 2.8– 18.9 years), were included in this cross-sectional cohort study. The majority, 17/20, had bilateral ONH. Ophthalmological assessments included best corrected visual acuity (BCVA), fundus photography, measurement of the peripapillary retinal nerve fibre layer (pRNFL), macular ganglion cell complex (GCC), Bruch’s membrane opening (BMO) and visual fields. We compared OCT parameters with comparison data collected on 140 healthy individuals 5 to 25 years old. Pearson’s correlation coefficient was used to determine the correlation of OCT parameters and BCVA.
Results: OCT demonstrated thinner mean pRNFL (p < 0.001) and mean GCC compared to the reference material (p < 0.001). BCVA displayed a strong or moderate correlation to pRNFL and to all sectors of the GCC except the inferotemporal. BCVA correlated strongly to Bruch’s membrane opening (BMO) (0.71, p < 0.001), and moderately to the Zeki ratio (− 0.52, p < 0.001). Multivariate analyses showed that BMO explained 48% of the variance in BCVA. Visual fields correlated strongly to pRNFL and GCC thickness. GCC thinning corresponded to visual field defects presence and location.
Conclusion: OCT can facilitate the diagnosis of ONH. Parameters such as pRNFL, GCC and BMO can be predictors of visual acuity whereas GCC and pRNFL thinning can indicate location and severity of visual field defects.
Keywords: optic nerve hypoplasia, OCT, ganglion cell complex, RNFL, visual fields, paediatric ophthalmology
Introduction
Optic nerve hypoplasia (ONH) is a non-progressive congenital malformation of multifactorial aetiology, and a common cause of visual impairment in children in many developed countries.1,2 In ONH the optic nerve is thin with a decreased number of retinal ganglion cell axons. Visual outcomes range from near normal to blindness if both eyes are affected. The prevalence of ONH has been reported to vary between 17/100,000 live born children3 up to 8–10/10,000.4
Diagnosis has traditionally been clinical, through ophthalmoscopy combined with fundus photography, where the optic disc appears abnormally small, often pale or grey in colour, with a pigmented or grey halo peripapillary or “double-ring sign”. Different patterns of visual field (VF) defects have been reported, mostly general constriction.5,6
ONH may occur in isolation or in combination with various hormonal deficiencies.7–12 Neurological and developmental problems are common.10–15 Hypoplasia of corpus callosum or septum pellucidum often co-exists, but the term septo-optic dysplasia (SOD) has been debated.11
Swept-source optical coherence tomography (SS-OCT) is a non-invasive imaging technique that produces an in-vivo near-histologic representation of ophthalmic tissues with good reproducibility.16 Previous case series using spectral domain OCT (SD-OCT) have demonstrated thinning of the peripapillary retinal nerve fibre layer (pRNFL) and macular ganglion cell complex (GCC) in patients with ONH.17–19 Foveal hypoplasia, seen as continuation of the inner retinal layers with increased retinal thickness at the foveal centre, has been shown in as many as 80% of ONH eyes.19
The objectives of the current study were to identify structural biomarkers and their association with the diagnosis of ONH, as well as to identify which biomarkers have the strongest correlation to visual function, including impact on VFs.
Materials and Methods
Consecutive patients previously clinically diagnosed with ONH who attended the Department of Paediatric Ophthalmology at St. Erik Eye Hospital between January 2020 and December 2021 were invited to take part in the study. A clinical diagnosis of ONH was originally based on clinical assessment combined with fundus photography, using the manual Zeki method.20 In short, the average disc diameter (DD) was calculated by adding the vertical and horizontal disc diameters and dividing by two. Secondly, the distance from the temporal margin of the optic disc to the fovea was measured and half of the average DD was added to gain the optic disc to macula distance (D-M). Finally, the ratio of the D-M/DD ratio was calculated by dividing with the average disc diameter. A ratio of three or more was considered suggestive of ONH diagnosis in combination with subnormal best corrected visual acuity (BCVA) and/or VF defects, as well as the absence of other known ophthalmic pathology. Three of the patients had unilateral ONH with a Zeki ratio <3 and normal BCVA in the fellow eye.
The patients underwent clinical eye examinations including BCVA, refraction in cycloplegia, orthoptic assessment of ocular alignment and ocular motility, slit-lamp examination, VF examination and imaging with SS-OCT.
Optical Coherence Tomography
Retinal scans of the macula (3D macula protocol 7x7mm) and of the optic nerve head (3D disc protocol 6x6mm) were obtained using Topcon SS-OCT (Topcon DRI-OCT Triton, Tokyo, Japan). Only high-quality scans were included in the analysis. The images of the maculae and optic nerve heads were checked for possible misalignment and centration was corrected manually when needed. OCT images were reviewed by three experts (ASM, MN, KTF), two at a time, on two separate occasions to validate them. Images with poor signal strength (below 60), segmentation errors, or artefacts due to blinking or unstable fixation within the measuring area were excluded from volumetric measurements.
In macular scans, the software provides automatic measurements called GCL+ and GCL++. GCL+ corresponds to the ganglion cell + inner plexiform layer (GCIPL) while GCL++ corresponds to the ganglion cell complex (GCC), defined as the three innermost retinal layers, which are the retinal nerve fibre layer (RNFL), the ganglion cell layer (GCL) and the inner plexiform layer (IPL). The software measures the thickness of six different macular sectors, superior (S), superonasal (SN), inferonasal (IN), inferior (I), inferotemporal (IT) and superotemporal (ST). Macular B scans showing the foveal centre were used to qualitatively study the foveal structure and the presence of foveal hypoplasia (FH), defined as the continuation of the inner retinal layers through the centre of the fovea where the grading was performed according to the Leicester Grading System.21
Additionally, a “subnormal fovea” was defined according to Katagiri et al,17 namely a shallow foveal depression due to thinning of the GCC around the fovea, but without continuation of the inner retinal layers under the centre (Figure 1).
 |
Figure 1 OCT b-scan through the centre of the fovea in (A) a healthy eye, (B) an eye with a subnormal fovea, namely a shallow foveal depression without continuation of the inner retinal layers under centre, (C–E) eyes with grade 1, grade 2 and grade 3 foveal hypoplasia according to the Leicester grading system.21 |
Measurement of the optic nerve head automatically generates pRNFL thickness in four sectors, superior (S), nasal (N), inferior (I) and temporal (T). Disc area (DA) is also generated automatically. One B scan, centred on the optic disc, was used for the manual measurement of Bruch’s membrane opening (BMO), defined as the maximum distance between Bruch’s membrane’s terminal edge on the temporal and nasal side of the optic nerve head.
Perimetry
Visual field function was examined with the Humphrey Field Analyzer (HFA 3 Model 860, USA) using the SITA Fast 24–2 algorithm or the manual Goldman perimeter (HAAG-STREIT Type 940-K7 Bern, Switzerland). The results of the HFA examination were quantified using the visual field index (VFI), where normal vision is associated with VFI values near 100%, while perimetric blindness produces VFI values approaching 0%.
Reference Data
As none of the currently available OCT devices include a normative database for the paediatric population,22 age-appropriate comparison data was collected in a group of 140 healthy children and young adults of 5–25 years of age (Table 1). Exclusion criteria were any ophthalmological or neurological disease, prematurity, large refractive errors > +6 Dioptres (D) or < −6 D, anisometropia, strabismus or amblyopia. Control limits were estimated by calculating the thickness measurements of pRNFL and GCC between the 5th and 95th percentiles.
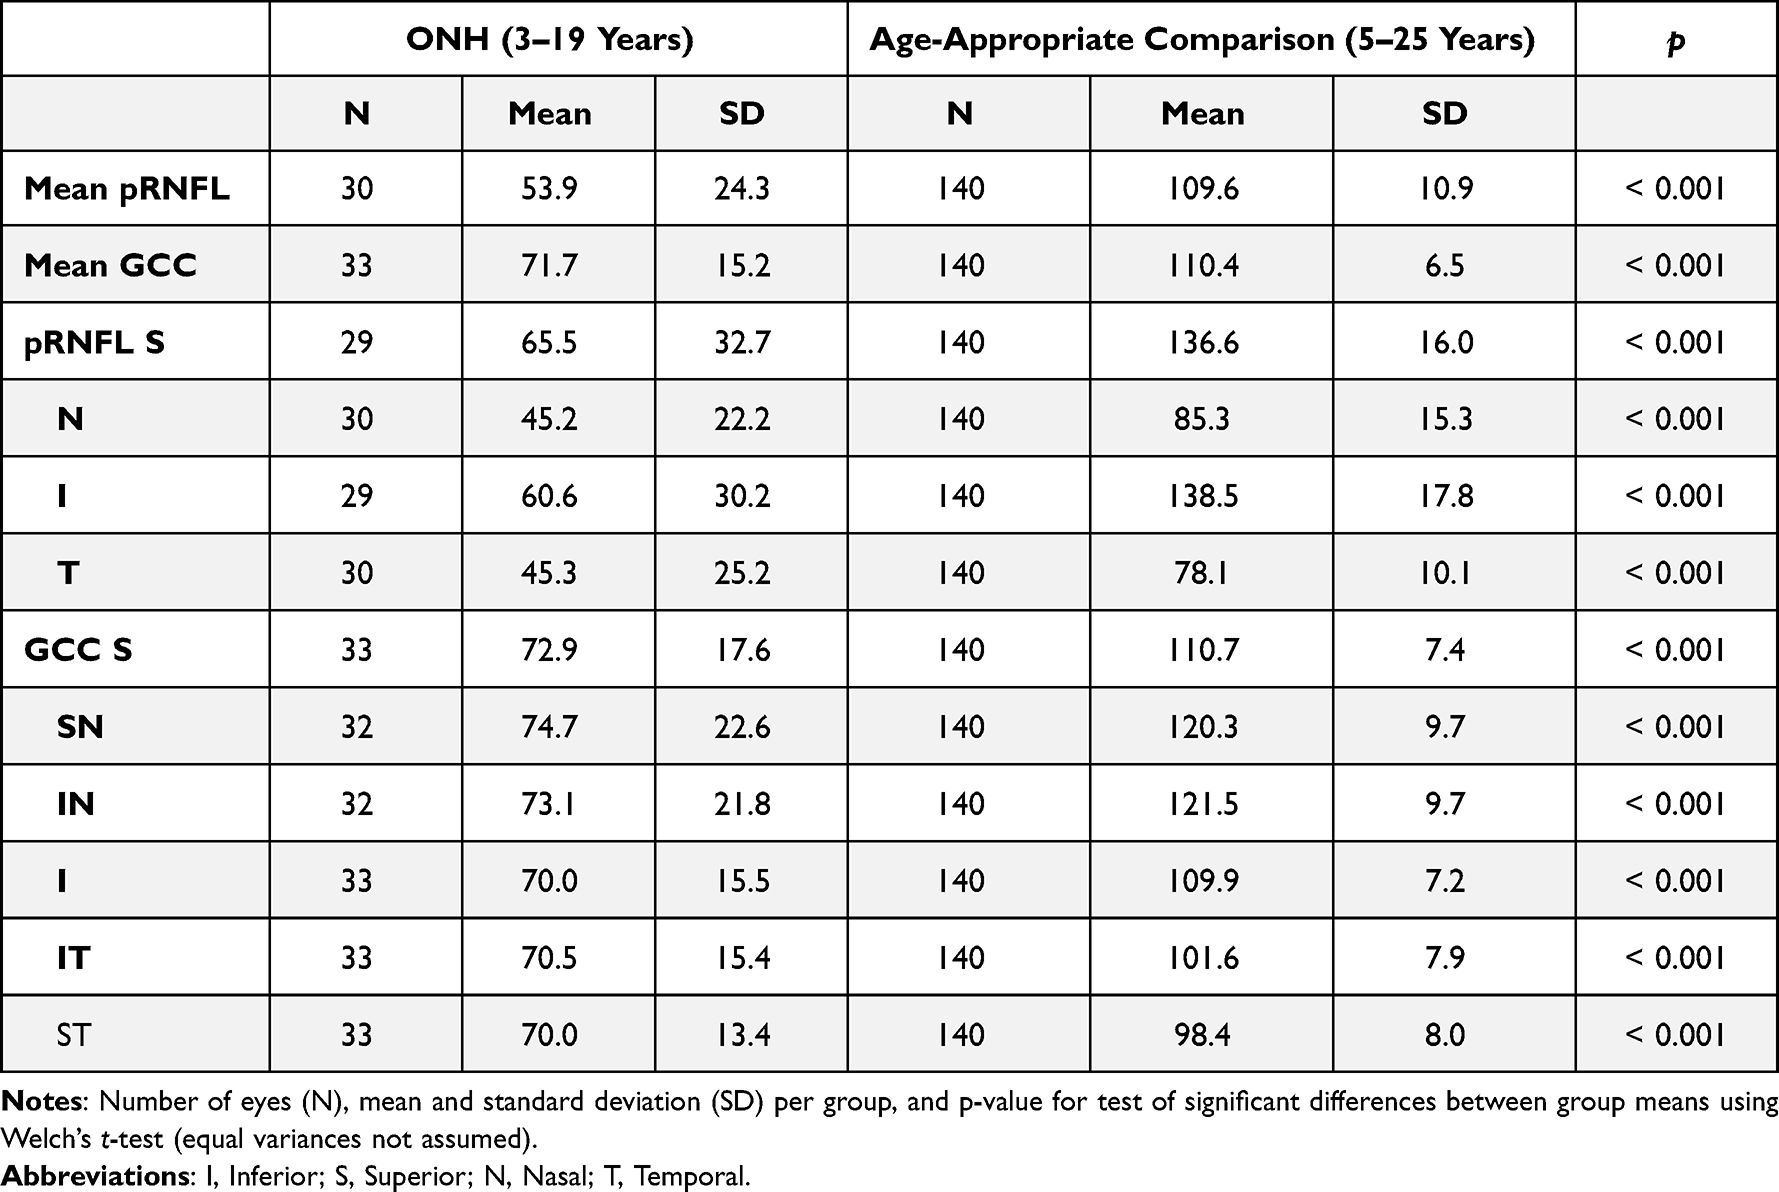 |
Table 1 Comparison of Peripapillary Retinal Nerve Fiber Layer (pRNFL) and Ganglion Cell Complex (GCC) Thickness Between Optic Nerve Hypoplasia (ONH) Eyes and Healthy Control Eyes |
Statistical Methods
A correlation analysis was performed to estimate the strength of association between OCT measurements and visual function. Sample size, Pearson’s correlation coefficient and its associated p-value are reported for all pairwise comparisons. In addition, a linear regression was performed using visual function (BCVA) as the dependent variable and OCT measurements as predictors in order to understand which OCT measurement best predicted visual function.
The predictor that explained the highest amount of variance in visual function was then used as input for a binary classification model to see the extent to which this feature could be useful in discriminating between ONH and normal eyes. Ten-fold cross validation was used to evaluate the classification accuracy of the model. In this procedure, the data set is first divided randomly into 10 parts. Nine of those parts are then used for training the model and one tenth for testing. This procedure is repeated 10 times, each time using a different tenth for testing. The classification accuracy is then computed as the mean accuracy across the ten test folds. This resampling method ensures that the training and test data are never the same, and thus reduces the risk of overfitting and getting an overoptimistically estimate of the classification accuracy.
The study was approved by the Regional Ethics Committee of Stockholm (Reference number: 2018/936-32) and informed consent was obtained from parents and from patients older than 15 years of age. The study was performed in accordance with the Declaration of Helsinki.
Results
Demographic Data, Including Age and Unilateral or Bilateral ONH
Thirty-seven eyes from 20 patients with ONH, 12 girls and eight boys, with a median age of 10.5 years (range 2.8–18.9 years), were included. Most patients had bilateral ONH (17/20). One unilateral case is presented in Figure 2 and one bilateral case in Figure 3.
 |
Figure 2 10-year-old boy born full term after normal delivery. He presented at age 5 with exotropia of the right eye (RE) and was diagnosed with unilateral optic nerve hypoplasia (ONH). Best corrected visual acuity (BCVA) was 0.2 and Zeki ratio 4.3 in the affected RE while BCVA was 1.0 and Zeki ratio was 2.2 in the normal left eye (LE). (A and B). Optic disc photographs with ONH RE and normal optic disc LE. (C–F). OCT of the macula with thin ganglion cell layer (GCL) RE and shallower foveal depression because of that, compared to the normal left eye with normal GCL. No foveal hypoplasia was present. (G and H) Humphrey visual fields of the RE with severe temporal depression with some sparing of the nasal fields especially in the superonasal quadrant corresponding to the pattern of GCL thinning in the OCT image above. (I–L). MRI of the brain showing a thin optic nerve on the right side in both the axial and coronal images (arrows I and J). There is also periventricular leukomalacia (PVL) on the left side in both axial and coronal images (arrows K and L). |
 |
Figure 3 11-year-old boy offspring of consanguineous parents, born full term after normal delivery. He developed nystagmus and was diagnosed with bilateral optic nerve hypoplasia. At 11 years of age best corrected visual acuity (BCVA) was 0.1 in the right eye (RE) with a Zeki ratio of 9.7. BCVA of the left eye (LE) was 0.2 with a Zeki ratio of 4.4. (A and B) Optic disc photographs with small hypoplastic discs in both eyes. (C–F) OCT b-scan with an abnormally thin ganglion cell layer (GCL) bilaterally with some preserved GCL in the left macula inferotemporally. Foveal hypoplasia is seen bilaterally. (G and H) Humphrey visual fields with global visual field defects in the RE and mainly temporal visual field defects in the LE. These correspond to the areas of GCL thinning seen in OCT of the macula above. (I) MRI of the brain with absence of septum pellucidum (arrow). |
Five patients were visually impaired according to the WHO definition (binocular BCVA < 0.3 Snellen). Eight patients had no light perception (NLP) or light perception only (LP) in the ONH eye but had better BCVA in their fellow eye even if that eye had an ONH diagnosis. Median decimal BCVA, obtained from all eyes with ONH (n = 37), was 0.2 (range NLP to 1.0). The spherical equivalent ranged from −5.5 D to +5.75 D (median +0.5D).
Nine patients had nystagmus and eight had esotropia or exotropia. The median Zeki ratio obtained in 32 eyes was 4.0 (range 3.2–22.1). The median of the automatically measured DA was 1.39 mm2 (range 0.64–2.17). The median disc diameter (DD) calculated by measuring the BMO was 1030µm (range 273–1505µm).
Visual Fields
Eighteen patients were able to perform visual field examinations. One patient was too young, and one did not attend.
Goldman VF testing was performed in 26 eyes from 14 patients with abnormal results in 25 eyes, mainly constriction of the peripheral fields. Five of these patients were also examined with HFA with similar abnormal results.
HFA was performed in 20 eyes from 12 patients. In total, ten eyes had abnormal results, mainly concentric constriction with temporal depression and in one case defects in the superior hemifield.
VFI correlated strongly to pRNFL (r = 0.702) and to GCC (r = 0.722). Based on qualitative observation, the visual field pattern corresponded with the GCC topography in four patients, two of these are presented in Figures 2 and 3.
Magnetic Resonance Imaging (MRI)
MRI scans of the brain had been performed in 18/20 cases at a median age of 3 years (range 0.5–7 years). Thin optic nerves, chiasma and/or optical tracts were present in 17/18 patients. The optic nerves in one patient could not be examined due to concurrent pathology). An absent/dysplastic septum pellucidum was noted in 5/18 patients. Pathology in the pituitary gland was detected in 4/18 patients, ie, either a small anterior pituitary gland, ectopic posterior pituitary gland and/or a thin infundibulum. Periventricular leukomalacia occurred in 2/18 patients while migration anomalies occurred in four patients.
Swept Source OCT
pRNFL, GCIPL and GCC measurements were obtained in 30, 33 and 33 of the 37 eyes, respectively. Mean pRNFL and mean GCC, as well as the separate sector thicknesses, were significantly thinner in the ONH group than in the reference group (p < 0.001) (Table 1).
BCVA showed a moderate to strong correlation with mean pRNFL, mean GCC, mean GCIPL, BMO and Zeki ratio, while the disc area, rim area and spherical equivalent did not show any correlation to BCVA (Figure 4).
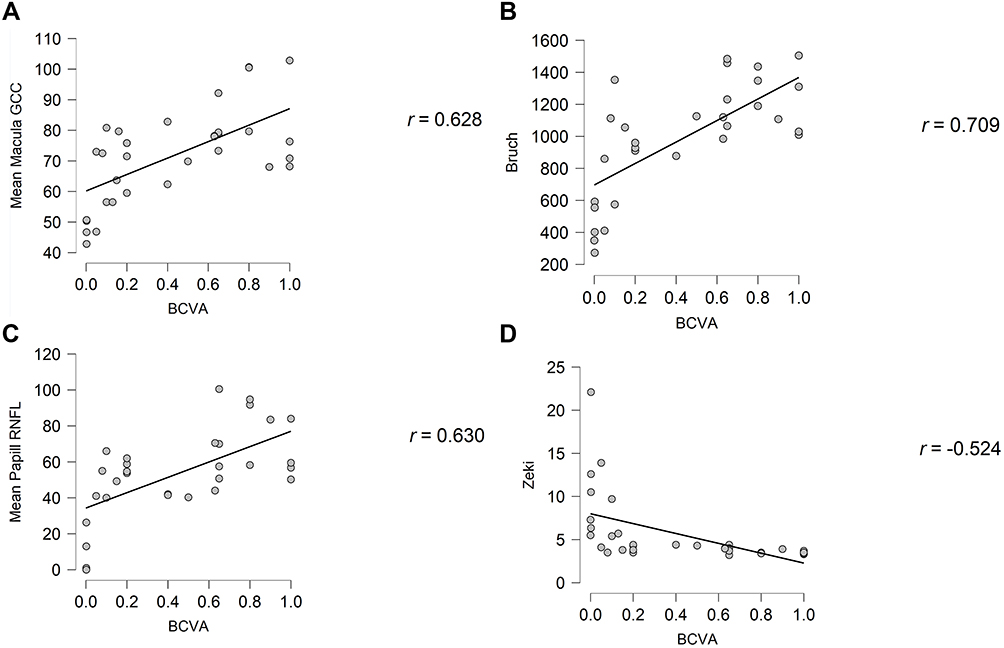 |
Figure 4 The diagrams show correlations between best corrected visual acuity and (A) the peripapillary retinal nerve fiber layer, (B) mean ganglion cell complex, (C) Bruch’s membrane opening and (D) Zeki’s ratio. |
Linear regression showed that BMO was the best predictor of visual function in ONH, explaining 48% of the variance in BCVA. We explored the relationship between BMO and ONH further using a binary classification model to estimate the cutoff value of BMO with the highest sensitivity and specificity. The model was trained on 31 ONH eyes and 140 normal eyes and evaluated on held-out data using 10-fold cross-validation. Under the assumption that it is twice as costly to misclassify an ONH eye as normal than it is to misclassify a normal eye as ONH, the best estimated cutoff value was 1328 µm, giving a sensitivity of 74.2% and a specificity of 97.9%.
In total, 10 of 35 eyes presented with FH while 15 eyes presented with a normal fovea. Six eyes had FH grade 1 according to the Leicester Grading System21 with a continuation of the inner retinal layers through the fovea and a shallow foveal pit. One eye had FH grade 2 without an identifiable foveal pit and three eyes had FH grade 3 without any photoreceptor outer segment (OS) lengthening. Another ten eyes presented with “subnormal fovea” as defined by Katagiri et al,17 namely a shallow foveal depression due to the thinning of the GCC around the fovea but without continuation of the inner retinal layers under centre (Figure 1). In two of the 37 ONH eyes it was not possible to obtain good quality images of the macula.
Discussion
The objectives of this study were to evaluate SS-OCT findings in patients with ONH, to compare these to age-appropriate healthy eyes and to correlate them with visual acuity and visual fields.
In this cohort of 37 eyes from 20 patients with ONH, the mean pRNFL and mean GCC were significantly thinner than the reference material. This is in agreement with others. Pilat et al19 used SD-OCT to study 16 cases with ONH (mean age 17.2 years; 6 bilateral) and 32 healthy controls. They reported significantly thinner mRNFL, thinner GCL nasally and temporally to the fovea and thinner IPL and ONL nasally. FH was found in more than 80% of patients,20 which is more than in our study. This could be because they included more severe cases of ONH.
Katagiri et al17 used SD-OCT to investigate 18 ONH cases. They reported significant GCC thinning nasally and temporally, as well as significant thinning of the pRNFL. They also reported the presence of FH, subnormal fovea, and atypical foveal configuration (foveal depression present but wider compared with the classical foveal pit). The incidence of FH and subnormal fovea was similar in our study, although we did not observe any cases with atypical foveal configuration.
However, we also demonstrated, as a new finding, a strong correlation between BCVA and BMO. Originally, Zeki et al did not find a correlation between optic disc size and VA and speculated about other causes for visual impairment, such as macular hypoplasia.23 However, multiple publications from the Vision Center at the Children’s Hospital of Los Angeles have shown a strong correlation between relative disc size based on fundus photographs and VA.24 The measurement of the disc size with the use of fundus photographs can sometimes be difficult and the margin of error is bigger compared to the measurement of BMO using an SS-OCT scan with a 20µm lateral resolution, probably making the latter a more reliable and reproducible measurement. Pilat et al failed to show a correlation of optic disc parameters with VA, but most of the patients in their study had severe ONH with very poor VA (<0.12) limiting the opportunity to detect differences.19 In contrast, we included eyes with a wide range of VA from NLP to 1.0.
We calculated the best estimated cutoff value of BMO to 1328 µm, with a sensitivity of 74.2% and a specificity of 97.9% for the diagnosis of ONH. Pilat et al had a lower cutoff value of 1200µm, with an even higher sensitivity and specificity compared to healthy controls.19 However, that discrepancy in the sensitivity can also be attributed to the fact stated above, namely that there were many more severe cases of ONH with smaller discs and much lower VA included in their cohort compared to ours. In the spectrum of ONH there is therefore a bit more overlap of the BMO measurement between ONH eyes and healthy control eyes making the distinguishing ability of this parameter lower in the least equivocal cases. It is however still a useful piece of the puzzle, easy to obtain with great accuracy.
VF defects are not easily evaluated in this patient group, in which nystagmus, visual impairment and additional neuropsychiatric problems are common. In the present study, non-specific general constriction was the most prevalent VF defect, with nasal altitudinal defects and temporal constriction also evident in a few cases.
Previously described defects include general constriction, nasal and inferior altitudinal defects, unilateral temporal and bitemporal hemianopias and ceco-central scotomas.5,25–27 The VF defects have previously been related to the hypoplastic areas of the optic disc27 or areas of thin RNFL.5 We report, as a new finding, strong correlations between VFI and thickness of pRFNL and GCC albeit in a limited part of the eyes with reliable visual fields using HFA.
Nystagmus was as common in the studies performed by Pilat19 and Katagiri17 as in our study. The five cases without nystagmus in Pilat’s study were all cases with unilateral ONH and in our study one of the unilateral patients had latent nystagmus.
Poor fixation, strabismus or low VA are often the presenting symptoms in patients with ONH, leading to a visit to an ophthalmologist who will often be the first person to examine the child. Suspecting the diagnosis and referring the patient further for endocrinological and/or neurological examinations is crucial. Although diagnosis in cases with pronounced ONH is straightforward, it can be considerably more complicated in patients with slightly subnormal optic discs. In children, assessment with OCT can help improve diagnostic accuracy, although it must be noted that OCT can be limited by the capacity for obtaining high quality images. Handheld OCT devices can be useful. In cases where OCT is impossible to obtain, more conventional methods, such as measuring the Zeki ratio in photos, can aid in the diagnosis and prognosis of the disease.
This study includes one of the largest and most diverse cohort of patients with ONH in the literature allowing for the results to be more representative of the patients with this diagnosis than previous studies. This is also the first to use SS-OCT volumetric analysis to obtain the measurements. However, this may also be a limitation, as the data was analysed using the built-in software and not manual measurements with the exception of BMO, not allowing for the precise realignment of multiple scans and some degree of segmentation errors that may have affected some of our results, especially in eyes with nystagmus.
Conclusions
Compared to the reference material, OCT assessments showed thinner mean pRNFL and mean GCC in patients with ONH, providing diagnostic help and new opportunities for predicting visual acuity outcome in these patients.
We suggest that all patients with suspected ONH are examined using OCT if possible. A small disc diameter or BMO and a thin GCC or pRNFL may support the diagnosis and serve as prognostic tools for the patient’s final VA. A thin GCC or pRNFL layer defects can also predict possible VF defects.
Acknowledgments
We want to thank all the patients and their families for their participation in this study. This project was supported by grants from the Marianne Bernadotte Foundation, Signhild Engqvist, Ögonfonden and private funding.
Disclosure
The authors report no conflicts of interest in this work.
References
1. Solebo AL, Teoh L, Rahi J. Epidemiology of blindness in children. Arch Dis Child. 2017;102(9):853–857. doi:10.1136/archdischild-2016-310532
2. Kong L, Fry M, Al-Samarraie M, Gilbert C, Steinkuller PG. An update on progress and the changing epidemiology of causes of childhood blindness worldwide. J Aapos. 2012;16(6):501–507. doi:10.1016/j.jaapos.2012.09.004
3. Fahnehjelm KT, Dahl S, Martin L, Ek U. Optic nerve hypoplasia in children and adolescents; prevalence, ocular characteristics and behavioural problems. Acta Ophthalmol. 2014;92(6):563–570. doi:10.1111/aos.12270
4. Arnold AW, Eller AM, Smith KA, Grendahl RL, Winkle RK, Arnold RW. Direct OPTOS nerve size determination of prevalent optic nerve hypoplasia in Alaska. Clin Ophthalmol. 2020;14:491–499. doi:10.2147/OPTH.S242548
5. Frisen L, Holmegaard L. Spectrum of optic nerve hypoplasia. Br J Ophthalmol. 1978;62(1):7–15. doi:10.1136/bjo.62.1.7
6. Ouvrier R, Billson F. Optic nerve hypoplasia: a review. J Child Neurol. 1986;1(3):181–188. doi:10.1177/088307388600100302
7. Hoyt WF, Kaplan SL, Grumbach MM, Glaser JS. Septo-optic dysplasia and pituitary dwarfism. Lancet. 1970;1(7652):893–894. doi:10.1016/S0140-6736(70)91717-4
8. Borchert M, Garcia-Filion P. The syndrome of optic nerve hypoplasia. Curr Neurol Neurosci Rep. 2008;8(5):395–403. doi:10.1007/s11910-008-0061-7
9. Ahmad T, Garcia-Filion P, Borchert M, Kaufman F, Burkett L, Geffner M. Endocrinological and auxological abnormalities in young children with optic nerve hypoplasia: a prospective study. J Pediatr. 2006;148(1):78–84. doi:10.1016/j.jpeds.2005.08.050
10. Goh YW, Andrew D, McGhee C, Dai S. Clinical and demographic associations with optic nerve hypoplasia in New Zealand. Br J Ophthalmol. 2014;98(10):1364–1367. doi:10.1136/bjophthalmol-2013-304605
11. Garcia-Filion P, Epport K, Nelson M, et al. Neuroradiographic, endocrinologic, and ophthalmic correlates of adverse developmental outcomes in children with optic nerve hypoplasia: a prospective study. Pediatrics. 2008;121(3):e653–9. doi:10.1542/peds.2007-1825
12. Ryabets-Lienhard A, Stewart C, Borchert M, Geffner ME. The optic nerve hypoplasia spectrum: review of the literature and clinical guidelines. Adv Pediatr. 2016;63(1):127–146. doi:10.1016/j.yapd.2016.04.009
13. Margalith D, Jan JE, McCormick AQ, Tze WJ, Lapointe J. Clinical spectrum of congenital optic nerve hypoplasia: review of 51 patients. Dev Med Child Neurol. 1984;26(3):311–322. doi:10.1111/j.1469-8749.1984.tb04447.x
14. Ek U, Fernell E, Jacobson L. Cognitive and behavioural characteristics in blind children with bilateral optic nerve hypoplasia. Acta Paediatr. 2005;94(10):1421–1426. doi:10.1080/08035250510037290
15. Dahl S, Wickström R, Ek U, Fahnehjelm KT. Children with optic nerve hypoplasia face a high risk of neurodevelopmental disorders. Acta Paediatr. 2018;107(3):484–489. doi:10.1111/apa.14163
16. Kishi S. Impact of swept source optical coherence tomography on ophthalmology. Taiwan J Ophthalmol. 2016;6(2):58–68. doi:10.1016/j.tjo.2015.09.002
17. Katagiri S, Nishina S, Yokoi T, et al. Retinal structure and function in eyes with optic nerve hypoplasia. Sci Rep. 2017;7:42480. doi:10.1038/srep42480
18. Jeng-Miller KW, Cestari DM, Gaier ED. Congenital anomalies of the optic disc: insights from optical coherence tomography imaging. Curr Opin Ophthalmol. 2017;28(6):579–586. doi:10.1097/ICU.0000000000000425
19. Pilat A, Sibley D, McLean RJ, Proudlock FA, Gottlob I. High-resolution imaging of the optic nerve and retina in optic nerve hypoplasia. Ophthalmology. 2015;122(7):1330–1339. doi:10.1016/j.ophtha.2015.03.020
20. Zeki SM, Dudgeon J, Dutton GN. Reappraisal of the ratio of disc to macula/disc diameter in optic nerve hypoplasia. Br J Ophthalmol. 1991;75(9):538–541. doi:10.1136/bjo.75.9.538
21. Thomas MG, Kumar A, Mohammad S, et al. Structural grading of foveal hypoplasia using spectral-domain optical coherence tomography a predictor of visual acuity? Ophthalmology. 2011;118(8):1653–1660. doi:10.1016/j.ophtha.2011.01.028
22. Muñoz-Gallego A, Rodríguez-Salgado M, de la Cruz J, López-López C, Cañas-Zamarra I, Tejada-Palacios P. Paediatric optical coherence tomography normative databases: a real need. Arch Soc Esp Oftalmol. 2019;94(12):591–597. doi:10.1016/j.oftal.2019.08.003
23. Zeki SM, Hollman AS, Dutton GN. Neuroradiological features of patients with optic nerve hypoplasia. J Pediatr Ophthalmol Strabismus. 1992;29(2):107–112. doi:10.3928/0191-3913-19920301-11
24. Kruglyakova J, Garcia-Filion P, Nelson M, et al. Orbital MRI versus fundus photography in the diagnosis of optic nerve hypoplasia and prediction of vision. Br J Ophthalmol. 2020;104(10):1458–1461. doi:10.1136/bjophthalmol-2019-315524
25. Björk A, Laurell CG, Laurell U. Bilateral optic nerve hypoplasia with normal visual acuity. Am J Ophthalmol. 1978;86(4):524–529. doi:10.1016/0002-9394(78)90301-X
26. Petersen RA, Walton DS. Optic nerve hypoplasia with good visual acuity and visual field defects: a study of children of diabetic mothers. Arch Ophthalmol. 1977;95(2):254–258. doi:10.1001/archopht.1977.04450020055011
27. Seeley RL, Smith JL. Visual field defects in optic nerve hypoplasia. Am J Ophthalmol. 1972;73(6):882–889. doi:10.1016/0002-9394(72)90457-6
 © 2022 The Author(s). This work is published and licensed by Dove Medical Press Limited. The
full terms of this license are available at https://www.dovepress.com/terms
and incorporate the Creative Commons Attribution
- Non Commercial (unported, 3.0) License.
By accessing the work you hereby accept the Terms. Non-commercial uses of the work are permitted
without any further permission from Dove Medical Press Limited, provided the work is properly
attributed. For permission for commercial use of this work, please see paragraphs 4.2 and 5 of our Terms.
© 2022 The Author(s). This work is published and licensed by Dove Medical Press Limited. The
full terms of this license are available at https://www.dovepress.com/terms
and incorporate the Creative Commons Attribution
- Non Commercial (unported, 3.0) License.
By accessing the work you hereby accept the Terms. Non-commercial uses of the work are permitted
without any further permission from Dove Medical Press Limited, provided the work is properly
attributed. For permission for commercial use of this work, please see paragraphs 4.2 and 5 of our Terms.