Back to Journals » Clinical Ophthalmology » Volume 14
Optical Coherence Tomography Angiography Features of Neovascularization in Proliferative Diabetic Retinopathy
Authors Vaz-Pereira S ![]() , Silva JJ
, Silva JJ ![]() , Freund KB
, Freund KB ![]() , Engelbert M
, Engelbert M
Received 1 August 2020
Accepted for publication 11 September 2020
Published 15 October 2020 Volume 2020:14 Pages 3351—3362
DOI https://doi.org/10.2147/OPTH.S274537
Checked for plagiarism Yes
Review by Single anonymous peer review
Peer reviewer comments 3
Editor who approved publication: Dr Scott Fraser
Sara Vaz-Pereira,1,2,* João Jesus Silva,2,* K Bailey Freund,3– 5 Michael Engelbert3– 5
1Department of Ophthalmology, Centro Hospitalar Universitário de Lisboa Norte, EPE - Hospital de Santa Maria, Lisbon, Portugal; 2Department of Ophthalmology, Faculdade de Medicina, Universidade de Lisboa, Lisbon, Portugal; 3Vitreous Retina Macula Consultants of New York, New York, NY, USA; 4LuEsther T. Mertz Retinal Research Center, Manhattan Eye, Ear and Throat Hospital, New York, NY, USA; 5Department of Ophthalmology, New York University School of Medicine, New York, NY, USA
*These authors contributed equally to this work
Correspondence: Sara Vaz-Pereira
Department of Ophthalmology, Centro Hospitalar Universitário de Lisboa Norte, EPE - Hospital de Santa Maria, Avenida Professor Egas Moniz, Lisbon 1649-035, Portugal
Tel +351 217805252
Fax +351 217805653
Email [email protected]
Purpose: To describe features of neovascularization in proliferative diabetic retinopathy (PDR) using optical coherence tomography angiography (OCTA).
Methods: A retrospective case series was performed in 23 eyes from 21 patients who underwent OCTA of neovascular complexes (NVCs) due to PDR. Eyes were imaged with the DRI Triton swept-source OCTA, Avanti RTVue XR or Cirrus HD-OCT 5000 as part of routine clinical examination. Segmentation was adjusted to include vasculature between the vitreous cavity and the internal limiting membrane (ILM). The presence of NVCs was confirmed by clinical examination and multimodal imaging such as color or red-free fundus photography, fluorescein angiography, multicolor imaging or near-infrared reflectance.
Results: Thirty-five NVCs were imaged, of which, 34% were neovascularization of the disc (NVD) and 66% were neovascularization elsewhere (NVE). On structural OCT B-scans, NVE appeared as medium to highly reflective tissue that breached the ILM, while NVD showed highly reflective tissue protruding from the disc in a sea fan configuration. Flow signal was seen on OCTA in all cases of NVE and in 67% of NVD lesions. Areas with minimal or absent retinal flow signal identified retinal nonperfusion areas and were found adjacent to 87% of NVE. Intraretinal microvascular abnormalities (IRMAs) were noted next to 70% of NVE. Absent flow signal was seen in 4 NVD cases showing posterior shadowing and were considered inactive.
Conclusion: OCTA appears useful for imaging NVCs, IRMAs, and retinal nonperfusion areas in eyes with diabetic retinopathy. This imaging modality enables noninvasive screening and monitoring of PDR and can obviate the need for additional testing in certain clinical settings.
Keywords: diabetes mellitus, diagnostic imaging, proliferative diabetic retinopathy, retinal neovascularization, optical coherence tomography angiography
Introduction
Proliferative diabetic retinopathy (PDR) is characterized by the presence of neovascularization, which can lead to severe visual loss resulting from hemorrhagic and/or tractional complications.1–3
There are several established imaging techniques to evaluate PDR, with fluorescein angiography (FA) and optical coherence tomography (OCT) being the most relevant. While FA is considered the gold standard, it is an invasive technique.4–6 Also, since fluorescent signals originating in both the superficial and deep capillary networks are projected onto a single plane, it is impossible to identify in which of these retinal layers the vascular abnormalities exist.6 OCT is a noninvasive technique that provides images of the retinal structure typically displayed as cross-sections. OCT is used routinely in diabetic retinopathy to evaluate macular edema,7–11 but can also be helpful in evaluating morphologic changes in PDR related to neovascularization.12–18 With OCT, it is possible to evaluate neovascular complexes (NVCs) in their earliest stages and to identify associated vitreoretinal interface changes.13,14,16–18 Prior reports describe NVD as hyperreflective lesions over the optic disc with NVE appearing as flat vessels arising from the inner retina which then grow as hyperreflective loops.12,13,16,18 Also, NVCs can be differentiated from intraretinal microvascular abnormalities (IRMA) since the neovascularization breaches the internal limiting membrane (ILM) and grows into the posterior hyaloid.15,17,18 One study described the use of spectral-domain OCT to distinguish quiescent from active NVCs, since active NVCs had a higher presence of vitreous hyperreflective dots whereas quiescent NVCs were associated with features more suggestive of fibrotic changes, including adjacent epiretinal membrane, inner retinal tissue contracture, protrusion towards the vitreous and frank vitreous invasion.16 OCT angiography (OCTA) is a more recent technique that identifies vascular structures by detecting the change in backscattering between consecutive B-scans and then attributing the differences to the flow of erythrocytes through retinal blood vessels.19–25 OCTA provides two and three-dimensional noninvasive vascular mapping at the microcirculation level.24,25 In PDR, OCTA can be useful to visualize retinal nonperfusion areas (NPAs) and the presence of blood flow in NVCs and IRMAs.6,18,26–28
Herein, we aim to describe features of neovascularization in PDR using OCTA, complementing previous observations. These findings have clinical utility in estimating the activity of specific neovascular complexes, monitoring treatment response, surgical planning, and reducing the need for dye-based imaging during busy clinics, all the more important now with the impact of the COVID-19 pandemic.
Methods
This was a retrospective case series conducted in 2 retinal clinics, based in Lisbon and New York, from 2015 to 2018. Subjects have given their written informed consent and the study was approved by Hospital de Santa Maria local ethics committee (Lisbon, Portugal) and by the Western Institutional Review Board (Olympia, WA) and adheres to the tenets of the Declaration of Helsinki.
A database search was performed and eyes from patients with PDR and OCTA imaging of NVCs acquired as part of routine clinical examination were included. NVCs had been identified through clinical examination and at least 2 types of multimodal imaging such as structural OCT, FA, color fundus photography, multicolor imaging, near-infrared reflectance, or red-free fundus photography, as in previous studies.16,17,29–31 Exclusion criteria included other causes of proliferative retinopathy such as retinal vascular occlusion, sickle cell retinopathy, ocular ischemic syndrome, or radiation retinopathy. Eyes with prior vitrectomy, or conditions that degraded image quality such as media opacities, uveitis and vitreous hemorrhage were also excluded.
OCTA
All OCTA images were obtained using one of 3 commercially available devices – the Avanti RTVue XR spectral-domain OCT (Optovue, Fremont, CA, USA) with AngioVue software (Optovue) was used in the New York clinic and the Cirrus HD-OCT 5000 with AngioPlex (Carl Zeiss Meditec, Jena, Germany) or the DRI Triton swept-source OCT (Topcon, Tokyo, Japan) were used in the Lisbon clinic, depending on the availability of the model of the OCTA equipment at the time of acquisition. After the identification of the area of abnormal blood vessels, the OCTA images were captured and centered manually by moving the software scanning area so as to include the totality of the NVCs.
The Avanti RTVue XR spectral-domain OCT with AngioVue uses a split-spectrum amplitude decorrelation angiography (SSADA) algorithm and has an A-scan rate of 70,000 scans per second using a light source centered on 840 nm with a bandwidth of 50 nm. The axial resolution is 5 µm, the lateral resolution is 15 µm and the imaging depth is 2–3 mm.32 Examination of NVDs was performed using 3 x 3 and 4.5 x 4.5 mm volume protocols in Angio Disc mode. Evaluation of NVEs was performed in Angio Retina mode using 3 x 3 mm, 6 x 6 mm or 8 x 8 mm scans, with the larger scans used for the larger complexes. Only scans with a signal strength index of at least 55 were included.
The Cirrus HD-OCT spectral-domain angiography uses an optical microangiography (OMAG) algorithm, has an A-scan rate of 68,000 scans per second and uses a light source centered on 840 nm with a bandwidth of 90 nm. The resolution is identical to the Avanti RTVue XR OCT and the imaging depth is 2 mm.32 NVDs were imaged using 3 x 3 mm scan areas and NVEs using 3 x 3 mm, 6 x 6 mm or 8 x 8 mm scans. Scans with a quality of at least 6/10 were included.
The DRI Triton swept-source OCT uses an angiography ratio analysis (OCTARA) algorithm. It has a A-scan rate of 100,000 A-scans per second and works with a long wavelength scanning light of 1050 nm. It has an axial resolution of 8 µm, a lateral resolution of 20 µm and an imaging depth of 2.6 mm.32 OCTA images of NVD were acquired using a scan size of 4.5 x 4.5 mm and a resolution of 320 x 320 and NVEs were scanned with a scan size of 6 x 6 mm and the same resolution. Scans included had an image quality signal of at least 55.
Irrespective of the device used, segmentation was evaluated and manually adjusted by moving the upper and lower lines of the slab so as to include the entire vasculature between the vitreous cavity and the ILM.33
OCTA images were graded qualitatively. The classification of new vessels was based on location with NVD defined as new vessels located at the disc or within 1 disc diameter from its margin, and NVE defined as new vessels located outside this area.3 The NVCs were identified and classified with respect to the following features:
NVEs were identified as preretinal hyperreflective tissue that breached the ILM on structural OCT and were classified morphologically as “flat”, “forward” or “tabletop” in accordance with our previous classification.17 The status of the adjacent posterior hyaloid (attached, detached or tethered) was also noted.17 OCTA features assessed included: flow signal within the NVE; presence of posterior shadowing and adjacent NPAs. NVEs were further examined in accordance with a proposed classification from Pan et al29 where type 1 NVEs originated from the margin of capillary nonperfusion by the venous side, emerged from the ganglion cell and nerve fiber layers and maintained only 1 branch extending into the retina while the other attached to the posterior hyaloid; type 2 NVEs originated from the capillary networks within the area of capillary nonperfusion, emerged from the inner nuclear layer, and breached the ILM in various areas to form many branches with an octopus-like appearance which adhered firmly to the retina and type 3 NVEs developed from the IRMAs within the area of capillary nonperfusion and were mostly intraretinal with some tips that breached the ILM. A fourth category was added, “other”, which included NVEs that did not seem to match any of the 3 proposed types.
NVDs were identified as hyperreflective tissue located on or protruding from the disc in the structural OCT. The status of the posterior hyaloid and OCTA features such as flow signal within the complex and adjacent NPAs were also evaluated for NVDs. The presence of exuberant vascular proliferation (EVP), defined by Ishibazawa et al33 as an irregular proliferation of fine (smaller-caliber) vessels in more active stages, was evaluated in all NVCs with OCTA.
Statistical Analysis
Statistical analysis was performed using SPSS version 24.0 (IBM Corp, Armonk, NY). Clinical and imaging data were analyzed with frequency and descriptive statistics. Independence chi-square and Fisher’s exact tests were performed for the categorical variables. P-value was considered statistically significant when <0.05.
Results
Twenty-three eyes of 21 patients were enrolled. Thirteen (62%) were male and 8 (38%) were women, with a mean age±standard deviation of 57±10 years. Fourteen (67%) were White, 4 (19%) were of African ancestry, 2 (10%) were Asian and 1 (5%) was Hispanic. Ten (48%) patients had type 1 diabetes mellitus (DM) and the remaining 11 (52%) had type 2 DM. Seventeen (64%) of eyes were previously treated (15 (88%) laser therapy, 1 (6%) anti-VEGF therapy, 1 (6%) both therapies), whilst the other 6 (26%) were treatment naïve (Table 1). Twelve patients (57%) were imaged with the Avanti RTVue XR, 5 (24%) patients with the Cirrus HD-OCT 5000 and 4 (19%) patients with the DRI Triton swept-source OCTA. Thirty-five NVCs were included in the analysis, 12 (34%) were NVD and 23 (66%) were NVE. Fourteen (61%) eyes had 1 NVC included, 6 (26%) had 2 NVCs and 3 (13%) had 3 NVCs. The majority of the NVEs (19, 83%) were located inside the vascular arcades.
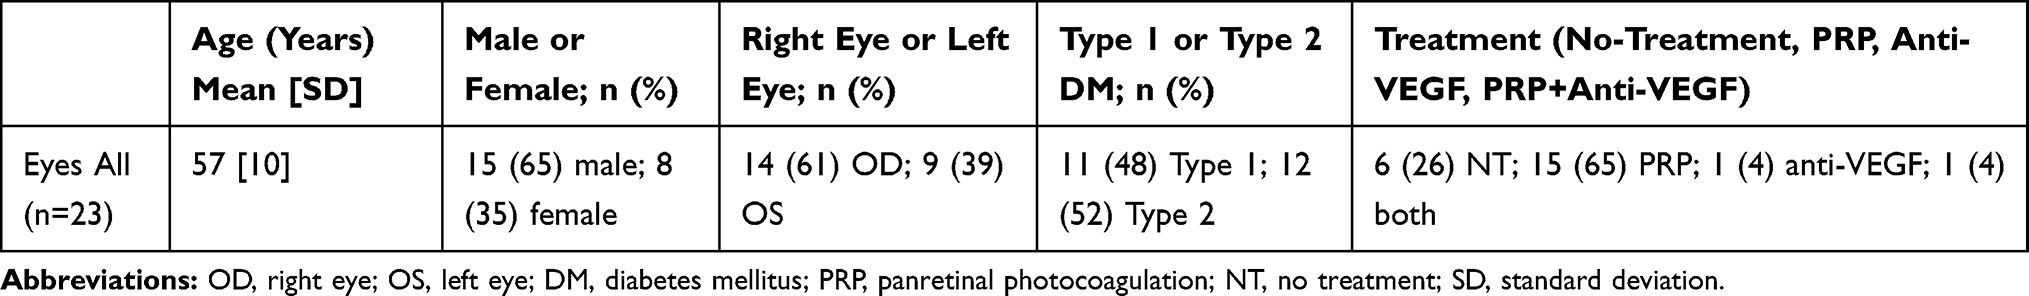 |
Table 1 Clinical Characteristics of the Eyes Enrolled |
Structural OCT Analysis of the NVCs
The distribution of the status of the posterior hyaloid for all NVCs was: 18 (51%) attached, 14 (40%) tethered and 3 (9%) detached. In the subgroup of NVEs, 7 (30%) were flat, 15 (65%) were forward and 1 (4%) was tabletop, all breaching the ILM. The statistical analysis showed no association between the posterior hyaloid status and the NVE type (flat, forward, tabletop), p=0.65. Also, the posterior hyaloid status was independent of the eye treatment performed, p=0.20. The NVDs were sitting on the disc in 6 (50%) cases and protruding in a sea fan configuration in the remaining 6 (50%).
Optical Coherence Tomography Angiography Features of NVCs
Flow signal was observed in the majority of NVCs (31, 89%), namely in all the NVEs (Figures 1–3) and in 8 (67%) of the NVDs (Figures 4 and 5). The en face projections showed the active NVCs as vascular loops or filamentous irregular new vessels (Figures 1–5). EVP, observed in OCTA as an intense growth of irregular small-caliber vessels, was found in 13 (37%) NVCs (9 (39%) of NVEs and 4 (33%) of NVDs). In the subgroup of NVEs, 20 (87%) had adjacent NPAs, identified as retinal areas of absent flow signal or sparse capillary density (Figures 2 and 3). IRMAs were noted next to 16 (70%) of the NVEs (Figures 2 and 3). There was no relation between NPAs and IRMAs adjacent to the NVE (p=0.21). With respect to the morphologic classification, 13 (57%) were type 1 (Figure 2), 0 (0%) were type 2, 5 (22%) were type 3 (Figure 1) and 5 (22%) were classified as other. No association was found between the morphologic classification and NVE type or posterior hyaloid state (respectively, p=0.65 and p=0.72). In the subgroup of NVDs, OCTA showed flow signal within 8 (67%) of the NVCs, indicating disease activity (Figures 4 and 5), as corroborated with complementary testing. The remaining 4 (33%) did not show intrinsic flow signal within the complexes and were not associated with EVP and were labeled inactive NVDs (Figure 6). Posterior shadowing (Figure 6) was identified in 6 (50%) NVDs, 4 (67%) of them inactive, although the association was not significant (p=0.06).
 |
Figure 1 (A) FA image of an eye with PDR. Note NVE alongside the temporal inferior arcade with a sea fan configuration and leakage. (B) Corresponding OCTA image of the same complex, in which the filamentous irregular new vessels are well outlined and not obscured by fluorescein leakage. (C) OCT B-scan with flow overlay in red showing a flat complex with ILM breaching and flow signal, consistent with active disease. |
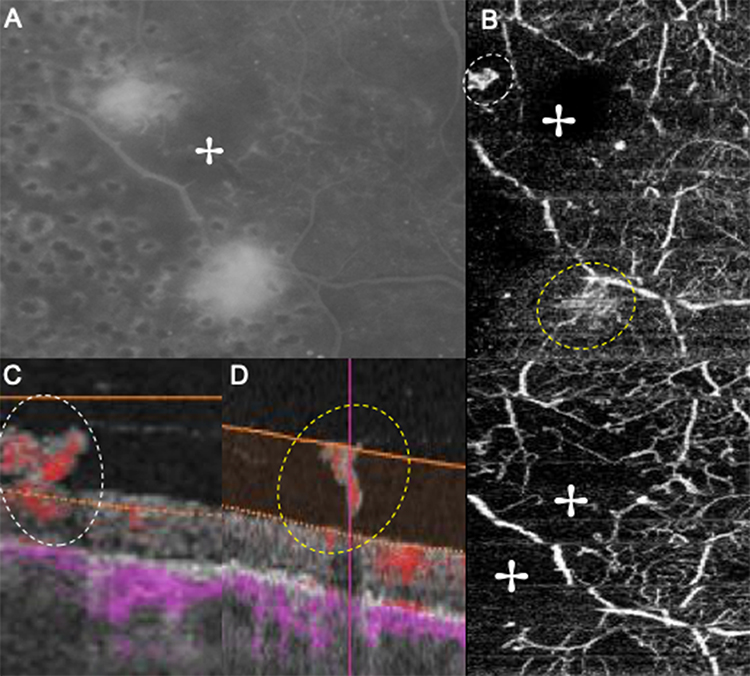 |
Figure 2 Montage showing two NVEs. (A) Late FA image shows leakage associated with both NVEs. (B, top) In OCTA both NVEs appear as vascular loops with irregular new vessels, each one circled by a dashed ellipse. (B, bottom) Areas with absent flow signal adjacent to NVEs (✢) are seen, corresponding to the capillary nonperfusion evidenced on FA. (C and D) B-scans of the NVEs show ILM breaching and flow signal, indicating disease activity, in agreement with the FA. Each NVE is circled by a colored dashed ellipse matching the en face image in (B, top). |
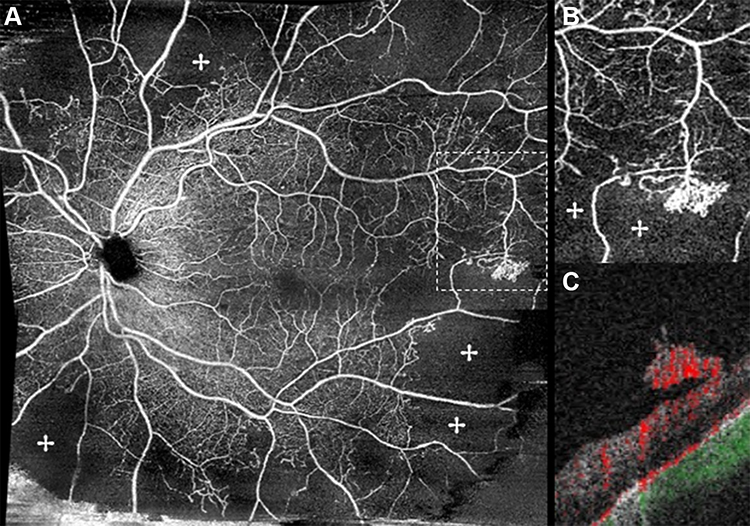 |
Figure 3 (A) En face OCTA 8 x 8 mm montage showing significant areas of absent flow signal (✢) and a temporal NVE. (B) Magnification of the area within the dotted rectangle in (A) shows the detailed neovascular complex with associated retinal nonperfusion areas (✢) and flow signal in the B-scan (C). |
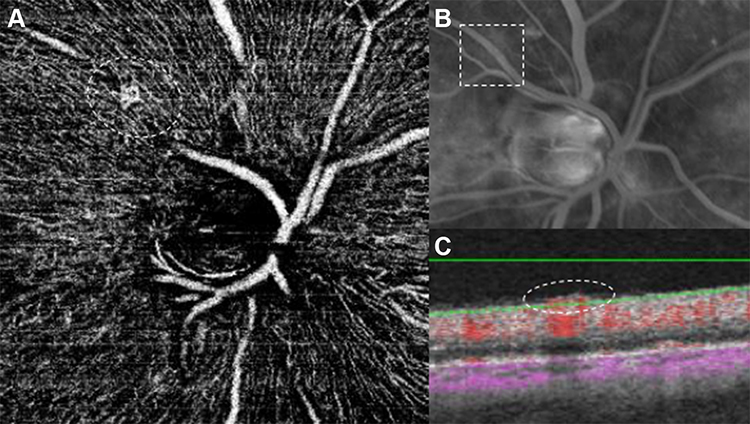 |
Figure 4 Imaging study of a neovascular complex of the right eye. (A) The OCTA image clearly shows the new vessels, seen as an irregular vascular loop on a healthy retinal vessel (encircled by the dashed line). (B) Note that on the FA image, no clear leakage is identified in the corresponding area depicted by the dashed rectangle. (C) The matching OCT B-scan with flow overlay clearly shows flow signal and the new vessel breaching the ILM (encircled by the dashed ellipse). |
 |
Figure 5 Top row (A and B): OCTA shows the morphology of 2 cases of NVD – new vessels with terminal loops and irregular proliferation of small-caliber vessels. (A) was classified as having EVP. Bottom row (C and D): Co-registered OCT B-scan images with flow overlay in red showing layer segmentation of the corresponding en face OCT angiograms and flow signal within the NVDs, indicating disease activity. |
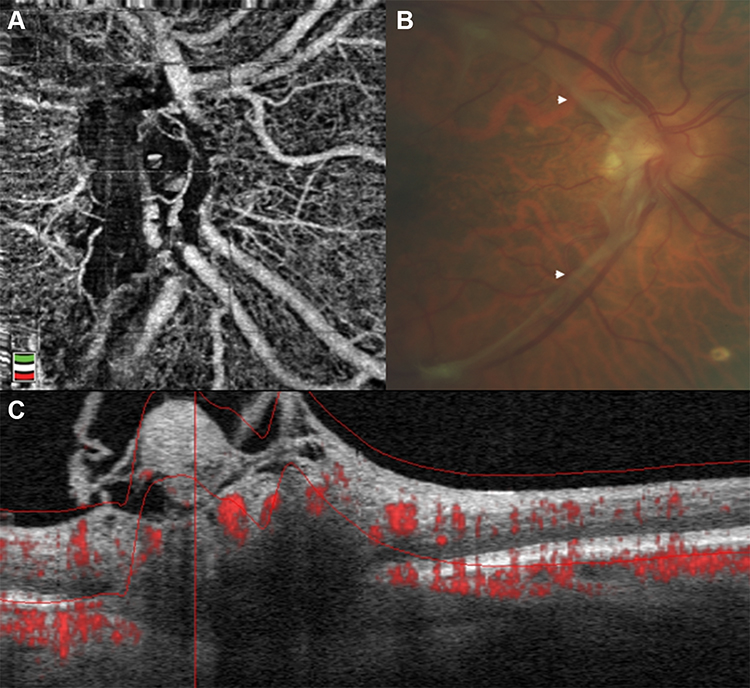 |
Figure 6 Example of treated inactive NVD. (A) OCTA en face projections of the optic disc reveals posterior shadowing which is correlated with fibrotic tissue and there is no EVP. (B) Color fundus photograph demonstrates a whitish fibrotic membrane (arrowheads) consistent with quiescent NVD. (C) Matching OCT B-scan with flow overlay shows protrusion from the disc and no flow signal within the complex, in agreement with disease inactivity. |
Case Presentation
Case 1
A 49-year-old male patient with type 1 DM presented with active PDR in the right eye with NVE, identified in OCTA as multiple filamentous irregular new vessel flow signals localized in the temporal retina (Figure 7A). The corresponding OCT B-scan with flow overlay showed a small flat NVE with discrete ILM breaching, differentiating it from an IRMA, and flow signal, indicating disease activity. No treatment was performed. At 11 months follow-up, OCTA (Figure 7B) showed the same features while the corresponding B-scan with flow overlay revealed disease progression with protrusion of the complex.
 |
Figure 7 Case showing progression of NVE over time. Left images were obtained in an early disease stage. OCTA en face image (A, top) showing a small temporal NVE within the dashed circle. Corresponding OCT B-scan with flow overlay (A, bottom) shows a flat NVE with breaching of the ILM and flow signal (located within the dashed circle). Follow-up OCTA images revealed the same features in the en face OCTA, (B, top; NVE located within the dashed circle) while the corresponding OCT B-scan (B, bottom) revealed NVE progression (situated within the dashed circle), with ILM breaching and new protrusion. |
Case 2
A 53-year-old patient with type 1 DM presented with active PDR in the right eye with NVD, identified as looped and irregular flow signals within the temporal half of the disc (Figure 8A) indicating disease activity. Panretinal photocoagulation was performed and at 3-months follow-up, same location OCTA (Figure 8B) showed significant NVD flow signal regression with fewer pruned vascular signals. A quantitative analysis using the device’s ETDRS perfusion density map centered on the NVD showed a 20% reduction in perfusion density (from 21.2% to 16.9%), corroborating the qualitative data. The co-registered OCT B-scan with flow overlay showed persistent reflective tissue with reduced intrinsic flow signal.
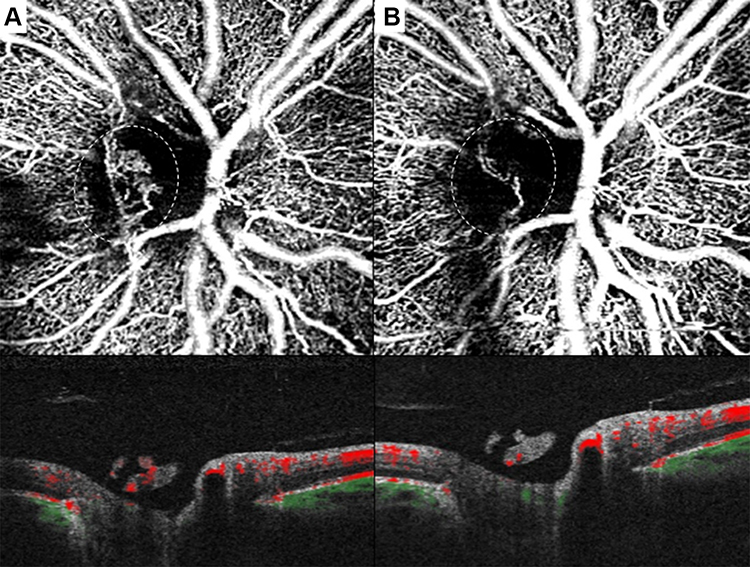 |
Figure 8 OCT angiograms of PDR treated with laser photocoagulation. Left column: (A, top) Baseline en face OCTA showed the presence of NVD with multiple irregular and looped new vessels (located within the dashed circle). (A, bottom) Co-registered OCT B-scan with flow overlay revealed the NVD protruding from the disc and the presence of flow signal within the complex. (B) Same patient OCTA after PRP treatment - the en face image (top) showed significant regression of the NVD (within the dashed circle) and the B-scan with flow overlay (bottom) demonstrated less flow signal, consistent with regressing NVD. |
Discussion
Previous studies12–14,16–18 have shown that structural OCT is useful to observe the morphology of NVCs and their relationship with the adjacent tissue layers. It was also demonstrated that this technique can be useful to evaluate markers of neovascular activity.16 However, it does not evaluate the presence of blood flow within the vessels, which would be important to determine the activity of the NVC. The current gold-standard technique, FA, allows us to assess blood vessel flow but is an invasive procedure and the leakage observed often obscures the morphology of the NVC. OCTA is a useful noninvasive technique that complements and enhances the information given by the structural OCT, namely it can provide en face projections of the retina where it is possible to visualize vessels where flow signal is present. This allows to identify several vascular abnormalities and to extract further information about their morphology and relationships.25
In the present study, we analyzed neovascular features in PDR using OCTA, but also included structural features of interest in PDR such as the morphology of the NVCs and the status of the posterior vitreous.16,17 Thirty-five NVCs were evaluated, of which 34% were NVDs and 66% NVEs. In all cases, NVCs were identified in the structural OCT as tissue of medium to high reflectivity. NVEs breached the ILM and appeared in a flat (35%), forward (61%) or tabletop configuration (4%). NVDs appeared as tissue sitting above or protruding from the disc. We were able to evaluate the relationship between the NVCs and the posterior vitreous, as has been previously demonstrated.17 The status of the posterior vitreous is significant in PDR evaluation as the posterior hyaloid acts as scaffold for NVC growth and the presence of complete PVD is believed to be protective for the development of PDR.17,18,34 As expected, in our series, an attached/tethered posterior hyaloid was observed in most NVCs (91%). En face OCTA was particularly helpful in displaying the morphology of the NVCs showing flow signal. Neovascular flow was observed in 100% of NVEs and in 50% of NVDs, which was corroborated with other imaging modalities. The detection of flow in NVCs using OCTA has potential to obviating the need for additional more invasive dye-based imaging. We16 have previously tried to identify markers of neovascular activity using structural OCT alone before the advent of OCTA, but now OCTA renders the evaluation considerably simpler and the case presentations demonstrate its usefulness after treatment.18,35,36 In the cases of NVCs without flow signal, all of which were NVDs, all had posterior shadowing. We hypothesize that this shadowing is related with loss of transmission from the fibrotic tissue proliferating associated with the NVD. The lack of flow signal was also a sign of neovascular inactivity. These findings would be consistent with the evolution of fibrovascular tissue in NVCs, which has been described in histologic studies.37,38 These studies reported that in the early stages the NVCs proliferate devoid of fibrotic tissue, then are followed by an intermediate stage where translucent fibrotic connective tissue progressively fills the intervascular spaces, resulting in the formation of a dense avascular scar in the late stage.38,39 This latter stage presents a plausible explanation for our OCTA findings in these NVDs.
Using OCTA we were also able to assess other NVC characteristics. In the case of NVEs, we were able to correctly localize these vascular abnormalities, visualize their morphologic features and to establish relationships with other retinal abnormalities. Based on several of these characteristics, other studies proposed different classifications using OCTA.29,33 Pan et al29 in their recent study utilized several of these, including our classification17 and created a novel one. We tried to apply their classification to our sampled NVEs. Relative to type 1 and type 3 groups our results were not much different, as we identified 52% type 1 and 22% type 3. The major difference was in type 2 NVEs, where Pan et al29 identified 40% of these complexes whereas we did not. Some NVEs were challenging to classify according to these discreet categories possibly as it was difficult to distinguish the point of origin in the retinal layers due to shadowing and resolution of the devices. In some cases, we were not able to meet all the criteria assigned for each type and in 27% of the NVE, we did not match the new vessels arising as the configurations proposed. EVP was encountered in 37% of cases and all with active disease. Ishibazawa et al33 and Zhang et al36 found EVP in a higher number of cases, but we hypothesize that the difference is due to the different characteristics of the samples, namely in our study 74% of the eyes were previously treated, whereas in the first study only 50% of the eyes had been previously treated and in the latter all the NVDs had been untreated for at least 6 months. Nevertheless, we agree EVP is associated with active disease, as we have seen in our sample, and, along with flow signal, EVP may be a useful marker in evaluating PDR. A detailed quantitative analysis to determine the area of the NVCs has also proven useful, but less efficient in clinical practice if not incorporated in the equipment software.33,36 OCTA was also helpful in identifying retinal nonperfusion areas and IRMAs. NPAs were identified as areas of absent flow signal or only with sparse capillaries. We found a high frequency (87%) of NPAs adjacent to NVEs. Similar results were also encountered by de Carlo et al30 and Elbendary et al.35 These results corroborate the idea of an association with ischemia and consequent VEGF release that stimulates the pathologic angiogenesis.30 Although we have not aimed to specifically evaluate IRMAs, we found them adjacent to 70% of NVEs. The presence of these vascular abnormalities near NVEs supports the hypothesis that IRMA are portions of preretinal neovascularization that have not yet breached the ILM.18,30
The eye tracking software on most OCTA devices makes it possible to track the vascular lesions in follow-up observation, as shown in the case presentations. These capabilities alone or in combination with other image techniques can be very useful in PDR screening and monitoring, or to guide surgical or clinical treatments. Another advantage is the fact that OCTA is a noninvasive technique, allowing frequent testing, including in patients ineligible for FA, such as in pregnancy, contrast anaphylaxis or renal failure. For example in pregnancy, a state known to be associated with diabetic retinopathy worsening,40 OCTA can be useful in distinguishing between IRMAs and neovascularization by confirming ILM breaching and the presence of flow. Also, compared to FA, OCTA lacks the contrast leakage that obscures the NVC morphology and in early and small NVCs it may be more useful.18
This study has limitations such as its retrospective nature, the sample size and a possible selection bias, since a great number of NVCs were documented in their early evolution stage and in the posterior retina. Also, we used 3 different OCTA devices with different wavelengths and algorithms which may account for differences in the ability to detect the lesions. Conversely, we have shown that all 3 devices are useful in evaluating neovascularization in PDR which may be of interest to clinicians that are more familiar with a specific machine. OCTA is a promising technique but it also has its own limitations. OCTA scans have a narrow field of view and the increase of the field of view results in loss of resolution. Also, it does not allow for a complete evaluation of the peripheral retina and there are some vascular abnormalities that are not apparent in OCTA, namely those with a slow flow signal. Wide-field OCTA will likely become an important imaging modality in PDR.18,41 Finally, OCTA is more prone to artifact than FA, such as “ghost images”, shadow artifacts and motion artifacts due to ocular, head or eyelid movements.
In summary, OCTA, despite some current technical limitations, is becoming important in PDR evaluation and gaining further relevance in this area, becoming a quick and inexpensive tool in diagnosing and guiding treatment.
Abbreviations
DM, diabetes mellitus; EVP, exuberant vascular proliferation; FA, fluorescein angiography; ILM, internal limiting membrane; IRMA, intraretinal microvascular abnormalities; NPA, retinal nonperfusion areas; NVC, neovascular complex; NVD, neovascularization of the disc; NVE, neovascularization elsewhere; OCT, optical coherence tomography; OCTA, optical coherence tomography angiography; OCTARA, OCT angiography ratio analysis; OMAG, optical microangiography; PDR, proliferative diabetic retinopathy; SSADA, split-spectrum amplitude decorrelation angiography; VEGF, vascular endothelial growth factor.
Ethical Approval
This study was approved by Hospital de Santa Maria local ethics committee (Lisbon, Portugal) and by the Western Institutional Review Board (Olympia, WA) and was conducted in accordance with the ethical principles of the Declaration of Helsinki and International Conference on Harmonization Good Clinical Practice Guidelines. Written informed consent was obtained from all participants. The patients described in the representative cases provided informed consent for their case details and images to be published.
Author Contributions
S.V.-P. and J.J.S. contributed equally to the work.
All authors made substantial contributions to conception and design, acquisition of data, or analysis and interpretation of data; took part in drafting the article or revising it critically for important intellectual content; agreed to submit to the current journal; gave final approval of the version to be published; and agree to be accountable for all aspects of the work.
Funding
LuEsther T. Mertz Retinal Research Center, Manhattan Eye, Ear and Throat Hospital/North Shore Long Island Jewish Hospital, New York, NY, USA, and The Macula Foundation, Inc., New York, NY, USA. The funding organizations had no role in the design or conduct of this research.
Disclosure
Dr. Vaz-Pereira reports consultant/personal fees from Alimera Sciences, Bayer and Novartis.
Dr. J. J. Silva has nothing to disclose.
Dr. K. Bailey Freund has served as a consultant for Optovue, Allergan, Heidelberg Engineering, Bayer, Zeiss, and Novartis. He receives grant support from Genentech/Roche.
Dr. Engelbert is a consultant for Genentech, Bayer, Allergan and Alimera Sciences. The authors report no other conflicts of interest in this work.
References
1. Archer DB. Neovascularization of the retina. Trans Ophthalmol Soc UK. 1976;96:471–493.
2. Silva P, Cavallerano J, Sun J. Proliferative diabetic retinopathy. In: Sadda S, editor. Ryan’s Retina.
3. Early Treatment Diabetic Retinopathy Study Research Group. Grading diabetic retinopathy from stereoscopic color fundus photographs – an extension of the modified Airlie House classification. ETDRS report number 10. Ophthalmology. 1991;98(5):786–806. doi:10.1016/S0161-6420(13)38012-9.
4. Norton EW, Gutman F. Diabetic retinopathy studied by fluorescein angiography. Ophthalmologica. 1965;150(1):5–17. doi:10.1159/000304822
5. Gass JD. A fluorescein angiographic study of macular dysfunction secondary to retinal vascular disease. IV. Diabetic retinal angiopathy. Arch Ophthalmol. 1968;80(5):583–591. doi:10.1001/archopht.1968.00980050585004
6. Stanga PE, Papayannis A, Tsamis E, et al. New findings in diabetic maculopathy and proliferative disease by swept-source optical coherence tomography angiography. Dev Ophthalmol. 2016;56:113–121. doi:10.1159/000442802
7. Yeung L, Lima VC, Garcia P, et al. Correlation between spectral domain optical coherence tomography findings and fluorescein angiography patterns in diabetic macular edema. Ophthalmology. 2009;116(6):1158–1167. doi:10.1016/j.ophtha.2008.12.063
8. Comyn O, Heng LZ, Ikeji F, et al. Repeatability of Spectralis OCT measurements of macular thickness and volume in diabetic macular edema. Invest Ophthalmol Vis Sci. 2012;53(12):7754–7759. doi:10.1167/iovs.12-10895
9. Hatef E, Khwaja A, Rentiya Z, et al. Comparison of time domain and spectral domain optical coherence tomography in measurement of macular thickness in macular edema secondary to diabetic retinopathy and retinal vein occlusion. J Ophthalmol. 2012;2012:354783. doi:10.1155/2012/354783
10. Lee DH, Kim JT, Jung DW, et al. The relationship between foveal ischemia and spectral-domain optical coherence tomography findings in ischemic diabetic macular edema. Invest Ophthalmol Vis Sci. 2013;54(2):1080–1085. doi:10.1167/iovs.12-10503
11. Otani T, Kishi S. Tomographic assessment of vitreous surgery for diabetic macular edema. Am J Ophthalmol. 2000;129(4):487–494. doi:10.1016/S0002-9394(99)00409-2
12. Cho H, Alwassia AA, Regiatieri CV, et al. Retinal neovascularization secondary to proliferative diabetic retinopathy characterized by spectral domain optical coherence tomography. Retina. 2013;33(3):542–547. doi:10.1097/IAE.0b013e3182753b6f
13. Muqit MM, Stanga PE. Fourier-domain optical coherence tomography evaluation of retinal and optic nerve head neovascularisation in proliferative diabetic retinopathy. Br J Ophthalmol. 2014;98(1):65–72. doi:10.1136/bjophthalmol-2013-303941
14. Muqit MM, Stanga PE. Swept-source optical coherence tomography imaging of the cortical vitreous and the vitreoretinal interface in proliferative diabetic retinopathy: assessment of vitreoschisis, neovascularisation and the internal limiting membrane. Br J Ophthalmol. 2014;98(7):994–997. doi:10.1136/bjophthalmol-2013-304452
15. Lee CS, Lee AY, Sim DA, et al. Reevaluating the definition of intraretinal microvascular abnormalities and neovascularization elsewhere in diabetic retinopathy using optical coherence tomography and fluorescein angiography. Am J Ophthalmol. 2015;159(1):101–110.e1. doi:10.1016/j.ajo.2014.09.041
16. Vaz-Pereira S, Zarranz-Ventura J, Sim DA, et al. Optical coherence tomography features of active and inactive retinal neovascularization in proliferative diabetic retinopathy. Retina. 2016;36(6):1132–1142. doi:10.1097/IAE.0000000000000869
17. Vaz-Pereira S, Dansingani KK, Chen KC, et al. Tomographic relationships between retinal neovascularization and the posterior vitreous in proliferative diabetic retinopathy. Retina. 2017;37(7):1287–1296. doi:10.1097/IAE.0000000000001336
18. Vaz-Pereira S, Morais-Sarmento T, Esteves Marques R. Optical coherence tomography features of neovascularization in proliferative diabetic retinopathy: a systematic review. Int J Retina Vitreous. 2020;6:26.
19. Mariampillai A, Standish BA, Moriyama EH, et al. Speckle variance detection of microvasculature using swept-source optical coherence tomography. Opt Lett. 2008;33(13):1530–1532. doi:10.1364/OL.33.001530
20. Enfield J, Jonathan E, Leahy M. In vivo imaging of the microcirculation of the volar forearm using correlation mapping optical coherence tomography (cmOCT). Biomed Opt Express. 2011;2(5):1184–1193. doi:10.1364/BOE.2.001184
21. Miura M, Makita S, Iwasaki T, et al. Three-dimensional visualization of ocular vascular pathology by optical coherence angiography in vivo. Invest Ophthalmol Vis Sci. 2011;52(5):2689–2695. doi:10.1167/iovs.10-6282
22. Jia Y, Tan O, Tokayer J, et al. Split-spectrum amplitude-decorrelation angiography with optical coherence tomography. Opt Express. 2012;20(4):4710–4725. doi:10.1364/OE.20.004710
23. Jia Y, Bailey ST, Wilson DJ, et al. Quantitative optical coherence tomography angiography of choroidal neovascularization in age-related macular degeneration. Ophthalmology. 2014;121(7):1435–1444. doi:10.1016/j.ophtha.2014.01.034
24. Spaide RF, Klancnik JM
25. Huang Y, Zhang Q, Thorell MR, et al. Swept-source OCT angiography of the retinal vasculature using intensity differentiation-based optical microangiography algorithms. Ophthalmic Surg Lasers Imaging Retina. 2014;45(5):382–389. doi:10.3928/23258160-20140909-08
26. Ishibazawa A, Nagaoka T, Takahashi A, et al. Optical coherence tomography angiography in diabetic retinopathy: a prospective pilot study. Am J Ophthalmol. 2015;160(1):35–44.e1. doi:10.1016/j.ajo.2015.04.021
27. Hwang TS, Jia Y, Gao SS, et al. Optical coherence tomography angiography features of diabetic retinopathy. Retina. 2015;35(11):2371–2376. doi:10.1097/IAE.0000000000000716
28. Miura M, Hong YJ, Yasuno Y, et al. Three-dimensional vascular imaging of proliferative diabetic retinopathy by Doppler optical coherence tomography. Am J Ophthalmol. 2015;159(3):528–538.e3. doi:10.1016/j.ajo.2014.12.002
29. Pan J, Chen D, Yang X, et al. Characteristics of neovascularization in early stages of proliferative diabetic retinopathy by optical coherence tomography angiography. Am J Ophthalmol. 2018;192:146–156. doi:10.1016/j.ajo.2018.05.018
30. de Carlo TE, Bonini Filho MA, Baumal CR, et al. Evaluation of preretinal neovascularization in proliferative diabetic retinopathy using optical coherence tomography angiography. Ophthalmic Surg Lasers Imaging Retina. 2016;47(2):115–119. doi:10.3928/23258160-20160126-03
31. Vaz-Pereira S, Monteiro-Grillo M, Engelbert M. Proliferative diabetic retinopathy imaged by near-infrared reflectance. Arch Soc Esp Oftalmol. 2019;94(1):e1. doi:10.1016/j.oftal.2018.06.023
32. Li XX, Wu W, Zhou H, et al. A quantitative comparison of five optical coherence tomography angiography systems in clinical performance. Int J Ophthalmol. 2018;11:1784–1795.
33. Ishibazawa A, Nagaoka T, Yokota H, et al. Characteristics of retinal neovascularization in proliferative diabetic retinopathy imaged by optical coherence tomography angiography. Invest Ophthalmol Vis Sci. 2016;57(14):6247–6255. doi:10.1167/iovs.16-20210
34. Ono R, Kakehashi A, Yamagami H, et al. Prospective assessment of proliferative diabetic retinopathy with observations of posterior vitreous detachment. Int Ophthalmol. 2005;26(1–2):15–19. doi:10.1007/s10792-005-5389-2
35. Elbendary AM, Abouelkheir HY. Bimodal imaging of proliferative diabetic retinopathy vascular features using swept source optical coherence tomography angiography. Int J Ophthalmol. 2018;11:1528–1533.
36. Zhang X, Wu C, Zhou LJ, et al. Observation of optic disc neovascularization using OCT angiography in proliferative diabetic retinopathy after intravitreal conbercept injections. Sci Rep. 2018;8(1):3972. doi:10.1038/s41598-018-22363-0
37. Dobree JH. Proliferative diabetic retinopathy: evolution of the retinal lesions. Br J Ophthalmol. 1964;48:637–649.
38. McMeel JW. Diabetic retinopathy: fibrotic proliferation and retinal detachment. Trans Am Ophthalmol Soc. 1971;69:440–493.
39. Roy S, Amin S, Roy S. Retinal fibrosis in diabetic retinopathy. Exp Eye Res. 2016;142:71–75. doi:10.1016/j.exer.2015.04.004
40. Axer-Siegel R, Hod M, Fink-Cohen S, et al. Diabetic retinopathy during pregnancy. Ophthalmology. 1996;103(11):1815–1819. doi:10.1016/S0161-6420(96)30421-1
41. Russell JF, Shi Y, Hinkle JW, et al. Longitudinal wide-field swept-source OCT angiography of neovascularization in proliferative diabetic retinopathy after panretinal photocoagulation. Ophthalmol Retina. 2019;3(4):350–361. doi:10.1016/j.oret.2018.11.008
 © 2020 The Author(s). This work is published and licensed by Dove Medical Press Limited. The
full terms of this license are available at https://www.dovepress.com/terms
and incorporate the Creative Commons Attribution
- Non Commercial (unported, 3.0) License.
By accessing the work you hereby accept the Terms. Non-commercial uses of the work are permitted
without any further permission from Dove Medical Press Limited, provided the work is properly
attributed. For permission for commercial use of this work, please see paragraphs 4.2 and 5 of our Terms.
© 2020 The Author(s). This work is published and licensed by Dove Medical Press Limited. The
full terms of this license are available at https://www.dovepress.com/terms
and incorporate the Creative Commons Attribution
- Non Commercial (unported, 3.0) License.
By accessing the work you hereby accept the Terms. Non-commercial uses of the work are permitted
without any further permission from Dove Medical Press Limited, provided the work is properly
attributed. For permission for commercial use of this work, please see paragraphs 4.2 and 5 of our Terms.