Back to Journals » Clinical Ophthalmology » Volume 10
Optical coherence tomography parameters predictive of visual outcome after anti-VEGF therapy for retinal vein occlusion
Authors Fujihara-Mino A, Mitamura Y ![]() , Inomoto N, Sano H, Akaiwa K, Semba K
, Inomoto N, Sano H, Akaiwa K, Semba K
Received 18 April 2016
Accepted for publication 24 May 2016
Published 18 July 2016 Volume 2016:10 Pages 1305—1313
DOI https://doi.org/10.2147/OPTH.S110793
Checked for plagiarism Yes
Review by Single anonymous peer review
Peer reviewer comments 2
Editor who approved publication: Dr Scott Fraser
Akiko Fujihara-Mino, Yoshinori Mitamura, Naoki Inomoto, Hiroki Sano, Kei Akaiwa, Kentaro Semba
Department of Ophthalmology, Institute of Biomedical Sciences, Tokushima University Graduate School, Tokushima, Japan
Purpose: To determine the optical coherence tomography (OCT) parameters that are predictive of visual outcome after anti-VEGF therapy for a retinal vein occlusion (RVO).
Methods: Fifty-seven eyes with macular edema (ME) secondary to a central or branch RVO treated with bevacizumab or ranibizumab were studied. Spectral-domain OCT and microperimetry were performed before, 1, 3, and 6 months after the treatment and at the final visit. Central retinal thickness (CRT), macular volume (MV), integrity of the external limiting membrane (ELM), ellipsoid zone (EZ), and foveal bulge (FB), and photoreceptor outer segment (PROS) length were determined.
Results: The mean follow-up period was 17.8±11.5 months. In 46 of the 57 eyes, a resolution of the ME was achieved. The pretreatment CRT and MV, presence of intact ELM, EZ, and FB, and PROS length at the time of ME resolution were significantly correlated with the best-corrected visual acuity and retinal sensitivity at the final visit (P<0.050). Multiple regression analyses showed that the pretreatment MV had the highest correlation with the posttreatment best-corrected visual acuity and retinal sensitivity (P<0.050).
Conclusion: The CRT, MV, ELM, EZ, FB, and PROS length are predictive factors for the visual outcome after anti-VEGF therapy for RVO.
Keywords: anti-VEGF therapy, retinal sensitivity, retinal vein occlusion, spectral-domain optical coherence tomography, visual acuity
Introduction
A retinal vein occlusion (RVO) is one of the most common primary vascular diseases of the retina. Vitreous hemorrhages, macular pucker, ischemia, glaucoma, and tractional retinal detachment are common complications associated with RVOs. However, the most common complication and the leading cause of the reduction of vision in eyes with an RVO is macular edema (ME).1 The ME associated with an RVO occasionally resolves spontaneously, but it can also remain for a long period and lead to a decrease of visual function. Therefore, various therapies have been used to treat the ME, eg, grid laser photocoagulation,1,2 pars plana vitrectomy,3 intravitreal injections of triamcinolone acetonide,4 and intravitreal injections of anti-VEGF.5,6 The Branch Vein Occlusion Study reported that conventional grid laser photocoagulation improves the visual acuity to a higher level than the natural course of the disease process.1 After the resolution of the ME, some patients have poor visual function in spite of a complete resolution of the ME. Thus, it would be helpful to know if there is an ocular parameter that can be used to predict the visual outcome after the ME is resolved by therapy.
Earlier studies demonstrated that a disruption of the ellipsoid zone (EZ) or the external limiting membrane (ELM) of the photoreceptors in the optical coherence tomography (OCT) images indicated that the photoreceptors were damaged. It has been reported that a disruption of the EZ or ELM was significantly associated with poor visual function after the resolution of the ME.6,7 It has also been reported that the pretreatment integrity of the EZ was significantly and positively correlated with the visual acuity after the ME was resolved in eyes with a branch RVO (BRVO).8
Careful examination of the spectral-domain OCT (SD-OCT) images of normal eyes has shown that the EZ has a bulge at the central fovea, named the foveal bulge (FB).9 The results of recent OCT studies have shown that the presence or absence of an FB was significantly correlated with the visual acuity in eyes with occult macular dystrophy10 and amblyopia.11 Hasegawa et al9 reported that the presence of an FB was a good marker of the functional properties of the fovea in eyes with a resolved ME associated with BRVO after intravitreal injection of bevacizumab, posterior sub-Tenon injection of triamcinolone acetonide, or a spontaneous resolution of an ME. However, the exact relationship between the FB and visual prognosis after anti-VEGF therapy has not been determined.
Shiono et al12 reported that the photoreceptor outer segments (PROS) length was a good predictor of postoperative visual acuity after surgery for an idiopathic epiretinal membrane. However, the correlation between the PROS length and visual outcomes after anti-VEGF therapy for RVO has not been determined.
The visual function of patients with ME due to RVO is usually assessed by the conventional visual acuity, but this only measures the foveal function. Evaluations of the topographic sensitivity of the entire central retinal field is much more informative.13 It has been shown that fundus-related perimetry is clinically useful in assessing the effects of ME.14,15
The OCT findings, such as status of the EZ, ELM, and central retinal thickness (CRT), have been reported to be predictive factors for the visual outcome after anti-VEGF therapy for RVO.6–8,16–20 However, the correlation between the PROS length or the FB and the visual outcomes after anti-VEGF therapy for RVO has not been determined. In addition, it has not been determined which OCT parameter has the highest impact on the visual outcome after a resolution of the ME remains undetermined.
Thus, the purpose of this study was to determine the pretreatment OCT parameter(s) that is predictive for the posttreatment visual acuity and retinal sensitivity determined by fundus-related microperimetry after anti-VEGF therapy.
Materials and methods
Patients
Fifty-seven eyes of 57 patients (31 men and 26 women) with treatment-naïve acute ME of 1- to 4-months duration secondary to central RVO (CRVO, 15 eyes) or BRVO (42 eyes) were studied. All of the patients who had intravitreal injections of bevacizumab (1.25 mg/0.05 mL) or ranibizumab (0.5 mg/0.05 mL) at the Tokushima University Hospital between June 2011 and September 2014 were retrospectively studied (Table 1). Patients with a CRT ≥250 μm in the OCT images were treated. Patients with a history of cerebral infarction, anti-VEGF therapy, vitrectomy, uveitis, glaucoma, or other vitreoretinal diseases were excluded. The age of the patients ranged from 45 to 87 years with a mean of 67.1±9.5 years (± standard deviation). Only patients followed for more than 6 months posttreatment period were included.
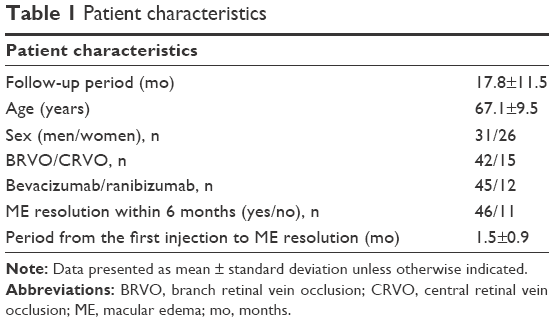 | Table 1 Patient characteristics |
Approval was obtained from the Institutional Review Board of Tokushima University Hospital prior to beginning this study, and the patients gave their written informed consent prior to their inclusion. The procedures used in this study adhered to the tenets of the Declaration of Helsinki.
Ophthalmic examinations
The patients had standard ophthalmic examinations before, 1, 3, and 6 months after the injections and at the final visit. The examinations included measurements of the best-corrected visual acuity (BCVA), slit-lamp biomicroscopy, indirect ophthalmoscopy, color fundus photography, SD-OCT, and microperimetry. The BCVA was measured with a standard Japanese Landolt visual acuity chart, and the decimal visual acuity was converted to the logarithm of the minimal angle of resolution (logMAR) units for the statistical analyses.
Treatments
Patients initially received one intravitreal injection of bevacizumab or ranibizumab, and they were examined monthly for 6 months after the initial injection. If the CRT was ≥250 μm, or the physician determined that additional treatment was necessary, the patients received additional injections of the same anti-VEGF agent.
Forty-five patients who started their treatment between June 2011 and August 2013 received bevacizumab injections, and 12 patients who started treatment between September 2013 and September 2014 received ranibizumab injections. Patients with BRVO who developed areas of capillary nonperfusion exceeding five disc areas on fluorescein angiography during the course of the study, were treated with peripheral scattered laser photocoagulation. Patients with CRVO who developed nonperfusion areas exceeding ten disc areas were also treated with peripheral laser photocoagulation.
SD-OCT
Retinal tomographic images of the macula were obtained by SD-OCT (Spectralis, Heidelberg Engineering, Heidelberg, Germany). Horizontal and vertical scans through the fovea were recorded. The CRT was defined as the average thickness of the central 1 mm circle of the retinal thickness map (Figure 1). The macular volume (MV) was defined as the total MV of the central 3 mm circle because the central 10-degree spot examined by fundus-related microperimetry is comparable to a circle of approximately 3 mm in diameter of the fundus of an emmetropic eye.21,22 The integrity of the ELM, EZ, and FB in the SD-OCT images after the resolution of the ME, was determined by two of the authors (KA and KS) who were masked to the patients’ information. The ELM and EZ lines were considered to be intact when they appeared continuous and had signal intensities similar to those of the peripheral macular area.23 In eyes with an intact EZ line, the presence of a bulge in the EZ line, an FB, was determined. When the evaluations of the two examiners did not agree, the opinion of a third observer (YM) was sought.
 | Figure 1 Microperimetry map and spectral-domain optical coherence tomography (SD-OCT) images of an eye with a branch retinal vein occlusion (71-year-old woman). |
The subjects were divided into three groups: intact ELM, EZ, or FB group; disrupted ELM, EZ, or FB group; and no ME resolution group. The PROS length in the SD-OCT images was measured as the distance between the EZ and the inner border of the retinal pigment epithelium at the foveal center (Figure 1). The PROS length was manually measured by the caliper function of the built-in software in the cross-sectional OCT images, and the PROS lengths of the horizontal and vertical scans were averaged.
Microperimetry
The retinal sensitivity was measured with the Microperimetry 1 (MP1, Nidek, Gamagori, Japan) with automated correction for eye movements as reported in detail previously.23 Goldmann III stimuli and a 4-2 staircase strategy were used, and a rectangular 3×3 degree test grid with 24 stimulus locations covering an area of 10 degrees was tested. The central retinal sensitivity within 10 degrees was defined as the mean retinal sensitivity for the 24 stimulus locations.
Statistical analyses
Repeated-measures analysis of variance (ANOVA) with Greenhouse-Geisser corrections was used to determine the significance of the changes in the BCVA, retinal sensitivity, CRT, and MV. The Bonferroni test was used for the post hoc analysis. The correlations between the OCT parameters and the posttreatment BCVA and retinal sensitivity were determined by Pearson’s correlation tests for simple regression analysis. Data were analyzed using one-factor ANOVA to compare the visual outcomes in the three ELM, EZ, or FB subgroups. Multiple regression analyses were performed to determine the independent OCT parameters with the strongest correlations with the visual outcomes. A P-value of <0.05 was considered statistically significant. All analyses were done with the SPSS version 22.0 (IBM Corporation, Armonk, NY, USA) and the StatView software (Abacus; Abacus Concepts, Inc., Berkeley, CA, USA).
Results
Changes of visual functions and SD-OCT findings after anti-VEGF treatment
The mean follow-up period was 17.8±11.5 months with a range of 6 to 44 months. All patients were followed for at least 6 months after the initial injection of bevacizumab or ranibizumab. The injections were administered two to nine times (3.3±1.7 times) to each patient during the follow-up period. During the follow-up period, 20 eyes (35.1%) received peripheral scattered laser photocoagulation to prevent the development of retinal neovascularization and vitreous hemorrhage.
The postinjection changes of the visual acuity, retinal sensitivity, and SD-OCT findings are presented in Table 2. Significant differences were observed in the BCVA, retinal sensitivity, CRT, and MV between the baseline and post-treatment times (P<0.001). The BCVA, retinal sensitivity, CRT, and MV at 1, 3, and 6 months and at the final visit were significantly better than those at the baseline (all P<0.001).
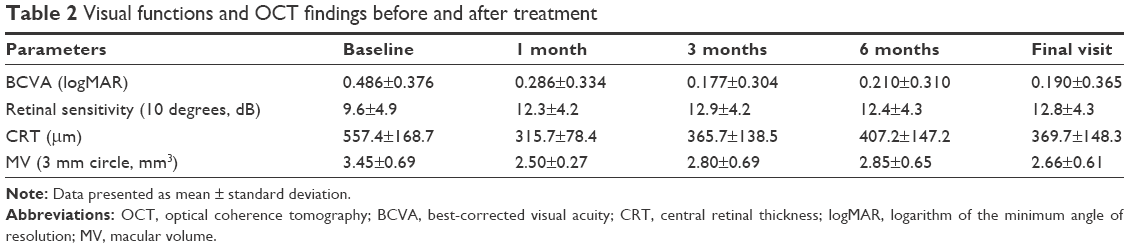 | Table 2 Visual functions and OCT findings before and after treatment |
In 46 of the 57 eyes, a complete resolution of the ME was achieved by 1.5±0.9 months after the treatment. The ME in the other eleven eyes was not resolved during the 6-month postinjection period. After the 6-month postinjection period, vitrectomy was performed on three of eleven eyes, sub-Tenon’s capsule triamcinolone acetonide injection in two eyes, grid laser photocoagulation in two eyes, and the other patients refused additional treatments. In seven eyes undergoing treatments other than anti-VEGF therapy, the final visit was defined as the last visit before the other treatment. Data obtained after treatments other than anti-VEGF therapy were excluded from the study.
Correlation between pretreatment ME and visual outcomes
The baseline CRT was significantly correlated with the BCVA and retinal sensitivity at 6 months after the treatment and at the final visit (both P<0.005, Table 3). Similarly, the baseline MV was significantly correlated with the BCVA and retinal sensitivity at 6 months and final visit (both P<0.001, Figures 2 and 3). The coefficients of correlation for the MV and the BCVA or retinal sensitivities were higher than those for the CRT. Because the CRT and MV can be confounding variables, the baseline MV instead of the CRT was used as the independent variable in the multiple regression analyses for determining the correlations with the visual outcomes.
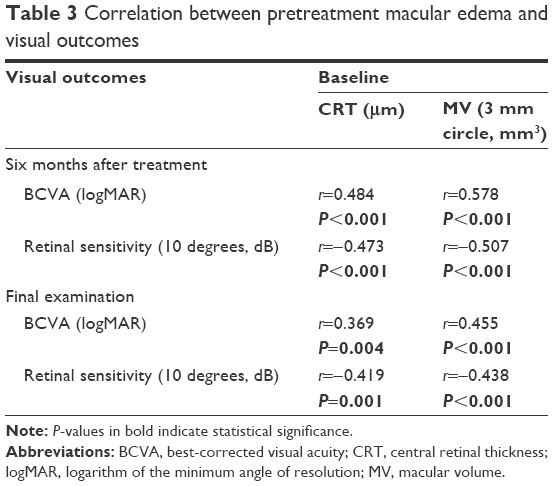 | Table 3 Correlation between pretreatment macular edema and visual outcomes |
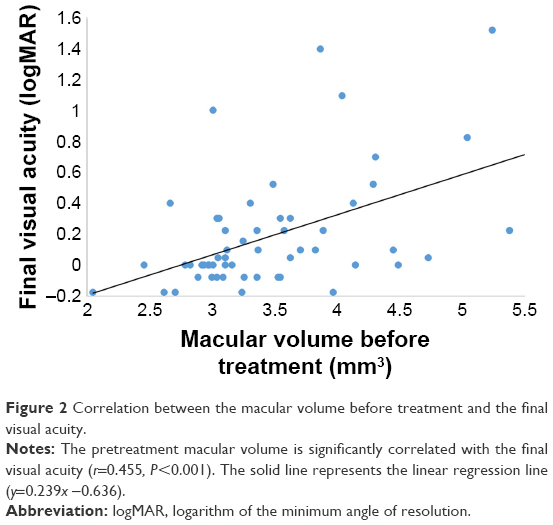 | Figure 2 Correlation between the macular volume before treatment and the final visual acuity. |
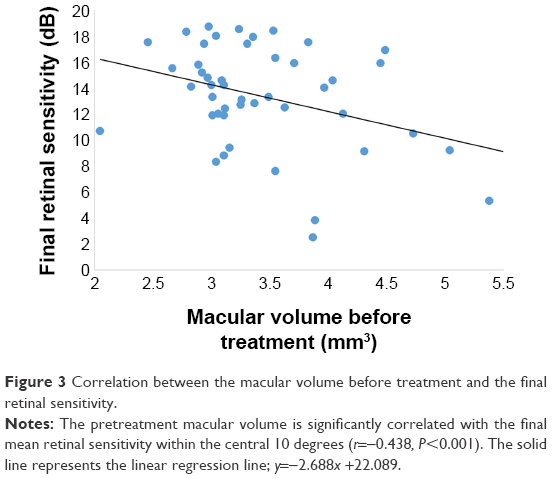 | Figure 3 Correlation between the macular volume before treatment and the final retinal sensitivity. |
Correlation between retinal morphology at time of ME resolution and visual outcomes
The presence of an intact ELM at the time of ME resolution was significantly correlated with the BCVA and retinal sensitivity 6 months after the treatment and at the final visit (all P<0.050, Table 4). The presence of an intact EZ at the time of ME resolution was also significantly correlated with the BCVA and retinal sensitivity at 6 months and the final visit (all P<0.050). In addition, the presence of an FB was significantly correlated with the BCVA and retinal sensitivity at 6 months and the final visit (all P<0.050).
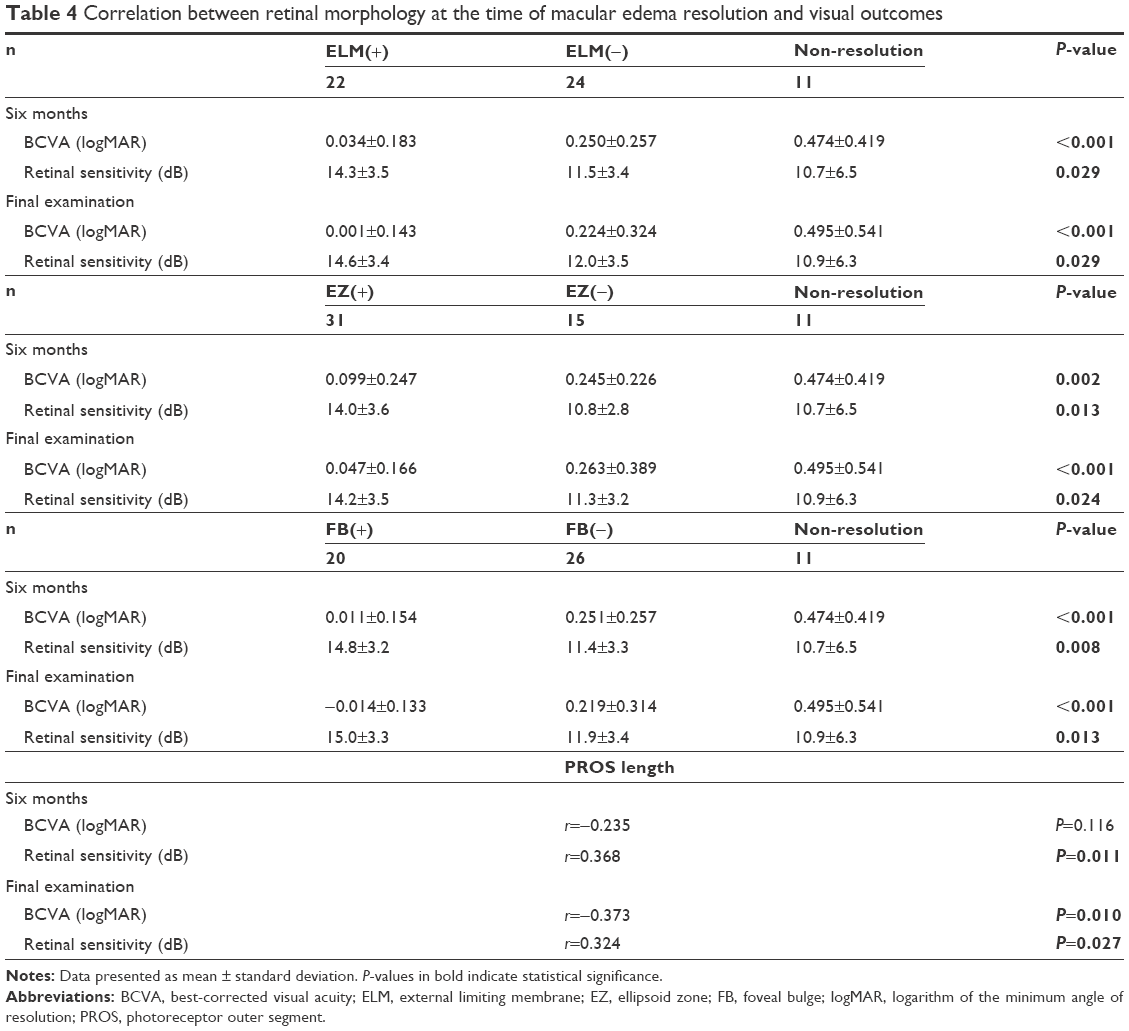 | Table 4 Correlation between retinal morphology at the time of macular edema resolution and visual outcomes |
The PROS length after the ME resolution was significantly correlated with the BCVA and retinal sensitivity at the final visit (r=−0.373, P=0.010 for BCVA; r=0.324, P=0.027 for retinal sensitivity; Table 4). The PROS length at the time of ME resolution was significantly correlated with the retinal sensitivity at 6 months (r=0.368, P=0.011), but not with the BCVA at 6 months (r=−0.235, P=0.116).
Because the presence of an FB had a higher correlation than the PROS length with the visual outcomes, the FB instead of PROS length was used as the independent variable in the multiple regression analyses.
Multiple regression analyses of OCT parameters independently contributing to the visual outcomes
Multiple regression analyses of the visual outcomes by the baseline MV, intact ELM and EZ, and presence of an FB at the time of ME resolution was performed. The multiple regression analyses showed that the baseline MV had the highest coefficient correlation with the BCVA and retinal sensitivity at 6 months and the final visit (all P<0.050, Table 5).
 | Table 5 Multiple regression analyses of OCT parameters independently contributing to the visual outcomes |
A forward stepwise method was used to determine the factors most associated with the BCVA at 6 months and the final visit. The highest correlations were for the BCVA at 6 months or the final visit, the baseline MV, and presence of an FB with a determination coefficient (R2) of 0.459 and 0.331, respectively (both P<0.001).
A forward stepwise method was also used to determine factors most associated with the retinal sensitivity at 6 months and the final visit. The highest correlation was between the retinal sensitivity at 6 months or the final visit and the baseline MV with R2 of 0.257 and 0.192, respectively (both P<0.001).
Discussion
Hasegawa et al9 reported that the baseline BCVA, CRT, integrity of the ELM, presence of subretinal fluid, FB beneath the fovea, and age were all significantly correlated with the final visual acuity after intravitreal injections of bevacizumab or posterior sub-Tenon injection of triamcinolone acetonide. Other studies have shown that the baseline BCVA, age, and presence of subretinal fluid were predictive factors for the final visual acuity in eyes after intravitreal injection of bevacizumab or grid laser photocoagulation for ME associated with BRVOs.24–26 Ach et al27 reported that the initial CRT was a predictive factor for short- and long-term responses to anti-VEGF treatment.
In our study, the CRT and MV before the treatment and presence of intact ELM, EZ, and FB at the time of the ME resolution were significantly correlated with the BCVA and retinal sensitivity 6 months after the treatment and at the final visit. On the other hand, Hasegawa et al9 reported that the final decimal visual acuity varied from 0.3–1.2 after ME resolution even with an intact EZ line at the central fovea. Thus, they concluded that the presence of an intact EZ line at the central fovea may not be a good indicator of the visual recovery.
Kriechbaum et al28 reported that the functional parameters, such as the BCVA, presence and size of a scotoma, and overall macular sensitivity were significantly associated with the morphologic OCT findings after anti-VEGF therapy for ME secondary to RVO. In their study, the CRT and mean retinal thickness had an important impact on the BCVA. They reported that the microperimetry outcomes had the highest correlation with the CRT. Ota et al16 reported a significant correlation between the baseline CRT and final BCVA in patients with a BRVO and a persistent ME after the treatments. Tsujikawa et al29 reported that the CRT of eyes with subretinal fluid secondary to an RVO was significantly thicker than that of eyes without subretinal fluid. The thicker CRT, which represents the severity of ME, may lead to a disruption of the ELM integrity and damage the photoreceptors.9
The multiple regression analyses showed that the pre-treatment MV had the highest correlation with the post-treatment BCVA and retinal sensitivity. Histologic studies have shown that severe ME can affect the photoreceptor layer in the fovea, which then results in photoreceptor dysfunction and photoreceptor cell loss.30 This may explain why pre-treatment MV was a strong predictive factor for the visual outcome after anti-VEGF therapy. Kang et al25 evaluated the baseline SD-OCT characteristics of eyes with ME due to BRVO for the visual outcome after intravitreal bevacizumab injections. In their study, the strongest predictor of the final BCVA was the degree of EZ integrity, followed by the integrity of the ELM, and the baseline BCVA using stepwise multiple regression analysis. However, the pretreatment status of the EZ and ELM in the SD-OCT images was sometimes difficult to accurately evaluate because a thickened retina or cystoid ME often reduces the signal intensity of the outer retina. In fact, Kang et al25 found that the integrity of the EZ and ELM before treatment could not be evaluated in eight of 67 patients with ME due to BRVO. The authors suggested that despite the advances in OCT resolution, it may still not be effective in identifying the outer retinal architecture in some eyes with ME due to BRVO. Shin et al18 also reported that reduced backscattering from the EZ, ELM, and the other outer retinal layer including the outer nuclear layer, retinal pigment epithelium, and choroid was the result of a shadowing effect rather than a disruption of these structures.
Our multiple regression analyses showed that the MV had a higher coefficient of correlation and P-values with the BCVA and retinal sensitivity than the CRT. Because the CRT reflects the status of the ME of only the foveal area, the MV had a higher impact on the posttreatment BCVA and retinal sensitivity than the CRT. In eyes with BRVO before treatment, Yamaike et al31 reported that the retinal sensitivity measured with the MP-1 was significantly correlated with mean retinal thickness, which is considered to be a similar parameter as the MV, in the foveal sector and in the other eight extrafoveal sectors of the OCT retinal thickness map.
Shiono et al12 reported that the PROS length was a good predictor of the postoperative BCVA for eyes that underwent idiopathic epiretinal membrane surgery. In our study, the FB was better correlated than the PROS length in the association with the visual outcomes, but the reason why the FB had a higher correlation was not determined. However, one of the reasons may be that the PROS length could not be calculated because of undetectable EZ in the eleven eyes which did not have ME resolution. In addition, the PROS length was manually measured by the caliper function with the built-in software, and the measurements of PROS length may be susceptible to measurement errors because the length is relatively short compared to that of the other layers.32
The retinal sensitivity was significantly improved at 1, 3, and 6 months and at the final visit compared with the baseline. Mylonas et al13 evaluated the microperimetry changes in the retinal sensitivities in patients with acute ME secondary to BRVO during a follow-up period of 12 months with intravitreal ranibizumab treatment. The retinal sensitivity improved significantly under therapy from 9.47 dB at baseline to 12.53 dB at 12 months which is consistent with our results. The authors also reported that the size of the area of absolute scotoma was reduced from 16% at baseline to 11.7% at 3 months and remained stable for the entire study duration of 12 months. Mylonas et al13 reported that the CRT was significantly correlated with the mean retinal sensitivity at baseline. Our results showed that the CRT and MV before the treatment and presence of intact ELM, EZ, and FB at the time of the ME resolution were significantly correlated with the mean retinal sensitivity 6 months after the treatment and at the final visit.
This study has several limitations. First, the sample size was relatively small, and the follow-up period was relatively short. Further studies with a larger sample size and longer follow-up periods would be required to confirm our findings. The other limitation is that we included patients with BRVO and those with CRVO, and both patients treated with bevacizumab and those with ranibizumab. In addition, the present study did not evaluate the degree of ischemic changes. Although the ischemic grade might also have an impact on visual prognosis, it is often difficult to analyze because of extensive bleeding before treatment and the possibility of a late conversion of nonischemic vein occlusion to ischemic occlusion.19 The last limitation is the use of scattered laser photocoagulation in some patients. Peripheral laser might affect the results because the laser treatment can decrease the vitreous levels of VEGF.24
Conclusion
In conclusion, eyes with severe ME before the treatment or with outer retinal impairments at the time of ME resolution had worse visual outcome after anti-VEGF therapy for RVO. Among the OCT parameters, the pretreatment MV was a strong predictive factor for the visual outcome after anti-VEGF therapy.
Acknowledgments
The authors thank Professor Duco Hamasaki for his critical discussion and final manuscript revision. This work was supported in part by grant-in-aid 16K11288 (to YM) from the Ministry of Education, Science, Sports and Culture, Japan.
Disclosure
The authors report no conflicts of interest in this work.
References
No authors listed. Argon laser photocoagulation for macular edema in branch vein occlusion. The Branch Vein Occlusion Study Group. Am J Ophthalmol. 1984;98(3):271–282. | ||
Arnarsson A, Stefansson E. Laser treatment and the mechanism of edema reduction in branch retinal vein occlusion. Invest Ophthalmol Vis Sci. 2000;41(3):877–879. | ||
Mandelcorn MS, Nrusimhadevara RK. Internal limiting membrane peeling for decompression of macular edema in retinal vein occlusion: a report of 14 cases. Retina. 2004;24(3):348–355. | ||
Chen SD, Sundaram V, Lochhead J, Patel CK. Intravitreal triamcinolone for the treatment of ischemic macular edema associated with branch retinal vein occlusion. Am J Ophthalmol. 2006;141(5):876–883. | ||
Campochiaro PA, Heier JS, Feiner L, et al. Ranibizumab for macular edema following branch retinal vein occlusion: six-month primary end point results of a phase III study. Ophthalmology. 2010;117(6):1102–1112. | ||
Murakami T, Tsujikawa A, Miyamoto K, et al. Disrupted foveal photoreceptors after combined cystoid spaces and retinal detachment in branch vein occlusion treated with bevacizumab. Retina. 2012;32(9):1853–1861. | ||
Murakami T, Tsujikawa A, Ohta M, et al. Photoreceptor status after resolved macular edema in branch retinal vein occlusion treated with tissue plasminogen activator. Am J Ophthalmol. 2007;143(1):171–173. | ||
Ota M, Tsujikawa A, Murakami T, et al. Association between integrity of foveal photoreceptor layer and visual acuity in branch retinal vein occlusion. Br J Ophthalmol. 2007;91(12):1644–1649. | ||
Hasegawa T, Ueda T, Okamoto M, Ogata N. Presence of foveal bulge in optical coherence tomographic images in eyes with macular edema associated with branch retinal vein occlusion. Am J Ophthalmol. 2014;157(2):390–396. | ||
Chen CJ, Scholl HP, Birch DG, Iwata T, Miller NR, Goldberg MF. Characterizing the phenotype and genotype of a family with occult macular dystrophy. Arch Ophthalmol. 2012;130(12):1554–1559. | ||
Al-Haddad CE, El Mollayess GM, Mahfoud ZR, Jaafar DF, Bashshur ZF. Macular ultrastructural features in amblyopia using high-definition optical coherence tomography. Br J Ophthalmol. 2013;97(3):318–322. | ||
Shiono A, Kogo J, Klose G, et al. Photoreceptor outer segment length: a prognostic factor for idiopathic epiretinal membrane surgery. Ophthalmology. 2013;120(4):788–794. | ||
Mylonas G, Sacu S, Dunavoelgyi R, et al. Response of retinal sensitivity to ranibizumab treatment of macular edema after acute branch retinal vein occlusion. Retina. 2013;33(6):1220–1226. | ||
Nakamura Y, Mitamura Y, Ogata K, Arai M, Takatsuna Y, Yamamoto S. Functional and morphological changes of macula after subthreshold micropulse diode laser photocoagulation for diabetic macular oedema. Eye (Lond). 2010;24(5):784–788. | ||
Yamaike N, Tsujikawa A, Sakamoto A, et al. Retinal sensitivity after intravitreal injection of bevacizumab for the treatment of macular edema secondary to retinal vein occlusion. Retina. 2009;29(6):757–767. | ||
Ota M, Tsujikawa A, Murakami T, et al. Foveal photoreceptor layer in eyes with persistent cystoid macular edema associated with branch retinal vein occlusion. Am J Ophthalmol. 2008;145(2):273–280. | ||
Hoeh AE, Ruppenstein M, Ach T, Dithmar S. OCT patterns of macular edema and response to bevacizumab therapy in retinal vein occlusion. Graefes Arch Clin Exp Ophthalmol. 2010;248(11):1567–1572. | ||
Shin HJ, Chung H, Kim HC. Association between integrity of foveal photoreceptor layer and visual outcome in retinal vein occlusion. Acta Ophthalmol. 2011;89(1):e35–e40. | ||
Wolf-Schnurrbusch UE, Ghanem R, Rothenbuehler SP, et al. Predictors of short-term visual outcome after anti-VEGF therapy of macular edema due to central retinal vein occlusion. Invest Ophthalmol Vis Sci. 2011;52(6):3334–3337. | ||
Sakamoto A, Tsujikawa A, Ota M, et al. Evaluation of potential visual acuity in eyes with macular oedema secondary to retinal vein occlusion. Clin Experiment Ophthalmol. 2009;37(2):208–216. | ||
Suzuki T, Terasaki H, Niwa T, Mori M, Kondo M, Miyake Y. Optical coherence tomography and focal macular electroretinogram in eyes with epiretinal membrane and macular pseudohole. Am J Ophthalmol. 2003;136(1):62–67. | ||
Mitamura Y, Aizawa S, Baba T, Hagiwara A, Yamamoto S. Correlation between retinal sensitivity and photoreceptor inner/outer segment junction in patients with retinitis pigmentosa. Br J Ophthalmol. 2009;93(1):126–127. | ||
Ooka E, Mitamura Y, Baba T, Kitahashi M, Oshitari T, Yamamoto S. Foveal microstructure on spectral-domain optical coherence tomographic images and visual function after macular hole surgery. Am J Ophthalmol. 2011;152(2):283–290. | ||
Kondo M, Kondo N, Ito Y, et al. Intravitreal injection of bevacizumab for macular edema secondary to branch retinal vein occlusion: results after 12 months and multiple regression analysis. Retina. 2009;29(9):1242–1248. | ||
Kang HM, Chung EJ, Kim YM, Koh HJ. Spectral-domain optical coherence tomography (SD-OCT) patterns and response to intravitreal bevacizumab therapy in macular edema associated with branch retinal vein occlusion. Graefes Arch Clin Exp Ophthalmol. 2013;251(2):501–508. | ||
Ohashi H, Oh H, Nishiwaki H, Nonaka A, Takagi H. Delayed absorption of macular edema accompanying serous retinal detachment after grid laser treatment in patients with branch retinal vein occlusion. Ophthalmology. 2004;111(11):2050–2056. | ||
Ach T, Hoeh AE, Schaal KB, Scheuerle AF, Dithmar S. Predictive factors for changes in macular edema in intravitreal bevacizumab therapy of retinal vein occlusion. Graefes Arch Clin Exp Ophthalmol. 2010;248(2):155–159. | ||
Kriechbaum K, Prager F, Geitzenauer W, et al. Association of retinal sensitivity and morphology during antiangiogenic treatment of retinal vein occlusion over one year. Ophthalmology. 2009;116(12):2415–2421. | ||
Tsujikawa A, Sakamoto A, Ota M, et al. Serous retinal detachment associated with retinal vein occlusion. Am J Ophthalmol. 2010;149(2):291–301. | ||
Tso MO. Pathology of cystoid macular edema. Ophthalmology. 1982;89(8):902–915. | ||
Yamaike N, Kita M, Tsujikawa A, Miyamoto K, Yoshimura N. Perimetric sensitivity with the micro perimeter 1 and retinal thickness in patients with branch retinal vein occlusion. Am J Ophthalmol. 2007;143(2):342–344. | ||
Kinoshita T, Imaizumi H, Miyamoto H, Katome T, Semba K, Mitamura Y. Two-year results of metamorphopsia, visual acuity, and optical coherence tomographic parameters after epiretinal membrane surgery. Graefes Arch Clin Exp Ophthalmol. 2016;254(6):1041–1049. |
 © 2016 The Author(s). This work is published and licensed by Dove Medical Press Limited. The
full terms of this license are available at https://www.dovepress.com/terms
and incorporate the Creative Commons Attribution
- Non Commercial (unported, 3.0) License.
By accessing the work you hereby accept the Terms. Non-commercial uses of the work are permitted
without any further permission from Dove Medical Press Limited, provided the work is properly
attributed. For permission for commercial use of this work, please see paragraphs 4.2 and 5 of our Terms.
© 2016 The Author(s). This work is published and licensed by Dove Medical Press Limited. The
full terms of this license are available at https://www.dovepress.com/terms
and incorporate the Creative Commons Attribution
- Non Commercial (unported, 3.0) License.
By accessing the work you hereby accept the Terms. Non-commercial uses of the work are permitted
without any further permission from Dove Medical Press Limited, provided the work is properly
attributed. For permission for commercial use of this work, please see paragraphs 4.2 and 5 of our Terms.