Back to Journals » Clinical Ophthalmology » Volume 10
Optic nerve head topography and retinal structural changes in eyes with macrodisks: a comparative study with spectral domain optical coherence tomography
Authors Kayaarasi Ozturker Z, Eltutar K, Karini B, Erkul S, Osmanbasoglu O, Sultan P
Received 18 December 2015
Accepted for publication 9 June 2016
Published 12 September 2016 Volume 2016:10 Pages 1737—1742
DOI https://doi.org/10.2147/OPTH.S102789
Checked for plagiarism Yes
Review by Single anonymous peer review
Peer reviewer comments 2
Editor who approved publication: Dr Scott Fraser
Zeynep Kayaarasi Öztürker, Kadir Eltutar, Belma Karini, Sezin Özdogan Erkul, Özen Ayrancı Osmanbaşoğlu, Pınar Sultan
Ophthalmology Department, Istanbul Research and Training Hospital, Istanbul, Turkey
Purpose: To compare optic nerve head parameters, the thicknesses of the peripapillary retinal nerve fiber layer (pRNFL), the macular retinal nerve fiber layer (mRNFL), the ganglion cell complex (GCC), and the ganglion cell–inner plexiform layer (GCIPL) in macrodisks and normal-sized healthy disks using spectral domain optical coherence tomography.
Patients and methods: A total of 88 healthy eyes (42 macrodisks and 46 normal-sized disks) were prospectively enrolled in the study. Optic nerve head parameters as well as pRNFL, mRNFL, GCC, and GCIPL thicknesses were measured in all subjects. Optic disk areas (ODAs) >2.70 mm2 were defined as macrodisks. All spectral domain optical coherence tomography parameters were compared between normal-sized disks and macrodisks.
Results: The mean age of the participants was 49.4±5.7 years in the normal size group and 51.55±6.3 years in the macrodisk group (P=0.65). The average ODAs were 2.23±0.29 mm2 and 3.30±0.59 mm2 in the normal size and the macrodisk groups, respectively. ODA (P<0.001), cup area (P<0.001), cup disk area ratio (P<0.001), horizontal cup disk ratio (P<0.001), vertical cup disk ratio (P<0.001), horizontal disk diameter (P<0.001), vertical disk diameter (P<0.001), and cup volume (P<0.001) were significantly higher in the macrodisk group. The inferior mRNFL thickness was significantly lower (P=0.042), and the GCC inferior and GCIPL inferior thicknesses were found to be lower with low significance (P=0.052, P=0.059, respectively) in the macrodisk group. Rim volume (P=0.622), total pRNFL (P=0.201), superior pRNFL (P=0.123), inferior pRNFL (P=0.168), average macular thickness (P=0.162), total mRNFL (P=0.171), superior mRNFL (P=0.356), total GCC (P=0.080), superior GCC (P=0.261), total GCIPL (P=0.214), and superior GCIPL (P=0.515) thicknesses were similar in both groups.
Conclusion: Optic disk topography and retinal structures show different characteristics in healthy eyes with macrodisks. These disk size-dependent variations suggest that large optic disks may be more susceptible to glaucomatous damage.
Keywords: macrodisk, optic nerve head, nerve fiber layer, ganglion cell complex
Introduction
The capacity of optical coherence tomography (OCT) to differentiate glaucomatous and healthy eyes by measurements of the optic nerve head (ONH), the retinal nerve fiber layer (RNFL), and macular thickness has been shown in various studies.1–4 The advent of spectral domain optical coherence tomography (SD-OCT) allows visualization of the segments of the macular region with improved imaging resolution.5,6 The Topcon three-dimensional (3D) OCT 2000 is an SD-OCT device that procures a detailed assessment of the inner layers of the macula.7,8 This is called ganglion cell complex (GCC) analysis and consists of the scan of the macular RNFL (mRNFL) and the ganglion cell–inner plexiform layer (GCIPL). These layers contain the axons, cell bodies, and dendrites of the ganglion cells, respectively.9 Macrodisks exhibit more nerve fibers and a larger area of neuroretinal tissue than do regular disks.10 This appearance can sometimes lead to a misdiagnosis of glaucoma. Recognizing the progression of the loss of neuroretinal rim tissue is challenging in eyes with a slim neuroretinal rim. As the Heidelberg retina tomography and scanning laser polarimetry (GDx) databases do not include macrodisks in the diagnosis of glaucoma, their results will be influenced by the size of the optic disk leading to artificial high results. A visual field test is necessary to diagnose glaucoma in these patients.
A macrodisk is a large optic disk with an increased cupping, a normal rim volume, a normal visual field, and normal intraocular pressure.11,12 However, it remains necessary to understand whether these disks are vulnerable to nerve fiber loss. The aim of this study was to evaluate optic disk and macular characteristics of eyes with macrodisks.
Patients and methods
All subjects were examined between February and May 2014 at Istanbul Research and Training Hospital according to the principles of the Declaration of Helsinki. The study was approved by Istanbul Research and Training Hospital Ethics Committee and signed informed consent was obtained from each patient. Prospective evaluation of 88 eyes (42 with macrodisks and 46 with normal-sized disks) subjected to Topcon 3D SD-OCT was performed.
All participants underwent slit-lamp examination, dilated fundus examination with a 90 D fundus lens, applanation tonometry, measurement of the central corneal thickness with a corneal ultrasound pachymeter (Nidek UP-1000), axial length measurement (IOL Master), visual field testing, and the measurement of ONH, RNFL, and GCC with a Topcon 3D SD-OCT 2000 (Topcon Corporation, Tokyo, Japan). Visual field was tested using the 30-2 Swedish interactive threshold algorithm standard strategy of the Humphrey Field Analyzer (Carl Zeiss Meditec AG, Jena, Germany).
All subjects had a best corrected visual acuity of 20/60 or better, refraction error ≤±3.0 D sphere and ≤±1.5 D cylinder, intraocular pressure <21 mmHg, an open angle on gonioscopy, clear media, and vital optic disks. The exclusion criteria for both groups were a family history of glaucoma, having systemic diseases such as diabetes mellitus and hypertension, opaque media, macular disease, abnormal visual field testing, previous intraocular surgery, and a neurological disease.
All subjects had to have a reliable and normal Humphrey 30-2 Swedish interactive threshold algorithm standard test result.
Eyes were dilated with 0.5% tropicamide, and OCT images were obtained by the same technician. Images with signal strength >40 were used for analyses.
For each eye, total, superior, and inferior peripapillary retinal nerve fiber layer (pRNFL) thicknesses were evaluated by ONH and automatically calculated by OCT using existing software. The 3D OCT 2000 (software Version 8.00; Topcon Corporation) automatically detects the disk center by referring to the infrared reflectance image. Based on the inputted refractive information, the software adjusts the circle diameter for the circle scan and corrects papillary diameter, area, and volume, while also calculating magnification compensation, which enables accurate scanning. The machine automatically detects the edge of the optic disk as the end of the retinal pigment epithelium/choriocapillaris.
Among the measurements provided by ONH analysis, the following were examined: disk area, cup area, rim area, cup disk area ratio (CDAR), horizontal cup disk ratio (HCDR), vertical cup disk ratio (VCDR), vertical and horizontal disk diameters, cup volume, and rim volume.
OCT macular scans were segmented into the average macular thickness, mRNFL, GCC, and GCIPL. GCC thickness was measured from the internal limiting membrane to the outer inner plexiform layer boundary. The average macular thickness and superior and inferior hemi-retina thicknesses of mRNFL, GCC, and GCIPL were calculated.
The average optic disk area (ODA) of the normal population ranges from 2.10 mm2 to 2.45 mm2 when evaluated by OCT.2,13 Macrodisks can be defined as disks larger than the mean + 2SD on the basis of the Gaussian-like distribution curve of the ODA.14 According to this, we defined macrodisks as disks >2.70 mm2, and they were studied separately from the normal size group.
All OCT parameters were compared between normal disks and macrodisks. Nonparametric analysis between the two groups was evaluated with independent-samples T-tests and Mann–Whitney U-tests. Spearman’s test was used for nonparametric correlations between the ODA and other OCT variables. The Kolmogorov–Smirnov and Shapiro–Wilk nonparametric tests were used to evaluate the normal distribution of numerical data. A P-value <0.05 was considered statistically significant.
Results
The mean age of the patients in the control and macrodisk group were 49.44±5.71 years and 51.55±6.32 years, respectively. There were no significant differences in age (P=0.65), sex ratio (P=0.12), intraocular pressure (P=0.52), mean deviation in visual field testing (P=0.15), central corneal thickness (P=0.07), or axial length (P=0.65) between patients with normal and large disks (Table 1).
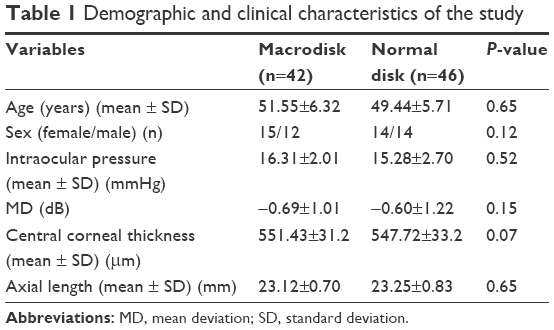 | Table 1 Demographic and clinical characteristics of the study |
The average ODAs were 2.23±0.29 mm2 (1.56–2.68 mm2) in the control group and 3.30±0.59 mm2 (2.73–4.92 mm2) in the macrodisk group (P<0.001). When the two groups were compared, cup area (P<0.001), CDAR (P<0.001), HCDR (P<0.001), VCDR (P<0.001), horizontal disk diameter (P<0.001), vertical disk diameter (P<0.001), and cup volume (P<0.001) were larger, and inferior mRNFL thickness was significantly smaller (P=0.042) in the macrodisk group. GCC inferior and GCIPL inferior were also thinner in the macrodisk group with low significance (P=0.052 and P=0.059, respectively). The rim area (P=0.109), rim volume (P=0.622), total RNFL thickness (P=0.201), superior RNFL thickness (P=0.123), inferior pRNFL thickness (P=0.168), average macular thickness (P=0.162), total mRNFL thickness (P=0.171), superior mRNFL thickness (P=0.356), total GCC thickness (P=0.080), superior GCC thickness (P=0.261), total GCIPL thickness (P=0.214), and superior GCIPL thickness (P=0.515) were similar in both groups (Table 2).
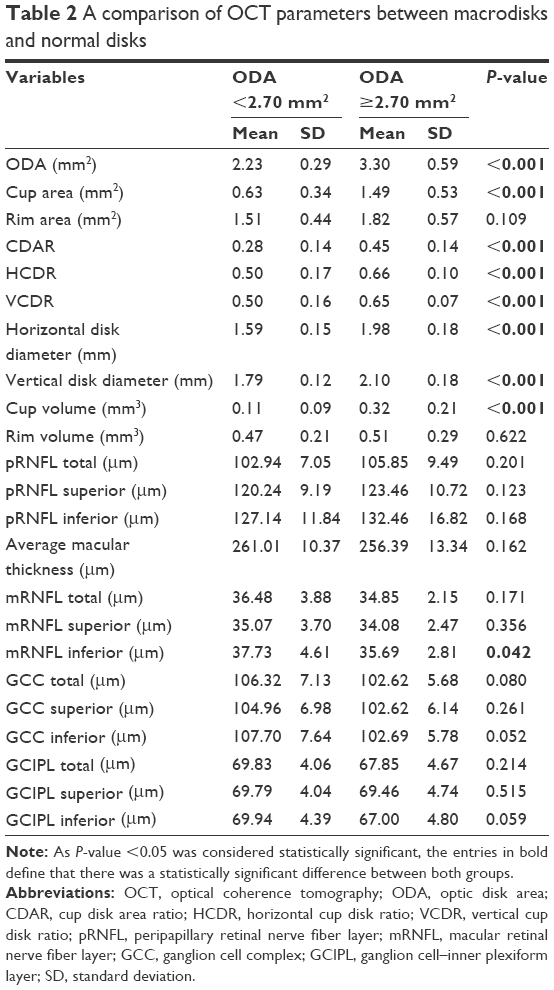 | Table 2 A comparison of OCT parameters between macrodisks and normal disks |
In multiple linear regression analyses, cup area (r=0.659, P<0.001), rim area (r=0.430, P<0.001), CDAR (r=0.436, P<0.001), HCDR (r=0.437, P<0.001), VCDR (r=0.439, P<0.001), cup volume (r=0.532, P<0.001), horizontal disk diameter (r=0.920, P<0.001), and vertical disk diameter (r=0.864, P<0.001) were significantly related to the ODA (Table 3).
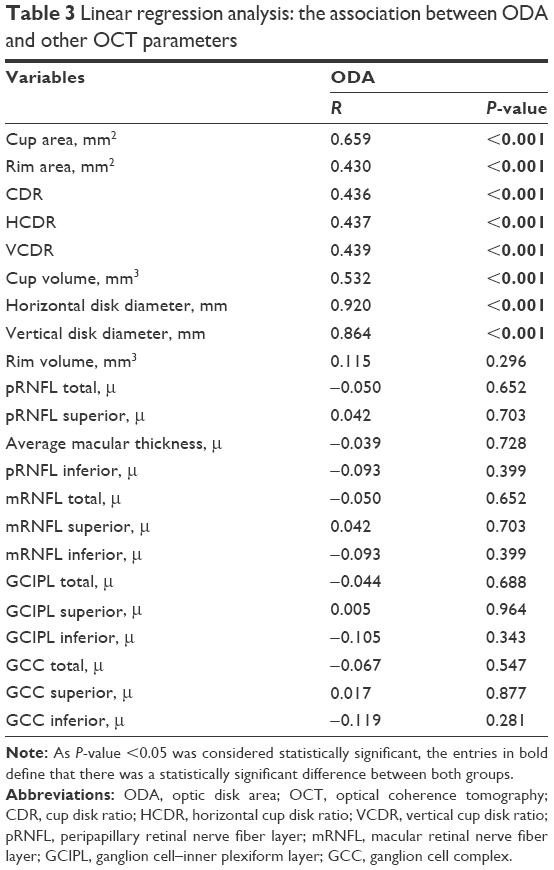 | Table 3 Linear regression analysis: the association between ODA and other OCT parameters |
Discussion
Our study demonstrated the relationships between disk size, the nerve fiber layer, and the GCC, and eyes with large disk areas have a significantly greater incidence of inferior nerve fiber layer loss. This finding suggests that large disks within the normal range of IOP may be susceptible to glaucomatous damage.
Burgoyne et al15 showed that the ONH is a biomechanical structure, and the mechanical failure of the connective tissue of the lamina cribrosa underlies glaucomatous cupping. The normal ONH is arranged with more and larger pores at the inferior and superior poles that have less connective tissue, indicating less structural support for the nerve fibers passing through the optic disk.16–18 Preferential nerve fiber loss observed in the superior and inferior pole region in glaucoma may be due to these structural properties of the optic nerve.
There is a high prevalence of glaucoma in African and African-Caribbean populations that have larger optic disks compared with the Caucasian population.19–24 This finding has led to the hypothesis that large optic disks may be more vulnerable to glaucomatous damage.25 Zangwill et al26 determined that large disks might be an important predictor of primary open-angle glaucoma in ocular hypertensive patients. There is also a relationship between disk size and CDR as a large CDR can be physiologic in a large disk. The Blue Mountains Eye Study showed that the CDR linearly increased for increasing disk diameters.27 Therefore, it is important to make a differential diagnosis of a healthy macrodisk from glaucoma.
Jonas et al28 reported that the vertical CDR measurement is more valuable compared with other optic disk parameters for distinguishing normal subjects from glaucoma patients.29 Some other studies have also showed that the rim area increases as disk size increases.30–33 Our study found that there were positive correlations between the optic disk size and VCDR and HCDR, and there was no significant correlation between disk size and rim area. This result might be due to use of a different diagnostic instrument and the different optic disk sizes evaluated in the study.
Furthermore, Quigley et al34 reported that the number of nerve fibers increased linearly with increasing disk sizes in monkey eyes. In contrast, Yucel et al35 found no correlation between the number of nerve fibers and the disk area in monkey eyes with laser-induced glaucoma. Mikelberg et al36 also found no correlation between the nerve fiber layer and disk size in humans. These different results may be explained by different methodologies used to estimate disk size, species, and the number of eyes examined.
With the introduction of OCT, several studies focused on the optic disks with different characteristics; however, there were still conflicting results, most of them showing positive correlation between optic disk size and nerve fiber layer thickness.37–39 Gabriele et al40 supported the idea that macrodisks with optic neuropathy may be missed by OCT assessment. They explained that if a fixed area scan protocol is used, the distance between the scan and the optic disk margin will be reduced in the presence of a large optic disk. This may lead to an overestimation of nerve fiber layer thickness in large optic disks, as the measurements are made closer to the optic disk edge.40 Therefore, if a fixed 3.4 mm diameter scan is applied, pRNFL thickness tends to be larger in eyes with larger optic disks.
Also, Huang et al41 reported that magnification correction factor is the link for the true analysis of the optic disk and nerve fiber layer. They suggested that different results in other studies are due to magnification variation related to axial length variation. Onmez et al42 found similar RNFL thicknesses between macrodisks and normal disks using Litmann formula for the correction of axial length-related ocular magnification. In our study, despite the inclusion of only the subjects with proper refraction error and axial length, software adjusted the circle diameter for the scan and corrected the papillary diameter, area, and volume while calculating magnification compensation, which enabled accurate scanning. We found no correlation between the average total, superior, or inferior pRNFL and ONH size, which is consistent with the previous literature.
Some studies indicated that GCC and peripapillary nerve fiber layer thicknesses show similar performance for the detection of early glaucoma.7,43–47 In general, pRNFL values are superior to mRNFL thickness in the diagnosis of glaucoma. However, in a group of glaucomatous eyes having larger disk diameters, macular thickness assessment was superior to pRNFL measurement.48,49 According to these studies, glaucomatous eyes with macrodisks may be missed by pRNFL assessment.
There is only one study published in the literature that obtained the diagnostic ability of macular parameters using 3D OCT.50 Measurements of the inner retinal layers in the macular region were used as additional parameters for glaucoma detection.7,43–46 Several studies have proposed that retinal ganglion cells with large axons are more vulnerable than ganglion cells with small axons in the macular area, and large axons were observed in the inferior retina in particular.51,52 This morphology may contribute to earlier nerve fiber layer loss in the inferior retina in glaucoma.
In our study, the inferior mRNFL thickness was significantly lower in the macrodisk group, whereas we found no correlation between the optic disk size and total macular thickness. The inferior GCIPL thickness was also thinner in the macrodisk group, but this result was not statistically significant.
Conclusion
The assessment of optic disk size is important in the diagnostic evaluation of glaucoma. In addition to ONH parameters and peripapillary nerve fiber layer thickness, mRNFL and inner retinal layer analyses should also be considered whether large disks may be more prone to pressure damage.15,53 To understand the relationship between ganglion cell loss and macrodisk morphology, longer follow-up with larger sample sizes is necessary.
Disclosure
The authors report no conflicts of interest in this work.
References
Anton A, Moreno-Montañes J, Blázquez F, Alvarez A, Martín B, Molina B. Usefulness of optical coherence tomography parameters of the optic disc and the retinal nerve fiber layer to differentiate glaucomatous, ocular hypertensive, and normal eyes. J Glaucoma. 2007;16(1):1–8. | ||
Medeiros FA, Zangwill LM, Bowd C, Vessani RM, Susanna R Jr, Weinreb RN. Evaluation of retinal nerve fiber layer, optic nerve head, and macular thickness measurements for glaucoma detection using optical coherence tomography. Am J Ophthalmol. 2005;139(1):44–55. | ||
Guedes V, Schuman JS, Hertzmark E, et al. Optical coherence tomography measurement of macular and nerve fiber layer thickness in normal and glaucomatous human eyes. Ophthalmology. 2003;110(1):177–189. | ||
Wollstein G, Ishikawa H, Wang J, Beaton SA, Schuman JS. Comparison of three optical coherence tomography scanning areas for detection of glaucomatous damage. Am J Ophthalmol. 2005;139(1):39–43. | ||
Wojtkowski M, Kowalczyk A, Leitgeb R, Fercher AF. Full range complex spectral optical coherence tomography technique in eye imaging. Opt Lett. 2002;27(16):1415–1417. | ||
de Boer JF, Cense B, Park BH, Pierce MC, Tearney GJ, Bouma BE. Improved signal-to-noise ratio in spectral-domain compared with time-domain optical coherence tomography. Opt Lett. 2003;28(21):2067–2069. | ||
Tan O, Chopra V, Lu AT, et al. Detection of macular ganglion cell loss in glaucoma by Fourier-domain optical coherence tomography. Ophthalmology. 2009;116(12):2305–2314.e1–e2. | ||
Seong M, Sung KR, Choi EH, et al. Diagnostic comparison between macular and peripapillary retinal nerve fiber layer measurements by spectral domain optical coherence tomography in normal-tension glaucoma. Invest Ophthalmol Vis Sci. 2010;51(3):1446–1452. | ||
Seong M, Sung KR, Choi EH, et al. Macular and peripapillary retinal nerve fiber layer measurements by spectral domain optical coherence tomography in normal-tension glaucoma. Invest Ophthalmol Vis Sci. 2010;51(3):1446–1452. | ||
Jonas JB, Schmidt AM, Muller-Bergh JA, Schlotzer-Schrehardt UM, Naumann GO. Human optic nerve ber count and optic disc size. Invest Ophthalmol Vis Sci. 1992;33(6):2012–2018. | ||
Swann PG, Coetzee J. Megalopapilla. Clin Exp Optom. 1999;82(5):200–202. | ||
Sampaolesi R, Sampaolesi JR. Large optic nerve heads: megalopapilla or megalodiscs. Int Ophthalmol. 2001;23(4–6):251–257. | ||
Schuman JS, Wollstein G, Farra T, et al. Comparison of optic nerve head measurements obtained by optical coherence tomography and confocal scanning laser ophthalmoscopy. Am J Ophthalmol. 2003;135(4):504–512. | ||
Shaarawy T, Sherwood MB, Hitchings RA, et al. In: Shaarawy T, Sherwood MB, Hitchings RA, and Crowston JG, editors. Diagnosis of glaucoma. Optic disc photography in the diagnosis of glaucoma. Glaucoma: Expert Consult Premium Edition Volume 1. Medical Diagnosis and Therapy. UK: Saunders Elsevier; 2009:213–214. | ||
Burgoyne CF, Downs JC, Bellezza AJ, Suh JK, Hart RT. The optic nerve head as a biomechanical structure: a new paradigm for understanding the role of IOP-related stress and strain in the pathophysiology of glaucomatous optic nerve head damage. Prog Retin Eye Res. 2005;24(1):39–73. | ||
Quigley HA, Addicks EM. Regional differences in the structure of the lamina cribrosa and their relation to glaucomatous optic nerve damage. Arch Ophthalmol. 1981;99(1):137–143. | ||
Dandona L, Quigley HA, Brown AE, Enger C. Quantitative regional structure of the normal human lamina cribrosa. A racial comparison. Arch Ophthalmol. 1990;108(3):393–398. | ||
Ogden TE, Duggan J, Danley K, Wilcox M, Minckler DS. Morphometry of nerve fiber bundle pores in the optic nerve head of the human. Exp Eye Res. 1988;46(4):559–568. | ||
Chi T, Ritch R, Stickler D, Pitman B, Tsai C, Hsieh FY. Racial differences in optic nerve head parameters. Arch Ophthalmol. 1989;107(6):836–839. | ||
Girkin CA, McGwin G Jr, Xie A, Deleon-Ortega J. Differences in optic disc topography between black and white normal subjects. Ophthalmology. 2005;112(1):33–39. | ||
Mansour AM. Racial variation of optic disc size. Ophthalmic Res. 1991;23(2):67–72. | ||
Mansour AM. Racial variation of optic disc parameters in children. Ophthalmic Surg. 1992;23(7):469–471. | ||
Quigley HA, Varma R, Tielsch JM, Katz J, Sommer A, Gilbert DL. The relationship between optic disc area and open-angle glaucoma: the Baltimore Eye Survey. J Glaucoma. 1999;8(6):347–352. | ||
Varma R, Tielsch JM, Quigley HA, et al. Race-, age-, gender-, and refractive error-related differences in the normal optic disc. Arch Ophthalmol. 1994;112(8):1068–1076. | ||
Burk RO, Rohrschneider K, Noack H, et al. Are large optic nerve heads susceptible to glaucomatous damage at normal intraocular pressure? A three-dimensional study by laser scanning tomography Graefes. Arch Clin Exp Ophthalmol. 1992;230(6):552–560. | ||
Zangwill LM, Weinreb RN, Beiser JA, et al. Baseline topographic optic disc measurements are associated with the development of primary open-angle glaucoma: the Confocal Scanning Laser Ophthalmoscopy Ancillary Study to the Ocular Hypertension Treatment Study. Arch Ophthalmol. 2005;123(9):1188–1197. | ||
Crowston JG, Hopley CR, Healey PR, Lee A, Mitchell P; Blue Mountains Eye Study. The effect of optic disc diameter on vertical cup to disc ratio percentiles in a population based cohort: the Blue Mountains Eye Study. Br J Ophthalmol. 2004;88(6):766–770. | ||
Jonas JB, Bergua A, Schmitz-Valckenberg P, Papastathopoulos KI, Budde WM. Ranking of optic disc variables for detection of glaucomatous optic nerve damage. Invest Ophthalmol Vis Sci. 2000;41(7):1764–1773. | ||
Jonas JB, Budde WM. Diagnosis and pathogenesis of glaucomatous optic neuropathy: morphological aspects. Prog Retin Eye Res. 2000;19(1):1–40. | ||
Jonas JB, Gusek GC, Naumann GO. Optic disc, cup and neuroretinal rim size, configuration and correlations in normal eyes. Invest Ophthalmol Vis Sci. 1988;29(7):1151–1158. | ||
Cankaya AB, Simsek T. Topographic differences between large and normal optic discs: a confocal scanning laser ophthalmoscopy study. Eur J Ophthalmol. 2012;22(1):63–69. | ||
Caprioli J, Miller JM. Optic disc rim area is related to the disc size in normal subjects. Arch Ophthalmol. 1987;105(12):1683–1685. | ||
Savini GZ, Zanini M, Carelli V, et al. Correlation between retinal nerve fiber layer thickness and optic nerve head size: an optical coherence tomography study. Br J Ophthalmol. 2005;89:489–492. | ||
Quigley HA, Coleman AL, Dorman-Pease ME. Larger optic nerve heads have more nerve fibers in normal monkey eyes. Arch Ophthalmol. 1991;109(10):1441–1443. | ||
Yucel YH, Gupta N, Kalichman MW, et al. Relationship of optic disc topography to optic nerve fiber number in glaucoma. Arch Ophthalmol. 1998;116(4):493–497. | ||
Mikelberg FS, Yidegiligne HM, White VA, Schulzer M. Relation between optic nerve axon number and axon diameter to scleral canal area. Ophthalmology. 1991;98(1):60–63. | ||
Bowd C, Zangwill LM, Blumenthal EZ, et al. Imaging of the optic disc and retinal nerve fiber layer: the effects of age, optic disc area, refractive error, and gender. J Opt Soc Am A Opt Image Sci Vis. 2002;19(1):197–207. | ||
Savini G, Zanini M, Carelli V, Sadun AA, Ross-Cisneros FN, Barboni P. Correlation between retinal nerve fibre layer thickness and optic nerve head size: an optical coherence tomography study. Br J Ophthalmol. 2005;89(4):489–492. | ||
Budenz DL, Anderson DR, Varma R, et al. Determinants of normal retinal nerve fiber layer thickness measured by Stratus OCT. Ophthalmology. 2007;114(6):1046–1052. | ||
Gabriele ML, Ishikawa H, Wollstein G, et al. Optical coherence tomography scan circle location and mean retinal nerve fiber layer measurement variability. Invest Ophthalmol Vis Sci. 2008;49(6):2315–2321. | ||
Huang D, Chopra V, Lu AT, et al; Advanced Imaging for Glaucoma Study-AIGS Group. Does optic nerve head size variation affect circumpapillary retinal nerve fiber layer thickness measurement by optical coherence tomography? Invest Ophthalmol Vis Sci. 2012;53(8):4990–4997. | ||
Onmez FE, Satana B, Altan C, Basarir B, Demirok A. A comparison of optic nerve head topographic measurements by Stratus OCT in patients with macrodiscs and normal-sized healthy discs. J Glaucoma. 2014;23(8):e152–e156. | ||
Schulze A, Lamparter J, Pfeiffer N, Berisha F, Schmidtmann I, Hoffmann EM. Diagnostic ability of retinal ganglion cell complex, retinal nerve fiber layer, and optic nerve head measurements by Fourier-domain optical coherence tomography. Graefes Arch Clin Exp Ophthalmol. 2011;249(7):1039–1045. | ||
Garas A, Vargha P, Hollo G. Diagnostic accuracy of nerve fibre layer, macular thickness and optic disc measurements made with the RTVue-100 optical coherence tomograph to detect glaucoma. Eye (Lond). 2011;25(1):57–65. | ||
Moreno PA, Konno B, Lima VC, et al. Spectral-domain optical coherence tomography for early glaucoma assessment: analysis of macular ganglion cell complex versus peripapillary retinal nerve fiber layer. Can J Ophthalmol. 2011;46(6):543–547. | ||
Mwanza JC, Durbin MK, Budenz DL, et al. Glaucoma diagnostic accuracy of ganglion cell-inner plexiform layer thickness: comparison with nerve fiber layer and optic nerve head. Ophthalmology. 2012;119(6):1151–1158. | ||
Rao HL, Babu JG, Addepalli UK, Senthil S, Garudadri CS. Retinal nerve fiber layer and macular inner retina measurements by spectral domain optical coherence tomograph in Indian eyes with early glaucoma. Eye (Lond). 2012;26(1):133–139. | ||
Na JH, Sung KR, Baek S, Sun JH, Lee Y. Macular and retinal nerve fiber layer thickness: which is more helpful in the diagnosis of glaucoma? Invest Ophthalmol Vis Sci. 2011;52(11):8094–8101. | ||
Cordeiro DV, Lima VC, Castro DP, et al. Influence of optic disc size on the diagnostic performance of macular ganglion cell complex and peripapillary retinal nerve fiber layer analyses in glaucoma. Clin Ophthalmol. 2011;5:1333–1337. | ||
Kotera Y, Hangai M, Hirose F, Mori S, Yoshimura N. Three dimensional imaging of macular inner structures in glaucoma by using spectral-domain optical coherence tomography. Invest Ophthalmol Vis Sci. 2011;52(3):1412–1421. | ||
Quigley HA, Sanchez RM, Dunkelberger GR, L’Hernault NL, Baginski TA. Chronic glaucoma selectively damages large optic nerve fibers. Invest Ophthalmol Vis Sci. 1987;28(6):913–920. | ||
Quigley HA, Dunkelberger GR, Green WR. Chronic human glaucoma causing selectively greater loss of large optic nerve fibers. Ophthalmology. 1988;95(3):357–363. | ||
Bellezza AJ, Rintalan CJ, Thompson HW, Downs JC, Hart RT, Burgoyne CF. Deformation of the lamina cribrosa and anterior scleral canal wall in early experimental glaucoma. Invest Ophthalmol Vis Sci. 2003;44(2):623–637. |
 © 2016 The Author(s). This work is published and licensed by Dove Medical Press Limited. The
full terms of this license are available at https://www.dovepress.com/terms
and incorporate the Creative Commons Attribution
- Non Commercial (unported, 3.0) License.
By accessing the work you hereby accept the Terms. Non-commercial uses of the work are permitted
without any further permission from Dove Medical Press Limited, provided the work is properly
attributed. For permission for commercial use of this work, please see paragraphs 4.2 and 5 of our Terms.
© 2016 The Author(s). This work is published and licensed by Dove Medical Press Limited. The
full terms of this license are available at https://www.dovepress.com/terms
and incorporate the Creative Commons Attribution
- Non Commercial (unported, 3.0) License.
By accessing the work you hereby accept the Terms. Non-commercial uses of the work are permitted
without any further permission from Dove Medical Press Limited, provided the work is properly
attributed. For permission for commercial use of this work, please see paragraphs 4.2 and 5 of our Terms.