Back to Journals » Clinical Ophthalmology » Volume 12
Optic disc vessel density in nonglaucomatous and glaucomatous eyes: an enhanced-depth imaging optical coherence tomography angiography study
Authors Yoshikawa Y, Shoji T ![]() , Kanno J, Kimura I
, Kanno J, Kimura I ![]() , Hangai M, Shinoda K
, Hangai M, Shinoda K ![]()
Received 4 March 2018
Accepted for publication 24 April 2018
Published 19 June 2018 Volume 2018:12 Pages 1113—1119
DOI https://doi.org/10.2147/OPTH.S167222
Checked for plagiarism Yes
Review by Single anonymous peer review
Peer reviewer comments 2
Editor who approved publication: Dr Scott Fraser
Yuji Yoshikawa,1 Takuhei Shoji,1 Junji Kanno,1 Itaru Kimura,1 Masanori Hangai,2 Kei Shinoda1
1Department of Ophthalmology, Saitama Medical University, Saitama, Japan; 2Hangai Eye Institute, Saitama, Japan
Purpose: To evaluate the ability of enhanced-depth imaging (EDI) optical coherence tomography angiography (OCTA) to detect vascular signals inside the glaucomatous optic disc.
Patients and methods: Ten glaucomatous eyes of 8 subjects and 11 nonglaucomatous eyes of 7 subjects underwent EDI and conventional OCTA for optic disc analysis. The optic disc vessel density (VD) at maximum scan depth (2 mm) was compared between the 2 methods and between glaucomatous and nonglaucomatous eyes. Regression analysis was used to determine the factors affecting disc VD.
Results: The median (25th, 75th percentile) of the visual field mean deviation was –20.5 (–25.1, –13.5) dB in glaucoma. The disc VD measured with the EDI method was significantly greater than that measured with the conventional method in glaucoma and nonglaucoma. The disc VD was also significantly lower in glaucoma than in nonglaucoma. The disc VD and mean deviation were significantly and positively correlated in both methods (conventional: R2=0.27, EDI: R2=0.22).
Conclusion: The correlation between disc VD and glaucoma severity was comparable between conventional and EDI measurements. Images obtained with EDI-OCTA have the additional benefit of revealing more vascular signals in deeper layers. The disc VD, as determined by both conventional and EDI-OCTA methods, may be an indicator of glaucoma severity.
Keywords: optical coherence tomography angiography, enhanced-depth imaging, vessel density, glaucoma severity, mean deviation
Introduction
Glaucoma is a progressive disease that can cause irreversible vision loss and is the leading cause of blindness around the world.1 Intraocular pressure (IOP) elevation is the only glaucoma-related abnormality for which treatment prevents disease progression,2 but fundus fluorescein angiography studies suggest that glaucoma is associated with changes in the retinal vasculature and ocular circulation.3 However, some patients are allergic to fluorescein dye, with some potentially having a severe adverse reaction, including anaphylactic shock.
Optical coherence tomography angiography (OCTA) was recently developed as a method to study the retinal and peripapillary microvasculature without the need for dye injection.4 A recent OCTA study revealed changes in optic nerve head (ONH) vessel density (VD)5 while another study found a decrease in peripapillary VD in eyes with glaucoma.6 The decrease in peripapillary VD was detected prior to visual field (VF) defects in eyes with preperimetric glaucoma.7 The applicability of VD change analysis for glaucoma is somewhat controversial, but a prior study suggests that evaluating ONH and peripapillary vasculature changes may be useful for monitoring glaucoma progression.5 Rao et al8,9 reported that the diagnostic ability of peripapillary VD was comparable to that of retinal nerve fiber layer thickness in eyes with primary open-angle glaucoma and primary angle-closure glaucoma. However, the diagnostic ability of macular and ONH VD measurements was reported to be significantly lower than peripapillary VD measurements.
The lamina cribrosa is made up of porous connective tissue and retinal ganglion cell axon bundles traveling through it to reach the orbital portion of the optic nerve. The lamina cribrosa plays a critical role in the pathogenesis of glaucoma.10 Faridi et al11 reported an association between the presence of a focal lamina cribrosa defect and glaucoma progression. Additionally, Suh et al12 reported a significant relationship between the presence of a focal laminar defect and a circumpapillary VD reduction. Another report showed that OCTA successfully detected pre-laminar VD reductions in glaucomatous eyes and that VD was significantly correlated with glaucoma severity.13
Spaide et al14 applied the enhanced-depth imaging (EDI) method to spectral-domain OCT (SD-OCT) to image deeper structures, including choroidal capillaries and vessels. These EDI-OCT images helped to elucidate choroidal disease etiology in several conditions, including central serous chorioretinopathy and Vogt–Koyanagi–Harada disease.14 The EDI method has also been used to image the lamina cribrosa and posterior lamina edge.15
The EDI technique is often used to enhance SD-OCT images, but has not yet been applied to OCTA. We hypothesized that using EDI with OCTA would be useful for detecting deep ONH vascular signals, particularly in laminar tissue. The purpose of the current study was to evaluate the ability of EDI-OCTA to detect deep vascular signals at the level of the lamina area in glaucomatous eyes.
Patient and methods
This cross-sectional, comparative, prospective study was reviewed and approved by the Ethics Committee of Saitama Medical University (Iruma, Japan). All subjects provided written informed consent to participate in the study, and all study conduct adhered to the tenets of the Declaration of Helsinki.
Study population
Patients with glaucoma that were at least 20 years old were considered for study enrollment. All screening examinations were conducted between April 2015 and March 2016 and included the following examinations: comprehensive ophthalmic examination (including slit-lamp biomicroscopy), IOP measurement (non-contact tonometry; Tonoref II, Nidek Co., Ltd., Aichi, Japan), gonioscopy, dilated fundus examination, fundus photography (CX-1, Canon Inc., Tokyo, Japan), axial length measurement (Optical Biometer OA-2000, Tomey Corp., Nagoya, Japan), automated VF assessment (24-2 Swedish Interactive Thresholding Algorithm [Carl Zeiss Meditec, Jena, Germany]), retinal nerve fiber layer thickness measurement (Spectralis HRA 2, Heidelberg Engineering, Heidelberg, Germany), and SD-OCTA (RS3000 Advance, Nidek Co., Ltd.).
Subjects were included in the glaucoma group if all of the following were present: glaucomatous optic neuropathy (based on fundus photography findings), glaucomatous VF damage (defined as a glaucoma hemifield test result outside normal limits and a pattern SD outside 95% of normal limits16), a nerve fiber layer defect consistent with the VF defect, and a VF mean deviation (MD) < −6 dB.
A group of subjects without glaucoma were included for comparison. Subjects were eligible for inclusion in the nonglaucoma (control) group if IOP was normal (< 20 mmHg) and glaucomatous optical neuropathy, nerve fiber layer defects, and glaucomatous VF defects were absent.
Subjects in both groups had the same exclusion criteria. Subjects were not included in the study if any of the following were true: age < 20 years, refractive error > +3 or < −6.0 diopters, axial length > 26 mm, evidence of other ocular disease (including diabetic retinopathy, retinal vein/artery occlusion, age-related macular degeneration, retinal detachment, tilted disc, and exfoliation syndrome), or poor image quality due to poor fixation or a cataract.
OCTA
All OCTA images were collected using an SD-OCT system (RS3000 Advance, Nidek Co., Ltd.). Images included a 3×3 mm2 measurement area centered on the optic disc and were obtained using a central wavelength of 880 nm and an A-scan rate of 53,000 scans/s. Axial and transverse image resolution in the imaged tissue was 7 and 20 μm, respectively. The OCTA software was used to acquire a 3×3×2 mm3 image cube, with each cube consisting of 256 B-scans. Angiography signals were processed using both phase/Doppler shift and amplitude variation, also known as complex OCT signal difference analysis angiography (aka, CODAA). All OCTA scans were obtained with the conventional method and EDI method.
Optic disc vessel signal evaluation
The optic disc measurement area included tissue inside of the disc margin. The optic disc boundary was defined by manually identifying Bruch’s membrane opening on OCTA B-scan images and plotting the Bruch’s membrane openings on the OCTA en face image. Measurement depth was the whole scan depth (2 mm) and not segmented. Angiography signals were analyzed using ImageJ software (National Institutes of Health, Bethesda, MD, USA), which is capable of a Sauvola analysis to perform local adaptive thresholding binarization on OCTA images. This transformed vessel signals into yellow regions (Figure 1), which were then digitized and measured.17 The disc VD was calculated as the percentage of vessel signal obtained over the entire measurement area inside the optic disc.
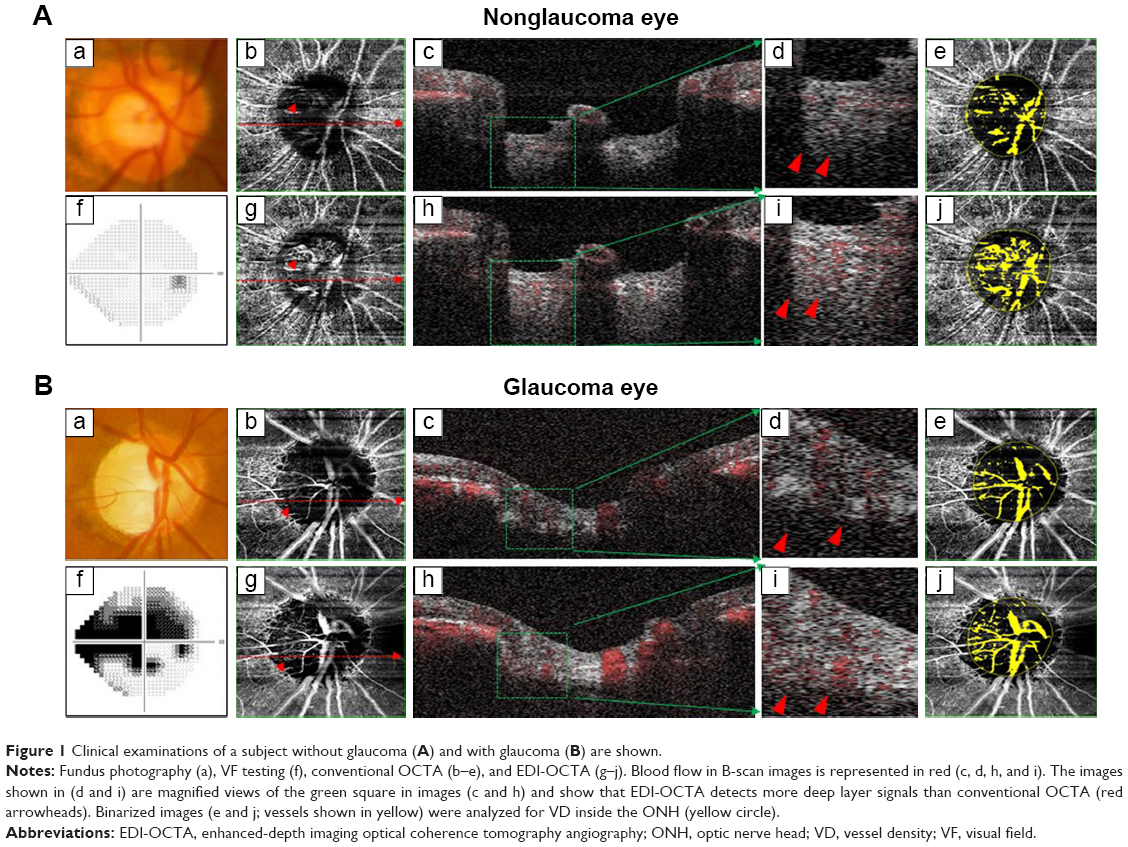 | Figure 1 Clinical examinations of a subject without glaucoma (A) and with glaucoma (B) are shown. |
Statistical analyses
Data for continuous variables are expressed as median (25th, 75th percentile). Differences between subjects with and without glaucoma in characteristics and clinical features were tested for statistical significance using Fisher’s exact and Mann–Whitney U-tests. Wilcoxon signed-rank tests and Mann–Whitney U-tests were used to compare disc VD differences obtained with the conventional method and EDI method in subjects with and without glaucoma. Regression was used to estimate the relationships between the disc VD with both methods and the MD value. All statistical analyses were performed using JMP statistical software (version 10.1, SAS Institute Inc., Cary, NC, USA), and statistical significance was defined as p<0.05.
Results
All included glaucoma and control subjects were Japanese. Fourteen eyes from 7 subjects with glaucoma and 16 eyes from 8 subjects without glaucoma were included. Of these, 10 eyes with glaucoma and 11 eyes without glaucoma were eligible for analysis in this study. In the glaucoma group, 2 eyes were excluded due to early-stage glaucoma and the other 2 eyes were excluded due to the presence of an epiretinal membrane. Five eyes from the subjects without glaucoma were excluded due to borderline VF abnormalities, which were not consistent with nerve fiber layer defect. Table 1 summarizes the subject and clinical characteristics of the 2 groups. There were no significant differences between the groups in age, sex, axial length, or IOP. However, the VF MD was significantly different in the glaucoma (−20.5 dB [−25.1, −13.5]) and control (−0.54 dB [−2.20, 0.00]) groups (p<0.01, Table 1).
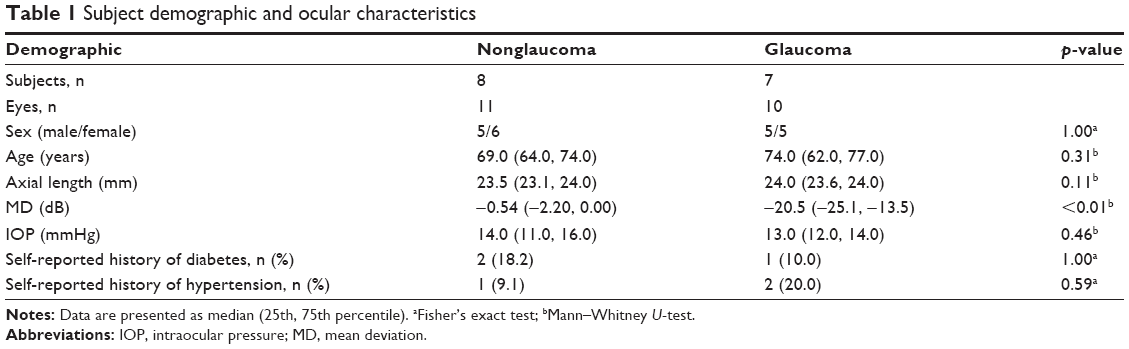 | Table 1 Subject demographic and ocular characteristics |
The disc VD measured via the 2 imaging methods was compared. The disc VD obtained using EDI was significantly higher than conventional measurements in both glaucomatous and nonglaucomatous eyes (p<0.01, Figure 2). Additionally, disc VD was significantly lower in eyes with glaucoma than in eyes without glaucoma, regardless of which imaging method was used (conventional: p=0.03, EDI: p=0.01; Figure 2). Figure 3 shows the significant positive linear correlation between MD and disc VD, which was significant for and comparable between both imaging methods (conventional: R2=0.27, p=0.02; EDI: R2=0.22, p=0.02).
 | Figure 2 VD measurements obtained with conventional imaging (dark gray) and EDI-OCTA (light gray). |
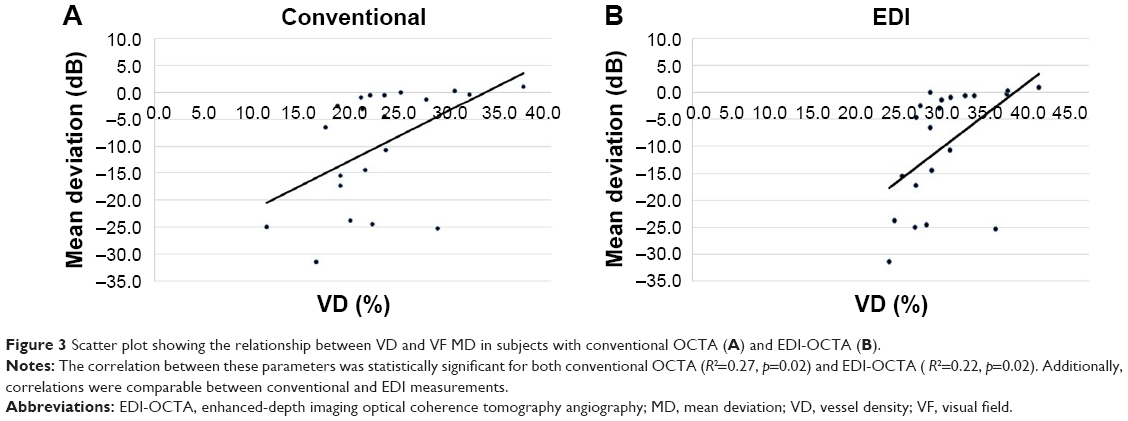 | Figure 3 Scatter plot showing the relationship between VD and VF MD in subjects with conventional OCTA (A) and EDI-OCTA (B). |
Discussion
This study demonstrated that disc VD measurements obtained using EDI-OCTA were higher than those obtained using the conventional method. This finding implies that EDI-OCTA can detect more vessel signals in the deep ONH layer than the conventional method. The disc VD was significantly correlated with glaucoma severity when disc VD was measured with both the conventional method and EDI-OCTA. Additionally, the correlation equation was comparable between imaging methods.
Several recent reports examined the relationship between glaucoma and disc VD reduction in the circumpapillary area and inside the ONH.5,7,13,18 Previous reports13,18 used conventional OCTA to show that pre-laminar and ONH tissue VDs were significantly lower in patients with glaucoma than in patients without glaucoma. The current study also found that disc VD was significantly lower in patients with glaucoma than in patients without glaucoma when disc VD was measured with both conventional imaging and EDI (Figure 2). Additionally, the correlation equations between disc VD reduction and glaucoma severity (Table 2; Figure 3) were similar when disc VD reduction was measured with either imaging method. Therefore, disc VD measurements may be useful for monitoring disease progression in eyes with moderate-to-advanced glaucoma, particularly when disc VD is measured using EDI, which can detect more vascular signals in the deep ONH layer. This study only included glaucoma patients that had an MD of −6.0 dB or worse, and further studies are needed to examine the usefulness of disc VD measurements in eyes with early-stage glaucoma.
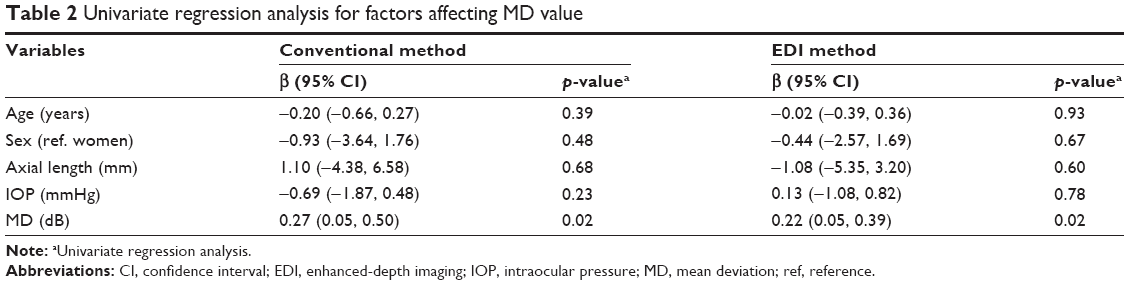 | Table 2 Univariate regression analysis for factors affecting MD value |
Fluorescein fundus angiography and laser Doppler flowmetry measurements indicate that optic disc blood flow is lower in eyes with glaucoma than in healthy eyes.19,20 Pre-laminar VD measurements made with OCTA also show that VD is lower in eyes with glaucoma than in eyes without glaucoma.13,21 These findings and those of the current study suggest a correlation between glaucoma progression and vascular changes. However, this remains controversial because some investigators have argued that the correlation is based on the “vascular theory.” This theory considers glaucomatous optic neuropathy to be a consequence of an inadequate blood supply,22 perhaps from secondary capillary loss that may result from retinal nerve fiber layer damage.6
The ONH microvasculature, particularly in the lamina cribrosa, is thought to play an important role in the pathogenesis of glaucoma. However, few studies have investigated deep layer vasculature changes in the laminar area of glaucomatous eyes.23 Although EDI is widely used for measuring lamina cribrosa thickness,15 there are no reports of the use of EDI with OCTA in the literature. The present study shows that EDI-OCTA detected more ONH vessel signals than conventional OCTA. Even though glaucoma severity–disc VD reduction correlation equations were similar between the 2 imaging methods, EDI-OCTA detected lamina cribrosa vessel signals to a deeper level than conventional OCTA in eyes with and without glaucoma (Figures 1 and 2). This is important because studying the deep layer lamina area vasculature may improve our understanding of glaucoma pathogenesis.
Our study had several limitations. First, this study was designed as a preliminary study. Therefore, our sample size was relatively small, and data were included from both eyes. Additionally, subjects were not categorized by glaucoma severity. Further studies that include a larger number of subjects are needed to better understand the association between glaucoma stage and disc VD. Second, we did not evaluate the reliability and reproducibility of OCTA in this study. However, in a study involving macular analysis, Al-Sheikh et al24 reported good reproducibility of OCTA examinations with RS3000 Advance. This suggests that our OCTA examinations also might have good reproducibility. Third, prior studies have shown that EDI is superior to standard imaging methods for measuring lamina thickness.15 However, OCTA signals of whole laminar tissue could not be obtained, even when using EDI, and it is difficult to distinguish between deeper vessel signals and shadow artifacts. Fourth, VD measurement variability between imaging system software created some challenges. Image analyses were performed using a selected binarization algorithm to define signal thresholds. It was difficult to know which of the numerous available algorithms were best for determining VD. Therefore, future studies should evaluate binarization feasibility, reproducibility, and standardization. Fifth, unstable fixation for advanced-stage glaucoma patient may hamper OCTA image detection as it hampers VF testing. Further OCTA research to investigate glaucoma patients who cannot maintain fixation during VF testing would be helpful. Finally, superficial signals affected deeper layer VD measurements by creating projection artifacts. Therefore, VD measurements of the large, superficial lamina cribrosa vessels may not have been accurate because imaging signals were sometimes obscured by large superficial vessels overlying deeper tissue (creating image shadows). This issue is common when measuring VD using OCTA, and it is especially difficult to distinguish between true deeper vessel signals and these artifacts in EDI-OCTA. So, further studies are needed to isolate laminar capillary signals by excluding superficial vessel signals (eg, projection artifact removal software25).
Conclusion
The correlation between the disc VD and glaucoma severity was significant and had a similar coefficient value when disc VD was measured with EDI-OCTA and conventional OCTA. EDI-OCTA detected deeper optic disc vessel signals than did the conventional method. The disc VD, as determined by both conventional and EDI-OCTA methods, may be an indicator of glaucoma severity. Further research is needed to determine if a decrease in deep laminar VD is a risk factor for glaucoma development and progression.
Acknowledgments
We thank Mr Ibuki for help with the study preparation and clinical input. We thank Editage (https://www.editage.jp) for the English language review. This study was supported in part by the Takeda Science Foundation (Tokyo, Japan), Grant-in-Aid for Young Researchers from Saitama Medical University Hospital, and the Japan Society for the Promotion of Science (JSPS; KAKENHI grant numbers: 15K21335, 16KK0208, and 17K11430).
Author contributions
All authors contributed toward data analysis, drafting, and critically revising the paper and agree to be accountable for all aspects of the work.
Disclosure
The authors report no conflicts of interest in this work.
References
Quigley HA, Broman AT. The number of people with glaucoma worldwide in 2010 and 2020. Br J Ophthalmol. 2006;90(3):262–267. | ||
Caprioli J, Coleman AL. Intraocular pressure fluctuation a risk factor for visual field progression at low intraocular pressures in the advanced glaucoma intervention study. Ophthalmology. 2008;115(7):1123.e3–1129.e3. | ||
Adam G, Schwartz B. Increased fluorescein filling defects in the wall of the optic disc cup in glaucoma. Arch Ophthalmol. 1980;98(9):1590–1592. | ||
Spaide RF, Klancnik JM Jr, Cooney MJ. Retinal vascular layers imaged by fluorescein angiography and optical coherence tomography angiography. JAMA Ophthalmol. 2015;133(1):45–50. | ||
Wang X, Jiang C, Ko T, et al. Correlation between optic disc perfusion and glaucomatous severity in patients with open-angle glaucoma: an optical coherence tomography angiography study. Graefes Arch Clin Exp Ophthalmol. 2015;253(9):1557–1564. | ||
Akagi T, Iida Y, Nakanishi H, et al. Microvascular density in glaucomatous eyes with hemifield visual field defects: an optical coherence tomography angiography study. Am J Ophthalmol. 2016;168:237–249. | ||
Akil H, Huang AS, Francis BA, Sadda SR, Chopra V. Retinal vessel density from optical coherence tomography angiography to differentiate early glaucoma, pre-perimetric glaucoma and normal eyes. PLoS One. 2017;12(2):e0170476. | ||
Rao HL, Pradhan ZS, Weinreb RN, et al. A comparison of the diagnostic ability of vessel density and structural measurements of optical coherence tomography in primary open angle glaucoma. PLoS One. 2017;12(3):e0173930. | ||
Rao HL, Pradhan ZS, Weinreb RN, et al. Determinants of peripapillary and macular vessel densities measured by optical coherence tomography angiography in normal eyes. J Glaucoma. 2017;26(5):491–497. | ||
Wilczek M. The lamina cribrosa and its nature. Br J Ophthalmol. 1947;31(9):551–565. | ||
Faridi OS, Park SC, Kabadi R, et al. Effect of focal lamina cribrosa defect on glaucomatous visual field progression. Ophthalmology. 2014;121(8):1524–1530. | ||
Suh MH, Zangwill LM, Manalastas PI, et al. Optical coherence tomography angiography vessel density in glaucomatous eyes with focal lamina cribrosa defects. Ophthalmology. 2016;123(11):2309–2317. | ||
Chen CL, Bojikian KD, Gupta D, et al. Optic nerve head perfusion in normal eyes and eyes with glaucoma using optical coherence tomography-based microangiography. Quant Imaging Med Surg. 2016;6(2):125–133. | ||
Spaide RF, Koizumi H, Pozzoni MC. Enhanced depth imaging spectral-domain optical coherence tomography. Am J Ophthalmol. 2008;146(4):496–500. | ||
Lee EJ, Kim TW, Weinreb RN, Park KH, Kim SH, Kim DM. Visualization of the lamina cribrosa using enhanced depth imaging spectral-domain optical coherence tomography. Am J Ophthalmol. 2011;152(1):87.e1–95.e1. | ||
Katz J, Quigley HA, Sommer A. Repeatability of the glaucoma hemifield test in automated perimetry. Invest Ophthalmol Vis Sci. 1995;36(8):1658–1664. | ||
Sauvola J, Pietikäinen M. Adaptive Document Image Binarization. Amsterdam, Netherlands: Elsevier Science Ltd.; 1999. | ||
Chen HS, Liu CH, Wu WC, Tseng HJ, Lee YS. Optical coherence tomography angiography of the superficial microvasculature in the macular and peripapillary areas in glaucomatous and healthy eyes. Invest Ophthalmol Vis Sci. 2017;58(9):3637–3645. | ||
Talusan E, Schwartz B. Specificity of fluorescein angiographic defects of the optic disc in glaucoma. Arch Ophthalmol. 1977;95(12):2166–2175. | ||
Piltz-seymour JR, Grunwald JE, Hariprasad SM, Dupont J. Optic nerve blood flow is diminished in eyes of primary open-angle glaucoma suspects. Am J Ophthalmol. 2001;132(1):63–69. | ||
Chen CL, Bojikian KD, Xin C, et al. Repeatability and reproducibility of optic nerve head perfusion measurements using optical coherence tomography angiography. J Biomed Opt. 2016;21(6):65002. | ||
Flammer J, Orgül S, Costa VP, et al. The impact of ocular blood flow in glaucoma. Prog Retin Eye Res. 2002;21(4):359–393. | ||
Lévêque PM, Zéboulon P, Brasnu E, Baudouin C, Labbé A. Optic disc vascularization in glaucoma: value of spectral-domain optical coherence tomography angiography. J Ophthalmol. 2016;2016:6956717. | ||
Al-Sheikh M, Tepelus TC, Nazikyan T, Sadda SR. Repeatability of automated vessel density measurements using optical coherence tomography angiography. Br J Ophthalmol. 2017;101(4):449–452. | ||
Zhang M, Hwang TS, Campbell JP, et al. Projection-resolved optical coherence tomographic angiography. Biomed Opt Express. 2016;7(3):816–828. |
 © 2018 The Author(s). This work is published and licensed by Dove Medical Press Limited. The
full terms of this license are available at https://www.dovepress.com/terms
and incorporate the Creative Commons Attribution
- Non Commercial (unported, 3.0) License.
By accessing the work you hereby accept the Terms. Non-commercial uses of the work are permitted
without any further permission from Dove Medical Press Limited, provided the work is properly
attributed. For permission for commercial use of this work, please see paragraphs 4.2 and 5 of our Terms.
© 2018 The Author(s). This work is published and licensed by Dove Medical Press Limited. The
full terms of this license are available at https://www.dovepress.com/terms
and incorporate the Creative Commons Attribution
- Non Commercial (unported, 3.0) License.
By accessing the work you hereby accept the Terms. Non-commercial uses of the work are permitted
without any further permission from Dove Medical Press Limited, provided the work is properly
attributed. For permission for commercial use of this work, please see paragraphs 4.2 and 5 of our Terms.