Back to Journals » Clinical Ophthalmology » Volume 15
OCT Variability Prevents Their Use as Robust Biomarkers in Multiple Sclerosis
Authors Para-Prieto M, Martin R ![]() , Crespo S
, Crespo S ![]() , Mena-Garcia L, Valisena A, Cordero L, Gonzalez Fernandez G
, Mena-Garcia L, Valisena A, Cordero L, Gonzalez Fernandez G ![]() , Arenillas JF, Tellez N, Pastor JC
, Arenillas JF, Tellez N, Pastor JC ![]()
Received 5 March 2021
Accepted for publication 8 April 2021
Published 14 May 2021 Volume 2021:15 Pages 2025—2036
DOI https://doi.org/10.2147/OPTH.S309703
Checked for plagiarism Yes
Review by Single anonymous peer review
Peer reviewer comments 2
Editor who approved publication: Dr Scott Fraser
Marta Para-Prieto,1,2 Raul Martin,1,3,4 Sara Crespo,2 Laura Mena-Garcia,1 Andres Valisena,2 Lisandro Cordero,1 Gloria Gonzalez Fernandez,2 Juan F Arenillas,5 Nieves Tellez,5 Jose Carlos Pastor1,2
1Universidad de Valladolid, Instituto Universitario de Oftalmobiología Aplicada (IOBA Eye Institute), Valladolid, 47011, Spain; 2Hospital Clínico Universitario, Department of Ophthalmology, Valladolid, 47005, Spain; 3Universidad de Valladolid, Departamento de Física Teórica, Atómica y Óptica, Valladolid, 47011, Spain; 4Plymouth University, Faculty of Health and Human Sciences, Plymouth, UK; 5Hospital Clínico Universitario, Department of Neurology, Valladolid, 47005, Spain
Correspondence: Raul Martin
IOBA Eye Institute, University of Valladolid, Paseo de Belen, 17, Valladolid, 47011, Spain
Tel +34 983 184 848
Fax +34 983 184 762
Email [email protected]
Objective: To evaluate the agreement between the peripapillary retinal nerve fiber layer (pRNFL) and foveal thickness (FT) measurements among three different spectral domain-optical coherence tomography (SD-OCT) instruments in a sample of multiple sclerosis (MS) patients and a healthy age-matched control group.
Methods: An observational cross-sectional study with three groups: healthy subjects and MS patients w/w a previous clinical diagnosis of optic neuritis (ON) was conducted. The pRNFL and FT were measured using three different SD-OCT instruments (OCT PRIMUS 200 and OCT CIRRUS 500 SD-OCT [Carl Zeiss Meditec] and OCT 3D 2000 [Topcon]).
Results: Twenty eyes from 10 healthy subjects matched in age with MS patients without a previous history of eye disease and 62 MS eyes from 31 MS patients (29 eyes without history of ON and 33 eyes with history of ON) were enrolled. Healthy subjects and MS patients without ON did not show differences between the pRNFL and FT thickness (P> 0.99) with any of the instruments. However, MS eyes with a previous episode of ON showed thinner pRNFL and FT (P< 0.01). PRIMUS and CIRRUS OCT showed better agreement of the pRNLF and FT in both healthy and MS eyes. However, 3D OCT showed less agreement in the pRNFL measurement with CIRRUS in both healthy and MS eyes.
Interpretation: Although OCT is a valuable technology to improve MS patient assessment, differences between devices must be taken into account. It is necessary to create an international group that standardizes the measurement conditions and above all that provides reference bases for normal subjects.
Keywords: spectral-domain optical coherence tomography; SD-OCT, multiple sclerosis; MS, retinal nerve fiber layer; RNFL, foveal thickness; FT, variability
Introduction
Optical coherence tomography has demonstrated that many multiple sclerosis (MS) patients show significant thinning of the inner retinal layers,1–6 even without a past history of clinical optic neuritis (ON).7–10 Even more, analysis of a large-scale cross-sectional data set of MS patients by spectral-domain (SD)-OCT suggested that findings may help to identify distinct patterns in different MS subtypes.4 A recent meta-analysis has proposed that OCT scans from two different ocular regions (optic disc and macular area) should be routinely included in MS clinical practice, research, and trials,2 because OCT could be a predictive biomarker of disease duration, clinical assessment and even for assessing drug efficacy (in patients without ON).10 Furthermore, detectable retinal axonal loss is assumed to occur early in the course of the MS disease.11
Currently SD-OCT is considered to be the most suitable technique and outperforms Visual Evoked Potential (VEP) and B-mode transorbital sonography (TOS) to detect subclinical damage discriminating MS patients from healthy controls. It also shows a progressive decline in optic nerve thickness over time in MS patients.11
Therefore OCT has been accepted as a non-invasive method able to quantify intraretinal layer volumes and it is widely used to quantify the peripapillary retinal nerve fiber layer (pRNFL) and foveal and macular thickness (FT/MT), providing a clinical objective method for monitoring axonal injury in MS and other neurodegenerative diseases.11,12 However, it does not seem that at the clinical level this ancillary test has been incorporated in a routine way in most hospitals.
Different OCT technologies are currently available, namely time domain (TD-OCT) technology, SD-OCT technology, swept source (SS-OCT) technology and others which are in development.13–15 Technological evolution has been so accelerated in recent years, significantly improving the sensitivity of the equipment, and some reference values that exist in the literature have been questioned preventing the ability to compare new studies.16
As already mentioned, the critical parameters in the diagnosis and management of patients with MS are pRNFL and FT, but these measures have shown significant differences from one instrument to another17,18 providing non-interchangeable values in healthy eyes and in MS patients,19 even when SD-OCT devices have been compared to TD-OCT or even between SD-OCT devices.17,18
The magnitude of this variability has not received enough attention and could represent a serious limitation when making comparative analysis with previously published results or when designing multi-center studies with different equipment, even if they are based on SD-OCT.
Thus, the purpose of this study was to evaluate the agreement and the coefficients of variation between pRNFL and FT measurements collected by three commercially-available SD-OCT instruments in a sample of MS patients w/w clinical history of ON and a control group of age-matched healthy subjects.
Methods
Design
This study was an observational cross-sectional study.
Participants
MS patients, diagnosed following internationally accepted standards,20 were recruited from the Neuro-ophthalmology (Ophthalmology) and Demyelinating Diseases (Neurology) Units of the University Hospital Clinico of Valladolid (Valladolid, Spain). Data from both eyes of patients in any MS stage (progressive and relapsing-remitting stage), between 20 and 60 years of age with no concurrent disease other than MS, were collected. Patients with retinal diseases, glaucoma and high refractive errors (myopia higher than 4 dioptres) were excluded after extensive ophthalmological examination. Also, MS patients with suspected ON episode within the previous 3 months were also excluded. Healthy subjects were recruited to get a sample age and sex matched with MS patients. Eye examinations of that group should be fully normal, except for the existence of a refractive error less than 4 diopters.
Eyes were divided into the following three study groups: Group 1: healthy eyes; Group 2: MS eyes with a previous clinical history and diagnosis of ON with more than three months since the acute event; and Group 3: MS eyes without a previous clinical history of ON. ON was defined by the presence of retro-ocular/orbital pain and a sudden decrease in visual acuity accompanied by altered contrast sensitivity and color tests, and the presence of relative afferent pupillary defect at the time of the episode.
Approval of the Valladolid-East Health Area Institutional Review Board (IRB)/Ethics Committee was obtained in June 2017. Written informed consent was obtained previously from all participants enrolled in the study. All subjects were treated in accordance with the Declaration of Helsinki.
Instrumentation
The following data were collected from all eyes included in the study: best-corrected Snellen visual acuity (6 meters), color vision (Roth 28-hue test, Richmond Product, Albuquerque, USA), contrast sensitivity (CSV-1000E test, Vectorvision, Ohio, USA), standard automated perimetry SITA 30–2 using the Humphrey visual field analyzer (Carl Zeiss Meditec, Jena, Germany) and the pRNFL and FT measured with three different OCTs (OCT PRIMUS 200 [Carl Zeiss Meditec, Jena, Germany]; OCT CIRRUS 500 SD-OCT [Carl Zeiss Meditec, Jena, Germany] and OCT 3D 2000 [Topcon Corporation, Tokyo, Japan]).
The OCT PRIMUS 200 and the CIRRUS 500 SD-OCT use a super-luminescent diode (SLD) laser with a center wavelength of 840 nm (27,000 to 68,000 A-scan/sec). TOPCON 3 D 2000 is also an SD-OCT that uses 840 nm SLD and provides structural tomography (27,000 A-scan/sec) and high resolution (12.3 MP) color fundus photography images (45 degrees field of view) in a single capture.
Measurement Procedures
All OCT measurements were conducted following APOSTEL21 recommendations, and the manufacturer’s guidelines in a darkened room, after pupil dilatation (by tropicamide 1%) by three experienced operators. All devices were calibrated before the study. Measurements of different OCTs were collected at same day and daytime in each patient.
The pRNFL was measured in a circle with a diameter of 3.46 mm around the head of the optic nerve in a 255-A individual scan using OCT PRIMUS and 3D OCT TOPCON. Additionally, a three-dimensional scan of a 6 × 6-mm2 area was centered on the optic disc using the information from a 1024 (depth) × 200 × 200-point parallelepiped (predetermined by the manufacturer) with CIRRUS OCT. The mean pRNFL thickness was used as a final value.
The FT was measured in an image that was taken using the nine sectors grid based on the ETDRS with three concentric circles of 1, 3 and 6 mm in diameter. The ETDRS grid was centered on the fovea using the software of each OCT. The retinal thickness provided by each equipment of the central circle (fovea) was used as the final value.
Any scans were excluded if the image signal was less than 7 over 10 or if the images showed artefacts that were inaccurate to guarantee the quality of the measurements (such as, decentered scans, algorithm failure, poor illumination and non-homogeneous reflectivity) according with OSCAR-IB22 quality criteria.
Statistical Analysis
Statistical analysis was performed using the R version 3.5.1. (02/07/2018) [R Core Team, 2018]. A normal distribution of variables was assessed using the Shapiro–Wilk test (P-values >0.05 indicated that data were normally distributed). The mean values of the pRNFL and FT measurements between healthy and MS eyes (w/w history of ON) were calculated. Differences between the pRNFL and MS in healthy and MS patients (w/w history of ON) were assessed using analysis of variance (ANOVA) and posterior pairwise (post hoc) analysis between groups using the Student’s t-test and the Bonferroni correction (P-values <0.05 were considered statistically significant).
Agreement between the pRNFL and FT in healthy and MS eyes was evaluated using Bland-Altman analysis. The differences between the measurements of both devices were plotted against the means of both techniques, and 95% limits of agreement (LoA) were calculated (mean difference ± 1.96 standard deviation [SD]). The intra-class correlation coefficient (based on analysis of variance [ANOVA]) was also calculated and a 95% interval of confidence for ICC was also calculated.
Results
Twenty healthy eyes from 10 healthy subjects (mean age of 36.80±11.72 years, range 22–53 years; 60% women and 40% men) without a previous history of eye disease and 62 MS eyes from 31 MS patients (mean age of 34.45±10.31 years, range 28–51 years; 56% women and 44% men; 29 eyes without a history of ON mean age of 37.96±10.83 years 60% women and 40% men and 33 eyes with ON history mean age of 34.80±7.25 69% women and 31% men) were enrolled in this study. Study groups showed non-statistically differences in age (P=0.954) and sex distribution (P=0.835). Just Caucasian patients were enrolled. All MS patients were explored by CIRRUS and PRIMUS but only data of 26 MS eyes (9 without a history of ON and 17 with a history of ON) could be collected by Topcon 3D OCT due to the impossibility of some patients to repeat the three tests on the same day and at similar times.
Statistical differences were found between healthy and MS eyes in pRNFL (CIRRUS F2.43=9.23, P<0.01; PRIMUS F2.43=13.65, P<0.01 and 3D Topcon OCT F2.22=8.73, P<0.01) and in FT (CIRRUS F2.43=5.07, P=0.01; PRIMUS F2.43=4.36, P=0.01) except with 3D Topcon OCT (F2.43=2.15, P=0.13). Healthy eyes and MS eyes without a previous ON history showed similar pRNFL and FT results (P>0.99) using the three OCT devices. MS eyes with a previous episode of ON showed pRNFL and FT thinner than healthy eyes and MS eyes without ON history. Table 1 summarizes the OCT measurements in all healthy and MS eyes.
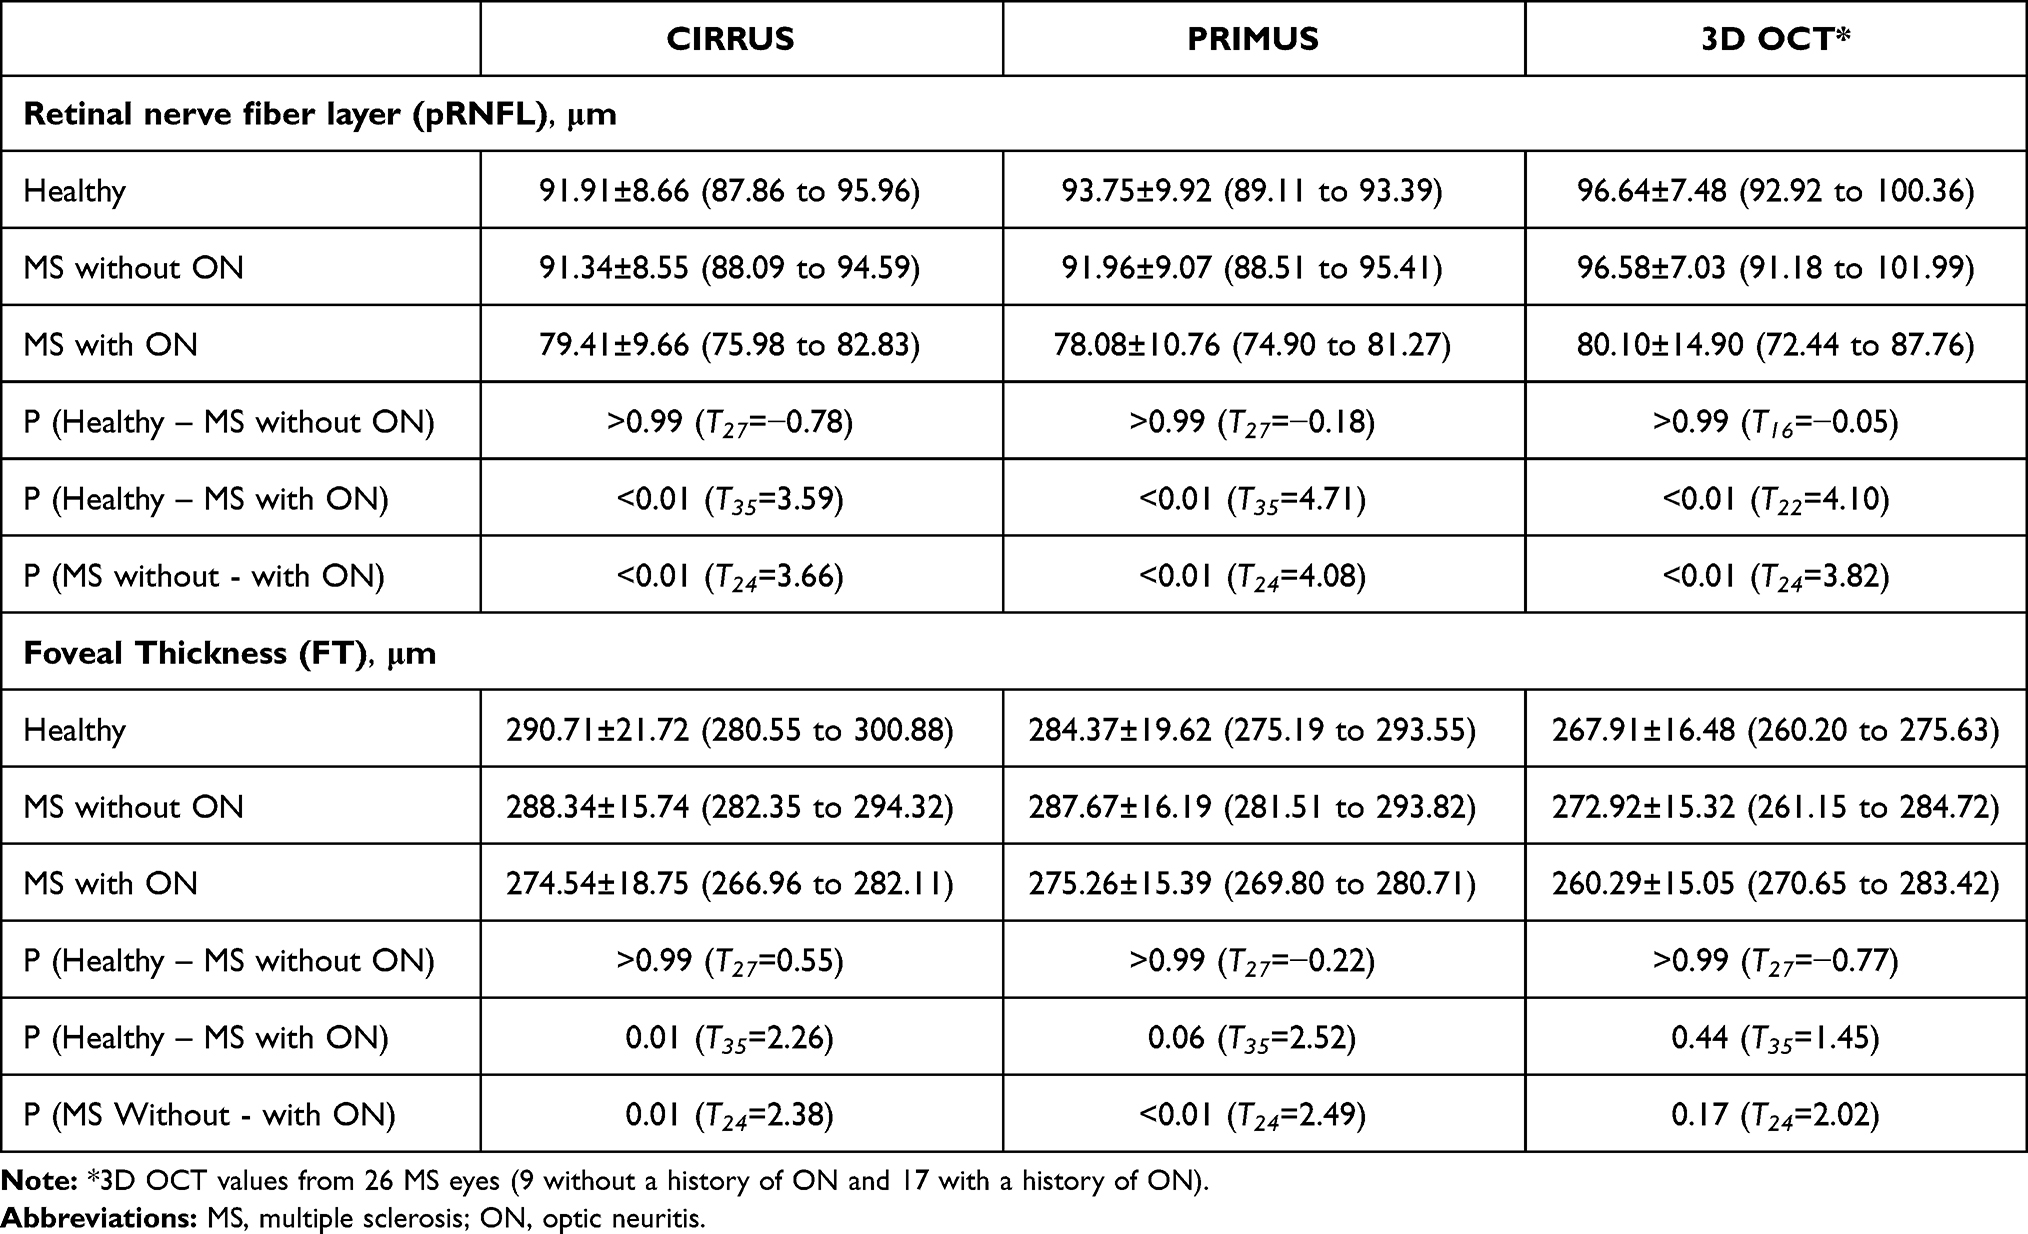 |
Table 1 Summary of pRNFL and FT Measurements (Mean ± Standard Deviation and 95% Interval Confidence) |
PRIMUS and CIRRUS OCT showed better agreement for the pRNFL (Figure 1 and Table 2) than for the FT (Figure 2 and Table 2) in healthy and MS eyes. However, 3D OCT showed worse agreement for the pRNFL measurement with CIRRUS and the FT in healthy and MS eyes (Figure 3 and Table 2). The FT measurements of 3D OCT showed worse agreement in both healthy and MS eyes (Figure 4). Table 2 summarizes the agreement of the pRNFL and FT measurements. Similar trend was found between eyes with and without ON (Table 3).
 |
Table 2 Summary of OCT Agreement for pRNFL and FT Measurements (Mean Difference ± Standard Deviation) |
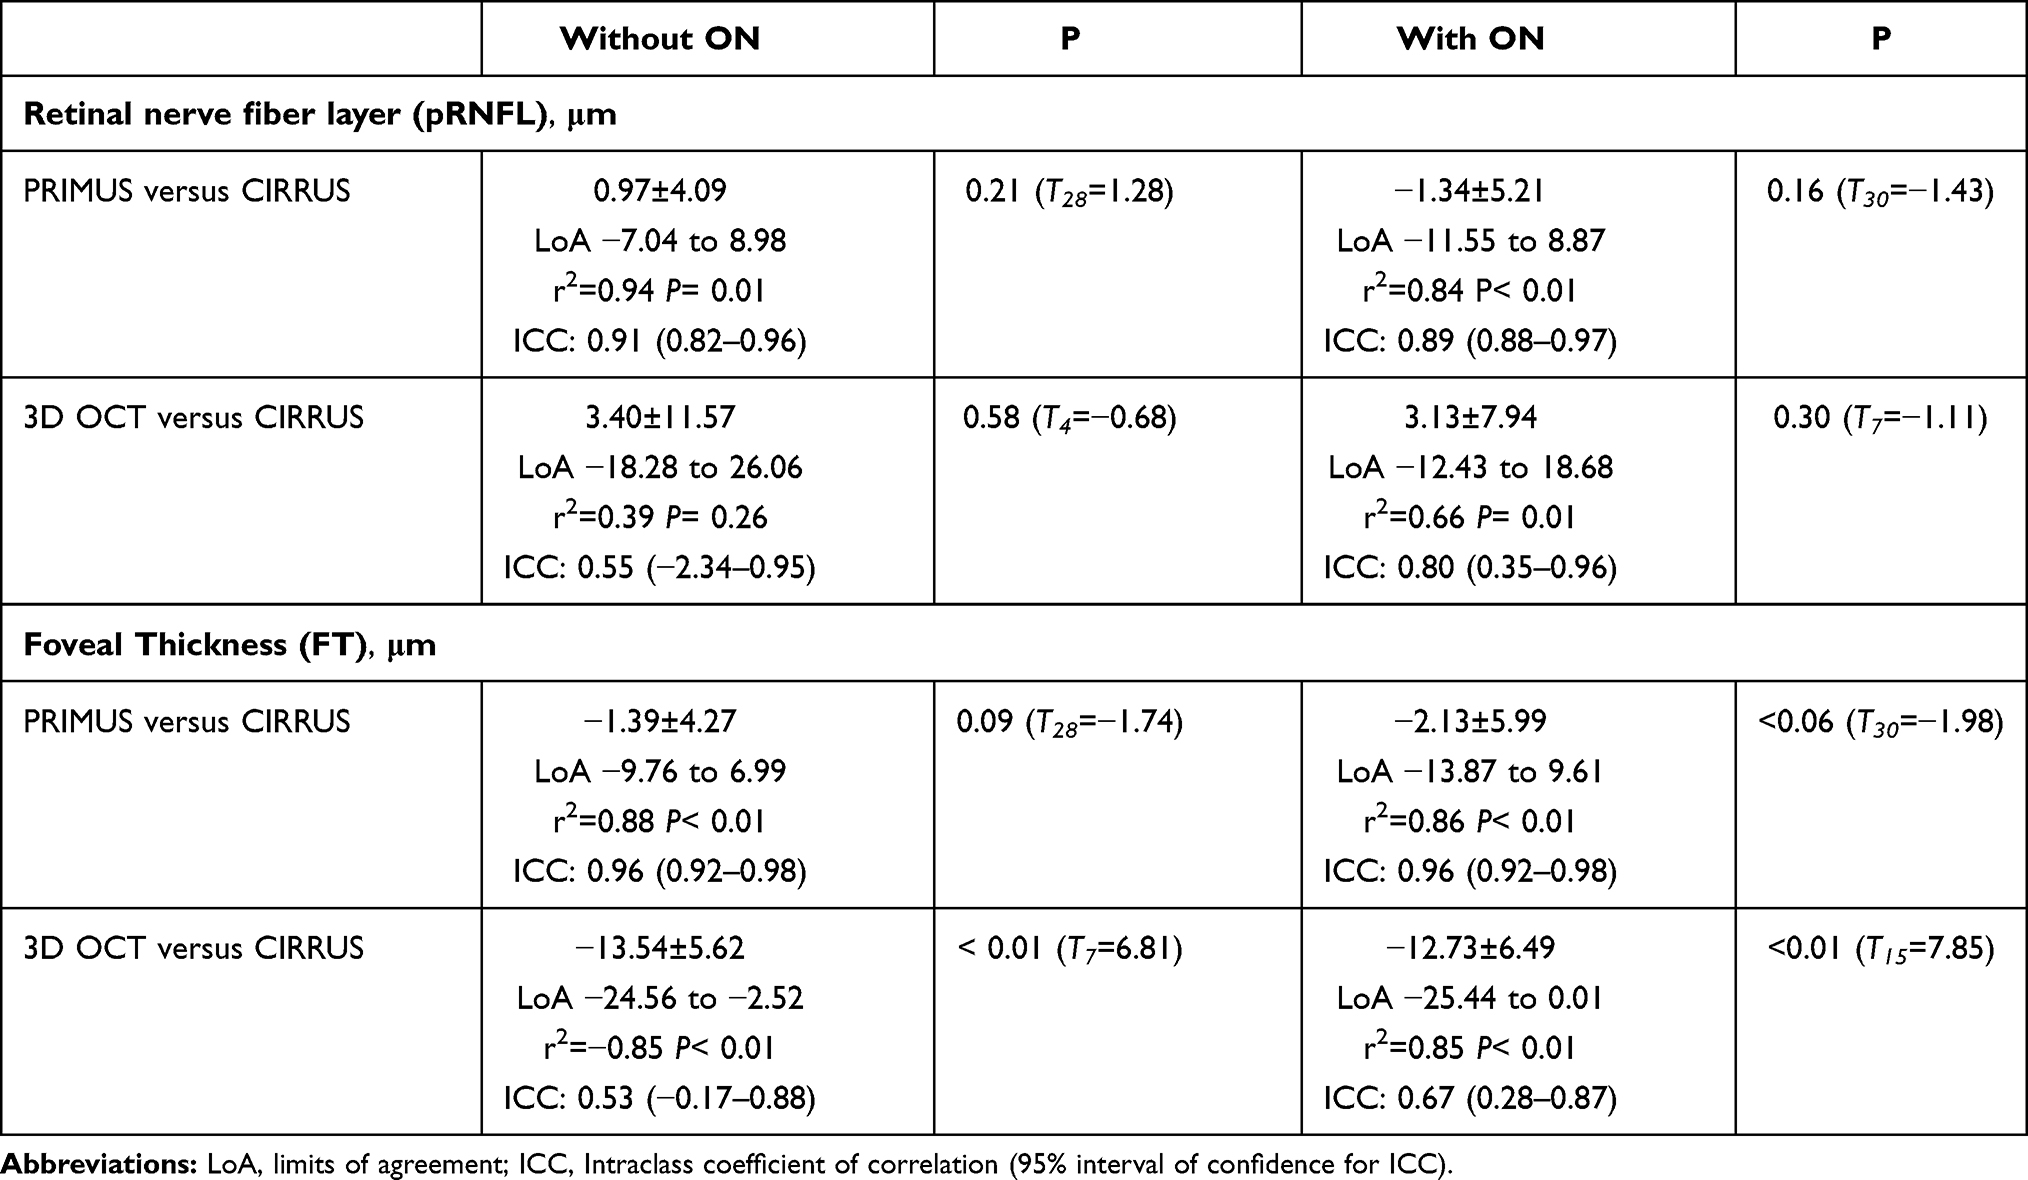 |
Table 3 Summary of OCT Agreement for pRNFL and FT Measurements in MS Patients with and without on (Mean Difference ± Standard Deviation) |
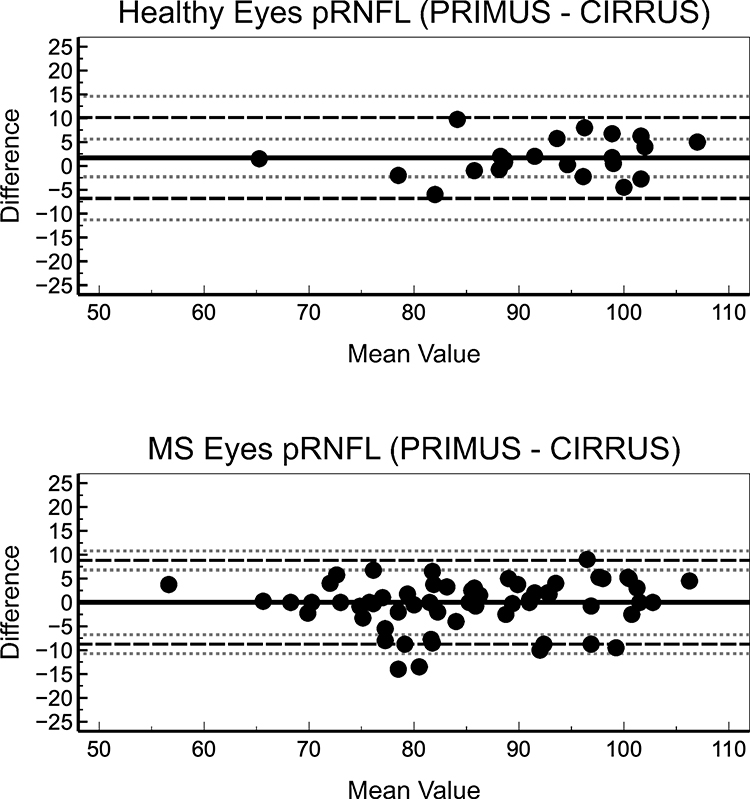 |
Figure 1 Bland-Altman plots depict the agreement between PRIMUS and CIRRUS for RFNL measurement in healthy (top) and MS patients’ eyes (bottom). |
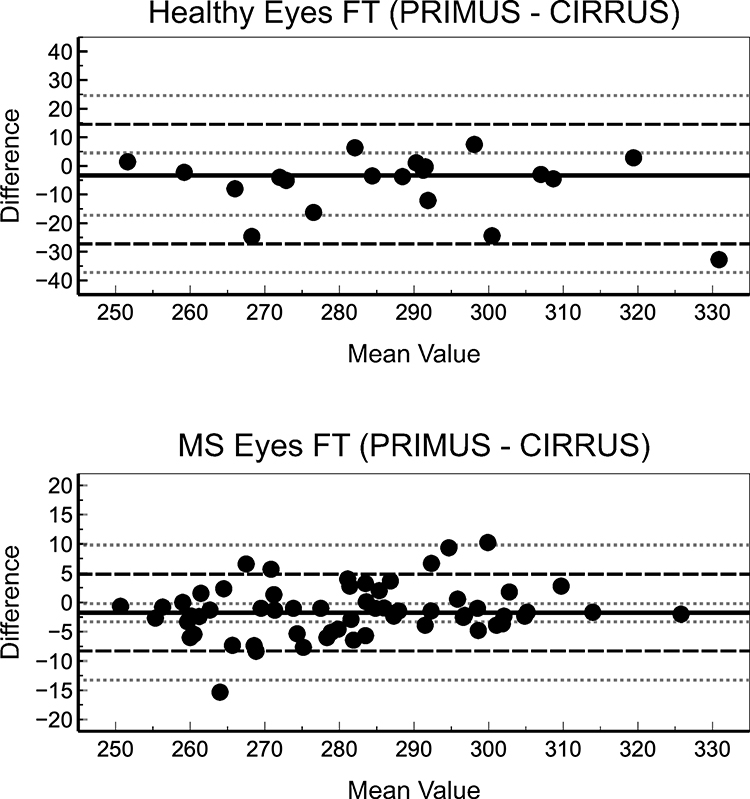 |
Figure 2 Bland-Altman plots depict the agreement between PRIMUS and CIRRUS for FT measurement in healthy (top) and MS patients’ eyes (bottom). |
 |
Figure 3 Bland-Altman plots depict the agreement between Topcon and CIRRUS for RFNL measurement in healthy (top) and MS patients’ eyes (bottom). |
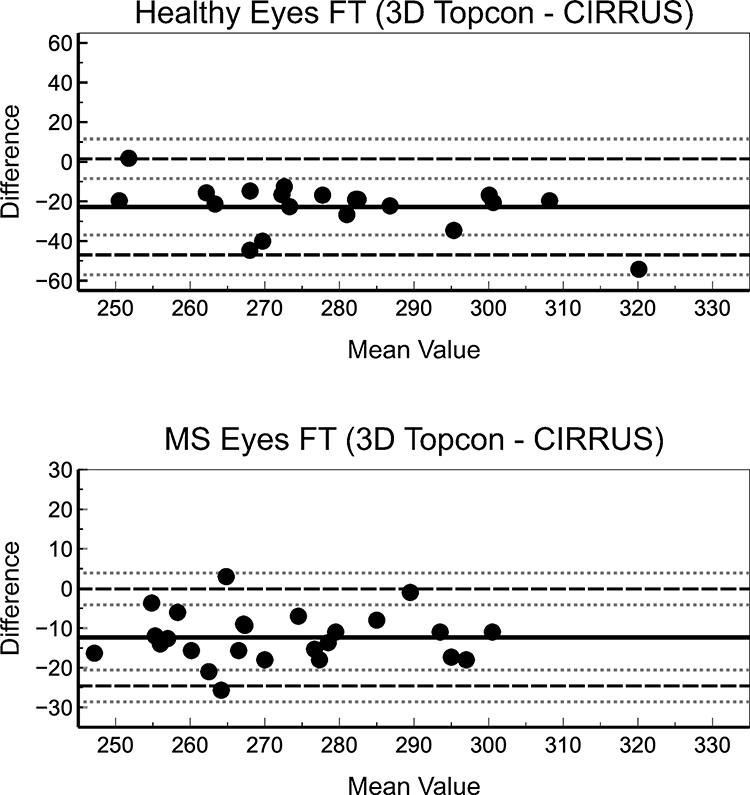 |
Figure 4 Bland-Altman plots depict the agreement between Topcon and CIRRUS for FT measurement in healthy (top) and MS patients’ eyes (bottomp). |
Discussion
OCT technology has not only revolutionized eye-care, but is now widely accepted as an important ancillary test in neurology and neuro-ophthalmic practice16,23,24 given the fact that retina is part of the central nervous system.1,25 SD-OCT is a well-known, reproducible and non-invasive imaging technique that uses near-infrared light to generate cross-sectional or three-dimensional images of the retina12,13,26 providing automated segmentation that generates objective and valid measurements of retinal layer volume and thickness.26 In fact, the use of SD-OCT (mainly pRNFL and FT or volume) has been suggested as potential biomarker for diagnosis, follow-up, and prognosis not only in MS,2–5,8,11,12 but also in other neurological diseases26 including Parkinson's27 and Alzheimer's28 with controversial results.29,30 Although current diagnosis exclusively based on OCT is not realistic approach, in some diseases there are highly specific findings that can help to establish a correct diagnosis and follow up.31
Recently, the entry into the clinic of OCT-angiography (OCT-A) has opened new expectations, not only in the better knowledge of retinal diseases, but also in neurodegenerative diseases.32 And some papers have reported a vessel density reduction in retinas of MS patients and a possible clinical correlation between vessel density and Expanded Disability Status Scale (EDSS), suggesting that angio-OCT could be a good marker of disease and of disability in MS. And that a peripapillary region vessel density reduction, revealed through OCT-A, could be an early event in MS.33
This technological acceleration presents certain problems and the real fact is that despite the scientific evidence, systematic examinations of MS patients with OCT have not become popular in hospitals in the way that may be presumed. In our opinion the lack of key elements, such as reference values are some of the limitations. This work exclusively intends to show that OCT equipment significantly conditions the results and prevents the use of the bibliography values as references.
For pRNFL values there are few published papers.11,34,35 One of them34 is made on Chinese population and values could not been extrapolated to the Caucasian population. One35 is the result of a total of a meta-analysis of 16,084 European adults from 8 cohort studies (mean age range 56.9±12.3 to 82.1±4.2 years) of the European Eye Epidemiology (E3) consortium, all of them made by SD-OCT. They described determinants of the pRNFL thickness such as age, refraction, and presence of systemic vascular and neurovascular diseases. In fact, they obtain normal mean values of 86.8±21.4 µm to 104.7±12.5 µm while our values are lower even though our population of normal subjects is significantly younger (Table 1).
The Cracelen-Gadea et al report11 is of particular interest because it used the Spanish population of similar ages (35.0±5.84), with MS patients and because it is carried out with same equipment (Topcon SD 3D OCT). The pRNFL mean value in normal controls was 104.28±8.5 µm, in MS patients without ON it was 97.31±13.0 µm and in MS patients with past history of ON it was 93.5±11.8 µm. All values differing from those obtained in our study with the same equipment, being significantly lower in the three studied groups (Table 1).
Some reports have even proposed a cut-off value of 75 µm for pRNFL for predict the visual recovery after ON.36,37 This value is close to our results with both Zeiss SD-OCTs in MS patients with established ON, but lower than the value obtained with 3D OTC (Topcon) (Table 1). Recently, Coric et al38 have proposed that a value lower than 85 µm for pRNFL measured with SD OCT in MS patients with ON increases odds of cognitive impairment. Nevertheless, our and others' results11 make this simplification of questionable clinical value.
Additionally, inter-eye percentage difference with SD-OCT have been proposed to improve MS-associated NO diagnosis.39 But our results showed a high inter-subject variability in pRNFL and FT in healthy and MS eyes prevented this possibility. For example, depending of the OCT, the coefficient of variation (SD/mean value) of pRNFL varies from 7.7% to 10.6% in control eyes and from 7.3% to 9.9% MS eyes without ON (Table 1), despite a careful and refined technique of obtaining the images with repeatable OCT devices (see methodology section). Moreover, the variability of the FT is slightly lower (approximately 7% in healthy eyes and close to 5.5% in MS eyes without ON). These values suggest that inter-subject variability could affect the accuracy of proposed cut-off values.
Although the aetiology of axonal atrophy and progressive ganglion cell loss in MS (in the absence of ON) is still unclear, several studies have reported statistically significant thinning of the pRNFL and GCIPL in patients with MS with and without a history of ON compared with that of healthy control subjects.2,40
Our results agree with previous reports showing thinner pRFNL and FT in MS patients w/w ON history.2,3,11 However, we did not find differences in the pRFNL between healthy and MS eyes without ON history (thinning lower than 2 μm), although it has been previously reported.3,40–42
The small difference between pRFNL of healthy versus MS patients without ON history is close to previously reported pRFNL repeatability achieved with SD-OCT, ranged from 3.9 μm to 5.3 μm43 or between 0.3% to 1%.44 Moreover an intra-observer variability less than 2% has been also reported with pRFNL measurements of SD-OCT. Thus, effects of repeatability and intra-observer variability could affect the ability to detect the small difference in pRFNL between healthy and MS patients without ON. So, pRFNL values must be used with caution in MS patients without a previous history of ON.45
The involvement of macular preganglionic elements’ function, during the neurodegenerative process of MS, is controversial and there are few references on this topic.46
Regarding to FT results, our results show slightly lower FT values (between –7.62 μm to –16.17 μm depending of the OCT) in MS patients with a history of ON compared healthy eyes, than previously reported ones (–6.18 μm 95% CI between –8.07 μm to –4.28 μm).2 However, FT thinning in MS patients without ON history (between –2.37 μm to –5.01 μm depending of the OCT) is closer to previous described thinning –2.15 μm 95% CI between –3.15 μm to –1.15 μm.2
In this current study, CIRRUS OCT showed better agreement (lower LoA) with PRIMUS than with Topcon 3D OCT in healthy and MS eyes (with and without ON) for both pRNFL and FT measurements (Tables 2 and 3). This could be explained because CIRRUS and PRIMUS are both from the same manufacturer and share technology and features (similar algorithms, scan protocols, etc.). Differences between devices suggest that CIRRUS and PRIMUS OCT could provide interchangeable measurements; however, it cannot be assumed that different OCTs provide equivalent values, which must be considered in future research and major reviews or meta-analysis. These differences could be of relevance in MS patients follow up, because a pRNFL atrophy rate of –0.36 to –1.4 μm/year have been described in longitudinal reports,2 that suppose a close value to agreement found in this study in MS patients w/w ON. Thus, agreement studies assessing differences of different SD-OCT in MS patients are necessary to facilitate accurate information to manage those patients.
In summary, OCT is a valuable technology to improve MS patient assessment and follow up, although differences between devices make comparisons difficult because SD-OCT outcomes are not interchangeable. Moreover, the variability of the different measures, which are currently high, must be considered. These issues are of paramount relevance in further research in MS patients involving multicenter studies with a large sample size and follow-up, which are necessary to provide cut-off values to improve early detection of MS and follow-up.
Acknowledgments
This research received no specific grant from any funding agency in the public, commercial, or not-for-profit sectors. The authors thank Dr. I Fernandez (Statistical Department of the University of Valladolid) for her support in results assessment and statistical analysis.
Author Contributions
All authors contributed to data analysis, drafting or revising the article, have agreed on the journal to which the article will be submitted, gave final approval of the version to be published, and agree to be accountable for all aspects of the work.
Disclosure
Dr Juan F. Arenillas reports personal fees from Boehringer Ingelheim, personal fees from Bayer, personal fees from Medtronic, personal fees from Daiichi Sankyo, personal fees from BMS-Pfizer, personal fees from Amgen, personal fees from Astra Zeneca, grants from Spanish Ministry Economy, grants from European Commission, grants from Castilla y Leon Department of Education, outside the submitted work. None of the authors has any other financial or proprietary interest in neither material nor method mentioned.
References
1. Jones-Odeh E, Hammond CJ. How strong is the relationship between glaucoma, the retinal nerve fibre layer, and neurodegenerative diseases such as Alzheimer’s disease and multiple sclerosis? Eye (Lond). 2015;29(10):1270–1284. doi:10.1038/eye.2015.158
2. Petzold A, Balcer LJ, Calabresi PA, et al. Retinal layer segmentation in multiple sclerosis: a systematic review and meta-analysis. Lancet Neurol. 2017;16(10):797–812. doi:10.1016/S1474-4422(17)30278-8
3. Parisi V, Manni G, Spadaro M, et al. Correlation between morphological and functional retinal impairment in multiple sclerosis patients. Invest Ophthalmol Vis Sci. 1999;40(11):2520–2527.
4. Oberwahrenbrock T, Schippling S, Ringelstein M, et al. Retinal damage in multiple sclerosis disease subtypes measured by high-resolution optical coherence tomography. Mult Scler Int. 2012;2012:530305. doi:10.1155/2012/530305
5. Saidha S, Sotirchos ES, Oh J, et al. Relationships between retinal axonal and neuronal measures and global central nervous system pathology in multiple sclerosis. JAMA Neurol. 2013;70(1):34–43. doi:10.1001/jamaneurol.2013.573
6. Saidha S, Al-Louzi O, Ratchford JN, et al. Optical coherence tomography reflects brain atrophy in multiple sclerosis: a four-year study. Ann Neurol. 2015;78(5):801–813. doi:10.1002/ana.24487
7. Balk LJ, Tewarie P, Killestein J, et al. Disease course heterogeneity and OCT in multiple sclerosis. Mult Scler J. 2014;20(9):1198–1206. doi:10.1177/1352458513518626
8. Brandt AU, Martinez-Lapiscina EH, Nolan R, Saidha S. Monitoring the course of MS with optical coherence tomography. Curr Treat Options Neurol. 2017;19(4):15. doi:10.1007/s11940-017-0452-7
9. Lambe J, Murphy OC, Saidha S. Can optical coherence tomography be used to guide treatment decisions in adult or pediatric multiple sclerosis? Curr Treat Options Neurol. 2018;20(4):9. doi:10.1007/s11940-018-0493-6
10. Behbehani R, Adnan H, Al-Hassan AA, Al-Salahat A, Alroughani R. Predictors of retinal atrophy in multiple sclerosis: a longitudinal study using spectral domain optical coherence tomography with segmentation analysis. Mult Scler Relat Disord. 2018;21(2):56–62. doi:10.1016/j.msard.2018.02.010
11. Carcelén‐Gadea M, Quintanilla‐Bordás C, Gracia‐García A, et al. Functional and structural changes in the visual pathway in multiple sclerosis. Brain Behav. 2019;9(12):e01467. doi:10.1002/brb3.1467
12. Doustar J, Torbati T, Black KL, Koronyo Y, Koronyo-Hamaoui M. Optical coherence tomography in Alzheimer’s disease and other neurodegenerative diseases. Front Neurol. 2017;8:701. doi:10.3389/fneur.2017.00701
13. van Velthoven ME, Faber DJ, Verbraak FD, van Leeuwen TG, de Smet MD. Recent developments in optical coherence tomography for imaging the retina. Prog Retin Eye Res. 2007;26(1):57–77. doi:10.1016/j.preteyeres.2006.10.002
14. Miller AR, Roisman L, Zhang Q, et al. Comparison between spectral-domain and swept-source optical coherence tomography angiographic imaging of choroidal neovascularization. Invest Ophthalmol Vis Sci. 2017;58(3):1499–1505. doi:10.1167/iovs.16-20969
15. Davila JR, Mruthyunjaya P. Updates in imaging in ocular oncology. F1000Research. 2019;8:1706. doi:10.12688/f1000research.19979.1
16. Watson GM, Keltner JL, Chin EK, et al. Comparison of retinal nerve fiber layer and central macular thickness measurements among five different optical coherence tomography instruments in patients with multiple sclerosis and optic neuritis. J Neuroophthalmol. 2011;31(2):110–116. doi:10.1097/WNO.0b013e3181facbbd
17. Matlach J, Wagner M, Malzahn U, Göbel W. Repeatability of peripapillary retinal nerve fiber layer and inner retinal thickness among two spectral domain optical coherence tomography devices. Invest Ophthalmol Vis Sci. 2014;55(10):6536–6546. doi:10.1167/iovs.14-15072
18. Leite MT, Rao HL, Weinreb RN, et al. Agreement among spectral-domain optical coherence tomography instruments for assessing retinal nerve fiber layer thickness. Am J Ophthalmol. 2011;151(1):85–92.e1. doi:10.1016/j.ajo.2010.06.041
19. Oertel FC, Zimmermann HG, Brandt AU, Paul F. Novel uses of retinal imaging with optical coherence tomography in multiple sclerosis. Expert Rev Neurother. 2018;27:1–13.
20. Thompson AJ, Banwell BL, Barkhof F, et al. Diagnosis of multiple sclerosis: 2017 revisions of the McDonald criteria. Lancet Neurol. 2018;17(2):162–173. doi:10.1016/S1474-4422(17)30470-2
21. Cruz-Herranz A, Balk LJ, Oberwahrenbrock T, et al. The APOSTEL recommendations for reporting quantitative optical coherence tomography studies. Neurology. 2016;86(24):2303–2309. doi:10.1212/WNL.0000000000002774
22. Schippling S, Balk LJ, Costello F, et al. Quality control for retinal OCT in multiple sclerosis: validation of the OSCAR-IB criteria. Mult Scler J. 2015;21(2):163–170. doi:10.1177/1352458514538110
23. Jindahra P, Hedges TR, Mendoza-Santiesteban CE, Plant GT. Optical coherence tomography of the retina: applications in neurology. Curr Opin Neurol. 2010;23(1):16–23. doi:10.1097/WCO.0b013e328334e99b
24. Costello F, Burton JM. Retinal imaging with optical coherence tomography: a biomarker in multiple sclerosis? Eye Brain. 2018;10:47–63. doi:10.2147/EB.S139417
25. Satue M, Obis J, Rodrigo MJ, et al. Optical coherence tomography as a biomarker for diagnosis, progression, and prognosis of neurodegenerative diseases. J Ophthalmol. 2016;2016:8503859. doi:10.1155/2016/8503859
26. Wong BM, Cheng RW, Mandelcorn ED, et al. Validation of optical coherence tomography retinal segmentation in neurodegenerative disease. Transl Vis Sci Technol. 2019;8(5):6. doi:10.1167/tvst.8.5.6
27. Garcia-Martin E, Satue M, Fuertes I, et al. Ability and reproducibility of Fourier-domain optical coherence tomography to detect retinal nerve fiber layer atrophy in Parkinson’s disease. Ophthalmology. 2012;119(10):2161–2167. doi:10.1016/j.ophtha.2012.05.003
28. Chan VTT, Sun Z, Tang S, et al. Spectral-domain OCT measurements in Alzheimer’s disease: a systematic review and meta-analysis. Ophthalmology. 2019;126(4):497–510. doi:10.1016/j.ophtha.2018.08.009
29. Sánchez D, Castilla-Marti M, Rodríguez-Gómez O, et al. Usefulness of peripapillary nerve fiber layer thickness assessed by optical coherence tomography as a biomarker for Alzheimer’s disease. Sci Rep. 2018;8(1):16345. doi:10.1038/s41598-018-34577-3
30. Sánchez D, Castilla-Marti M, Marquié M, et al. Evaluation of macular thickness and volume tested by optical coherence tomography as biomarkers for Alzheimer’s disease in a memory clinic. Sci Rep. 2020;10(1):1580. doi:10.1038/s41598-020-58399-4
31. Rebolleda G, Diez-Alvarez L, Casado A, et al. OCT: new perspectives in neuro-ophthalmology. Saudi J Ophthalmol. 2015;29(1):9–25. doi:10.1016/j.sjopt.2014.09.016
32. Lanzillo R, Cennamo G, Criscuolo C, et al. Optical coherence tomography angiography retinal vascular network assessment in multiple sclerosis. Mult Scler J. 2018;24(13):1706–1714. doi:10.1177/1352458517729463
33. Cennamo G, Carotenuto A, Montorio D, et al. Peripapillary vessel density as early biomarker in multiple sclerosis. Front Neurol. 2020;11:542. doi:10.3389/fneur.2020.00542
34. Huo YJ, Guo Y, Li L, et al. Age-related changes in and determinants of macular ganglion cell-inner plexiform layer thickness in normal Chinese adults. Clin Experiment Ophthalmol. 2018;46(4):400–406. doi:10.1111/ceo.13067
35. Mauschitz MM, Bonnemaijer PWM, Diers K, et al. Systemic and ocular determinants of peripapillary retinal nerve fiber layer thickness measurements in the European Eye Epidemiology (E3) population. Ophthalmology. 2018;125(10):1526–1536. doi:10.1016/j.ophtha.2018.03.026
36. Costello F, Hodge W, Pan YI, Eggenberger E, Freedman MS. Using retinal architecture to help characterize multiple sclerosis patients. Can J Ophthalmol. 2010;45(5):520–526. doi:10.3129/i10-063
37. Costello F, Coupland S, Hodge W, et al. Quantifying axonal loss after optic neuritis with optical coherence tomography. Ann Neurol. 2006;59(6):963–969. doi:10.1002/ana.20851
38. Coric D, Balk LJ, Verrijp M, et al. Cognitive impairment in patients with multiple sclerosis is associated with atrophy of the inner retinal layers. Mult Scler J. 2018;24(2):158–166. doi:10.1177/1352458517694090
39. Coric D, Balk LJ, Uitdehaag BMJ, Petzold A. Diagnostic accuracy of optical coherence tomography inter-eye percentage difference for optic neuritis in multiple sclerosis. Eur J Neurol. 2017;24(12):1479–1484. doi:10.1111/ene.13443
40. González-López JJ, Rebolleda G, Leal M, et al. Comparative diagnostic accuracy of ganglion cell-inner plexiform and retinal nerve fiber layer thickness measures by Cirrus and Spectralis optical coherence tomography in relapsing-remitting multiple sclerosis. Biomed Res Int. 2014;2014:128517. doi:10.1155/2014/128517
41. Albrecht P, Ringelstein M, Müller AK, et al. Degeneration of retinal layers in multiple sclerosis subtypes quantified by optical coherence tomography. Mult Scler J. 2012;18(10):1422–1429. doi:10.1177/1352458512439237
42. Syc SB, Saidha S, Newsome SD, et al. Optical coherence tomography segmentation reveals ganglion cell layer pathology after optic neuritis. Brain. 2012;135(Pt 2):521–533. doi:10.1093/brain/awr264
43. Domínguez-Vicent A, Brautaset R, Venkataraman AP. Repeatability of quantitative measurements of retinal layers with SD-OCT and agreement between vertical and horizontal scan protocols in healthy eyes. PLoS One. 2019;14(8):e0221466. doi:10.1371/journal.pone.0221466
44. Töteberg-Harms M, Sturm V, Knecht PB, Funk J, Menke MN. Repeatability of nerve fiber layer thickness measurements in patients with glaucoma and without glaucoma using spectral-domain and time-domain OCT. Graefes Arch Clin Exp Ophthalmol. 2012;250(2):279–287. doi:10.1007/s00417-011-1811-9
45. Gundogan FC, Demirkaya S, Sobaci G. Is optical coherence tomography really a new biomarker candidate in multiple sclerosis?–A structural and functional evaluation. Invest Ophthalmol Vis Sci. 2007;48(12):5773–5781. doi:10.1167/iovs.07-0834
46. Ziccardi L, Barbano L, Boffa L, et al. Functional assessment of outer and middle macular layers in multiple sclerosis. J Clin Med. 2020;9(11):3766. doi:10.3390/jcm9113766
 © 2021 The Author(s). This work is published and licensed by Dove Medical Press Limited. The
full terms of this license are available at https://www.dovepress.com/terms
and incorporate the Creative Commons Attribution
- Non Commercial (unported, 3.0) License.
By accessing the work you hereby accept the Terms. Non-commercial uses of the work are permitted
without any further permission from Dove Medical Press Limited, provided the work is properly
attributed. For permission for commercial use of this work, please see paragraphs 4.2 and 5 of our Terms.
© 2021 The Author(s). This work is published and licensed by Dove Medical Press Limited. The
full terms of this license are available at https://www.dovepress.com/terms
and incorporate the Creative Commons Attribution
- Non Commercial (unported, 3.0) License.
By accessing the work you hereby accept the Terms. Non-commercial uses of the work are permitted
without any further permission from Dove Medical Press Limited, provided the work is properly
attributed. For permission for commercial use of this work, please see paragraphs 4.2 and 5 of our Terms.