Back to Journals » Diabetes, Metabolic Syndrome and Obesity » Volume 14
Obesity and Prediabetes are Jointly Associated with Lipid Abnormalities Among Adolescents: A Cross-Sectional Study
Authors Almari M ![]() , Mohammad A
, Mohammad A ![]() , Abubaker J, Ziyab AH
, Abubaker J, Ziyab AH ![]()
Received 4 November 2020
Accepted for publication 24 December 2020
Published 22 January 2021 Volume 2021:14 Pages 345—353
DOI https://doi.org/10.2147/DMSO.S290383
Checked for plagiarism Yes
Review by Single anonymous peer review
Peer reviewer comments 2
Editor who approved publication: Professor Ming-Hui Zou
Mohammad Almari,1,* Anwar Mohammad,2,* Jehad Abubaker,2 Ali H Ziyab3
1Department of Health Policy and Management, Faculty of Public Health, Kuwait University, Safat, Kuwait; 2Department of Biochemistry and Molecular Biology, Research Division, Dasman Diabetes Institute, Kuwait City, Kuwait; 3Department of Community Medicine and Behavioral Sciences, Faculty of Medicine, Kuwait University, Safat, Kuwait
*These authors contributed equally to this work
Correspondence: Ali H Ziyab
Department of Community Medicine and Behavioral Sciences, Faculty of Medicine, Kuwait University, Kuwait, P. O. Box 24923, Safat 13110, Kuwait
Tel +96524636545
Fax +96525338948
Email [email protected]
Purpose: Obesity and prediabetes are common among adolescents; however, it is unclear whether they jointly influence lipid levels. Hence, this study sought to assess whether obesity and prediabetes independently or jointly influence lipid levels among adolescents.
Methods: A cross-sectional study enrolled school students aged 14– 19 years (n = 1584). Body mass index (BMI)-for-age z-scores were estimated, and glycated hemoglobin A1c (HbA1c) and lipid profile were measured in capillary blood. Prediabetes was defined as 5.7≤ HbA1c% ≤ 6.4. Geometric means of lipids were calculated, and linear regression was used to estimate the ratio of geometric means (RoGM) and their 95% confidence intervals (CI). All analyses were stratified by sex.
Results: Of the total study participants, 52.1% (826/1584) were females and the majority were aged between 14.0 (5th percentile) and 18.0 (95th percentile) years. Based on BMI-for-age categories, 356 (22.5%) and 494 (31.2%) participants were classified as overweight and obese, respectively. Moreover, 34.3% (543/1584) of the study participants met the prediabetes definition. Compared to those with normal BMI and no prediabetes (reference category), participants classified as obese and having prediabetes had elevated levels of total cholesterol (TC; RoGM=1.09, 95% CI: 1.06– 1.13), low-density lipoprotein cholesterol (LDL-C; 1.21, 1.13– 1.29), non-high-density lipoprotein cholesterol (non-HDL-C; 1.20, 1.14– 1.26), and triglycerides (TG; 1.18, 1.09– 1.27) and reduced HDL-C (0.91, 0.88– 0.95) levels. Independent of prediabetes, obesity was associated with all the investigated lipids. Prediabetes alone was associated with reduced levels of LDL-C and increased levels of HDL-C only among females.
Conclusion: Obesity independently and in combination with prediabetes demonstrated unfavorable effects on lipids among male and female adolescents, whereas prediabetes independently influenced LDL-C and HDL-C favorably only among females.
Keywords: obesity, prediabetes, lipids, adolescents, Kuwait
Introduction
Abnormal plasma lipid levels (dyslipidemia), characterized by elevated levels of total cholesterol (TC), low-density lipoprotein cholesterol (LDL-C), non-high-density lipoprotein cholesterol (non-HDL-C), triglycerides (TG), and/or reduced HDL-C levels, is an established risk factor for cardiovascular diseases.1 Lipid abnormalities during childhood track into adulthood and are associated with early initiation of the atherosclerosis process, which affects the carotid artery elasticity, intima-media thickness, and brachial flow-mediated dilation.2–4 Similarly, diabetes and prediabetes (intermediate hyperglycemia), characterized by blood glucose levels that are above the normal but lower than the diabetes diagnostic thresholds,5 are associated with atherosclerosis and cardiovascular events;6 this increased risk is mediated by lipid abnormalities caused by hyperglycemia.7–9 Obesity is a major shared risk factor for lipid abnormalities and diabetes/prediabetes,10,11 which has been associated with several adverse health outcomes and premature mortality.12,13
Globally, among adolescents, the increase in obesity prevalence is accompanied by a rise in diabetes and prediabetes prevalence.14,15 For instance, among a sample of adolescents aged 14–19 years in Kuwait, we previously reported that 30.6% of them are classified as obese according to their body mass index (BMI)-for-age and 33.3% of them have prediabetes (defined as glycated hemoglobin A1c [HbA1c] between 5.7% and 6.4%). The highest prevalence of prediabetes was observed among obese adolescents (46.4%) and lowest (26.6%) among those with normal BMI-for-age.16 Similarly, approximately 1 out of 5 adolescents in the United States have prediabetes, and prediabetes was associated with an unfavorable cardiometabolic risk profile.17 As demonstrated by the scientific literature, obesity and prediabetes are common among adolescents; however, there is a paucity of investigations concerning the interrelationship between obesity and prediabetes on lipid levels among adolescents. Hence, this study sought to investigate the independent and joint associations of obesity and prediabetes with lipid levels among adolescents in Kuwait.
Methods
Study Setting, Design, and Participants
This cross-sectional study enrolled high school students (n = 1959; grades 10, 11, and 12) attending public schools across the state of Kuwait; these students are typically aged between 14 and 19 years. A cluster random sampling method was used in selecting schools and students as detailed by Almari et al.16 In the current analysis, we excluded participants who reported a history of doctor-diagnosed diabetes (n = 97), participants with undiagnosed diabetes (ie, no prior history of doctor-diagnosed diabetes and measured HbA1c ≥ 6.5% [48 mmol/mol]; n = 17), and participants with missing information for all lipid variables (ie, TC, LDL-C, HDL-C, and TG; n = 261). Of the total enrolled study sample, 80.9% (1584/1959) satisfied our inclusion criteria. This study was approved by the Health Sciences Center Ethical Committee at Kuwait University (no. VDR/EC/3067). The study was conducted in accordance with the principles and guidelines of the Declaration of Helsinki for medical research involving human subjects. Written informed consent was obtained from the parents or legal guardians to enroll the study participants. Subsequently, self-administered questionnaires were completed by parents and students.
Biochemical Analyses and Prediabetes Definition
The point-of-care Cobas b 101 system (Roche Diagnostics, Mannheim, Germany) was used to measure HbA1c and lipid profile in non-fasting capillary blood. Two types of test discs were used: Hb1Ac test disc and lipid panel test disc that quantitatively determined TC, HDL-C, and TG and provided a calculated value for LDL-C using the Friedewald formula when the concentration of TG was <4.52 mmol/L: LDL = TC – HDL – TG/5.18 Moreover, non-HDL-C was calculated as TC minus HDL-C. According to the manufacturer’s performance evaluation report,19 the Cobas b 101 system met the National Glycohemoglobin Standardization Program (NGSP) acceptance criteria for measuring HbA1c20 and met the National Cholesterol Education Program (NCEP) guidelines for measuring lipids.21 We defined prediabetes according to the diagnostic criteria of the American Diabetes Association (ADA) as HbA1c values between 5.7% and 6.4% (39–47 mmol/mol).22
Anthropometric Measurements
Height was measured to the nearest 0.1 centimeter (cm) using a stadiometer, and weight was measured to the nearest 0.1 kilogram (kg) using a digital scale. Height and weight were measured while the participants were without shoes and in light clothing. Body mass index (BMI) was calculated as weight in kilograms divided by height in meters squared (kg/m2). Since BMI, a measure of general adiposity, changes markedly with growth in children and adolescents, we estimated BMI-for-age z-scores (standard deviation; SD) using the World Health Organization (WHO) growth reference for those aged between 5 and 19 years.23 BMI-for-age was categorized as follows: thinness: <−2 SD, normal: −2 to 1 SD, overweight: >1 to 2 SD, and obese: >2 SD.23
Ascertainment of Covariates
Detailed information on covariate ascertainment can be found in a prior publication.16 In brief, information on children’s nationality (Kuwaiti vs non-Kuwaiti), mode of birth, birth order, ever breastfed as an infant, maternal and paternal education level, total family monthly income, and maternal and paternal history of doctor-diagnosed diabetes were collected through a self-administered questionnaire that was completed by parents. Parental history of diabetes was reported by parents by answering the following question: “has the child’s mother/father ever been diagnosed by a physician as having diabetes?” The child was considered to have a parental history of diabetes if the mother and/or father reported a history of ever doctor-diagnosed diabetes. Age was categorized as ≤15, 16, or ≥17 years. Statistical adjustments for the effect of potential confounders were carried out based on prior knowledge in the published literature and a plausible direct/indirect association with the outcome variable.
Statistical Analysis
Descriptive analyses were conducted to calculate the frequencies and proportions of categorical variables. To assess whether the analytical sample (n = 1584) was representative of the total enrolled study sample (n = 1959), we compared proportions of categorical variables across these two samples using chi-square tests. To account for the skewed distribution of lipid variables, geometric means were estimated by log10-transformation of the data and subsequently taking the antilog of the calculated means on the transformed scale. Differences in means of log10-transformed lipid variables across categories of independent variables (sex, age groups, prediabetes status, and BMI-for-age groups) were tested using analysis of variance. All statistical analyses were conducted using SAS 9.4 (SAS Institute, Cary, NC, USA). The statistical significance level was set at α = 0.05 for all association analyses.
Moreover, independent (single) and joint (combined) effects of prediabetes and adiposity on lipid levels were assessed by generating a variable with six combination categories based on prediabetes and BMI-for-age variables: (i) no prediabetes and thinness/normal BMI-for-age group [reference category]; (ii) no prediabetes and overweight BMI-for-age group; (iii) no prediabetes and obese BMI-for-age group; (iv) yes prediabetes and thinness/normal BMI-for-age group; (v) yes prediabetes and overweight BMI-for-age group; and (vi) yes prediabetes and obese BMI-for-age group. Multiple linear regression models were evaluated to assess associations between log10-transformed lipid variables (outcome variables) and the aforementioned variables that account for prediabetes and adiposity status (independent variable), while adjusting for the effects of age, sex, nationality, mode of delivery, birth order, parental history of diabetes, maternal education, paternal education, and family monthly income. Moreover, sex-stratified associations were evaluated. Given that we regressed log10-transformed lipid values, taking the antilog of the linear regression coefficients (β) yields an adjusted ratio of geometric means (RoGM), not the difference between geometric means.24 Hence, the related 95% confidence intervals (CIs) represent limits for RoGM with a null value of 1.
Results
Description of the Study Sample
In total, 1959 high school students were enrolled in the current study (899 males and 1060 females). Of the total enrolled participants, 375 participants were excluded from the analytical study sample (n = 1584) due to reporting a history of doctor-diagnosed diabetes (n = 97), meeting the criteria for undiagnosed diabetes (n = 17), or having missing information for all lipid variables (n = 261). The analytical study sample and the total study sample were similar in all characteristics investigated (Table 1). In the analytical study sample, 826 (52.1%) participants were females and the majority aged between 14.0 (5th percentile) and 18.0 (95th percentile) years, with a median age of 16.0 years. Based on BMI-for-age categories, 356 (22.5%) and 494 (31.2%) participants were classified as overweight and obese, respectively. According to the ADA criteria, 34.3% (543/1584) of the study participants met the prediabetes definition (Table 1).
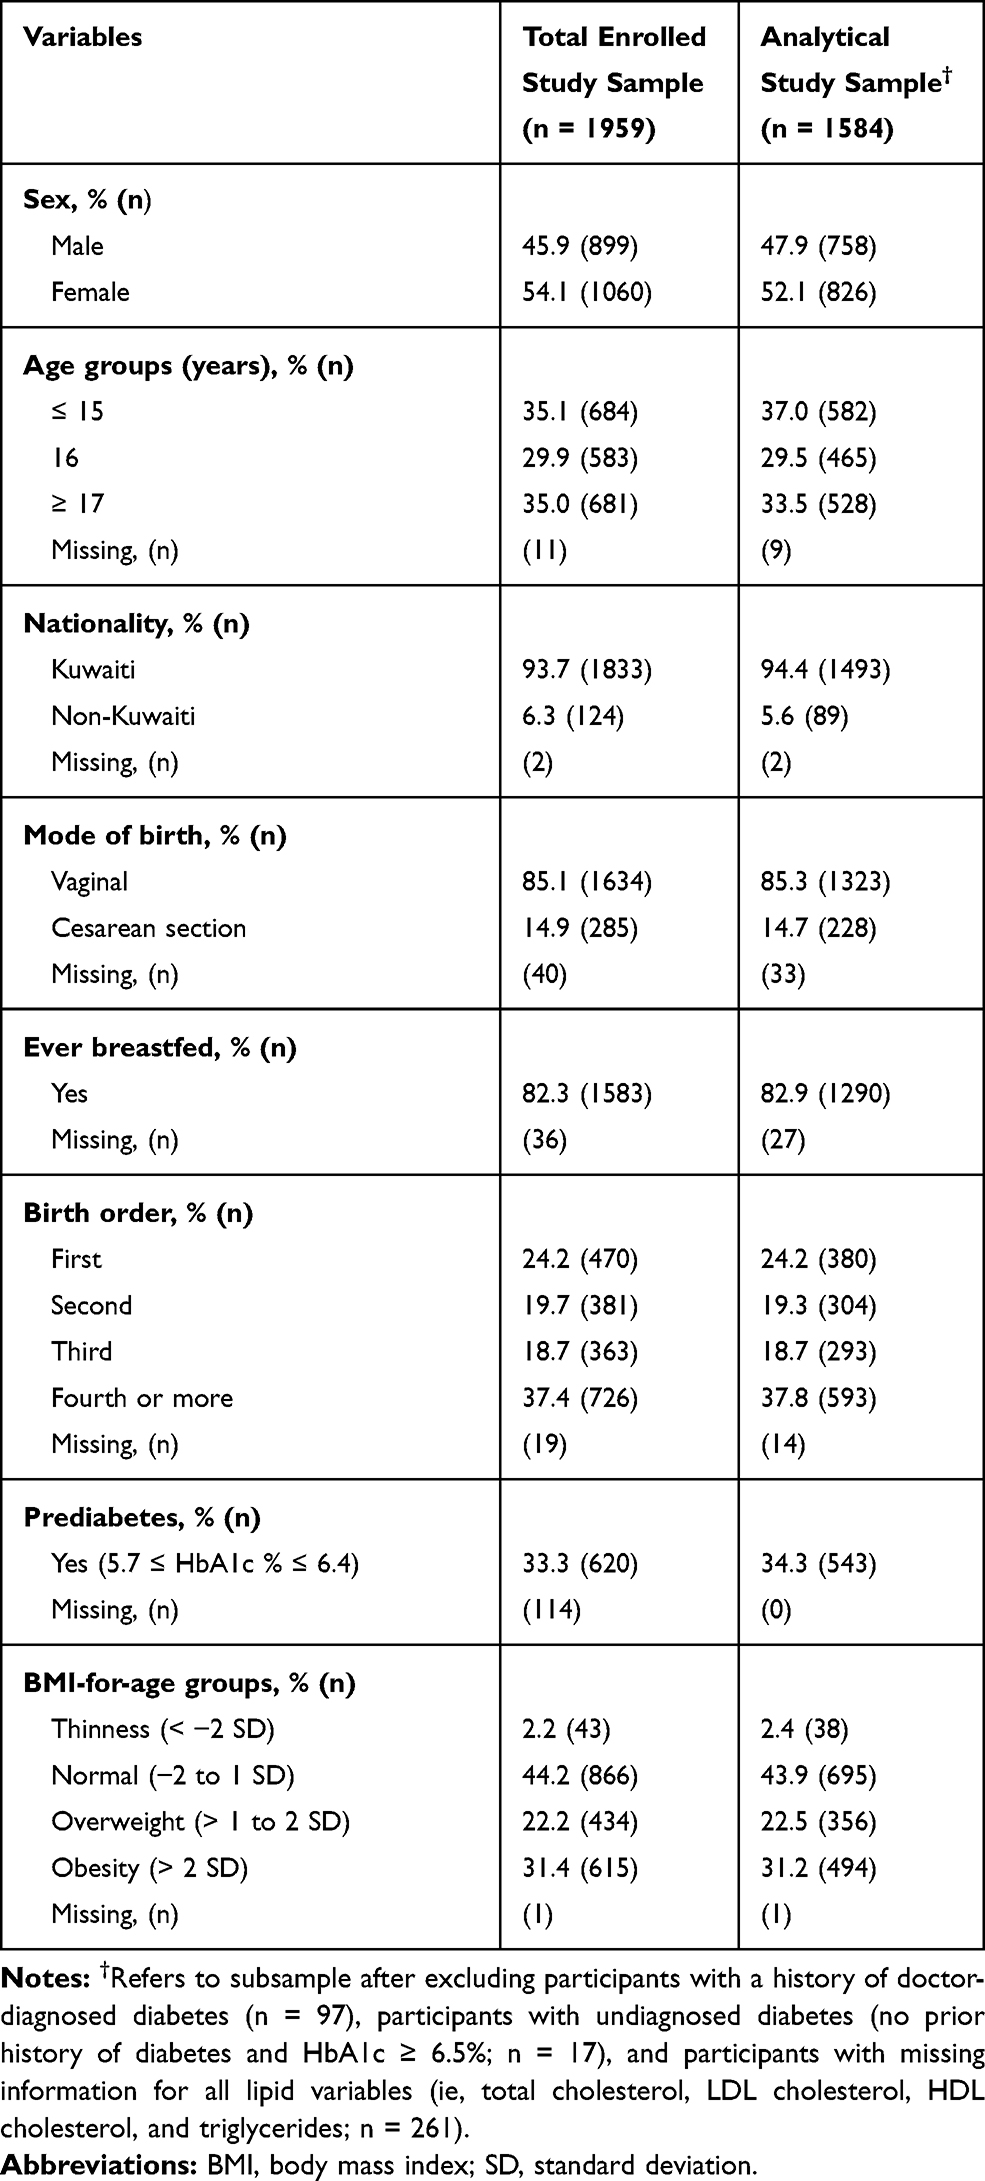 |
Table 1 Characteristics of Total Enrolled Study Sample and Analytical Study Sample |
Lipid Levels According to Participants’ Characteristics
Lipid levels according to participants’ sex, age groups, prediabetes status, and BMI-for-age groups are presented in Table 2. Females compared to males had higher geometric mean of TC (3.71 mmol/L vs 3.44 mmol/L, p-value <0.001) and HDL-C (1.33 mmol/L vs 1.11 mmol/L, p-value <0.001). The TG levels were higher in males than in females (1.31 mmol/L vs 1.25 mmol/L; p-value = 0.046). With regard to age, HDL-C levels showed a decreasing trend as age increased (p-trend = 0.015; Table 2). Compared to participants with normal HbA1c levels, those with prediabetes had higher levels of TC (3.64 mmol/L vs 3.54 mmol/L, p-value = 0.009) and non-HDL-C (2.33 mmol/L vs 2.25 mmol/L, p-value = 0.034). Levels of TC, LDL-C, TG, and non-HDL-C demonstrated statistically significant increasing trends as BMI-for-age increased. In contrast, HDL-C levels decreased as BMI-for-age increased (Table 2).
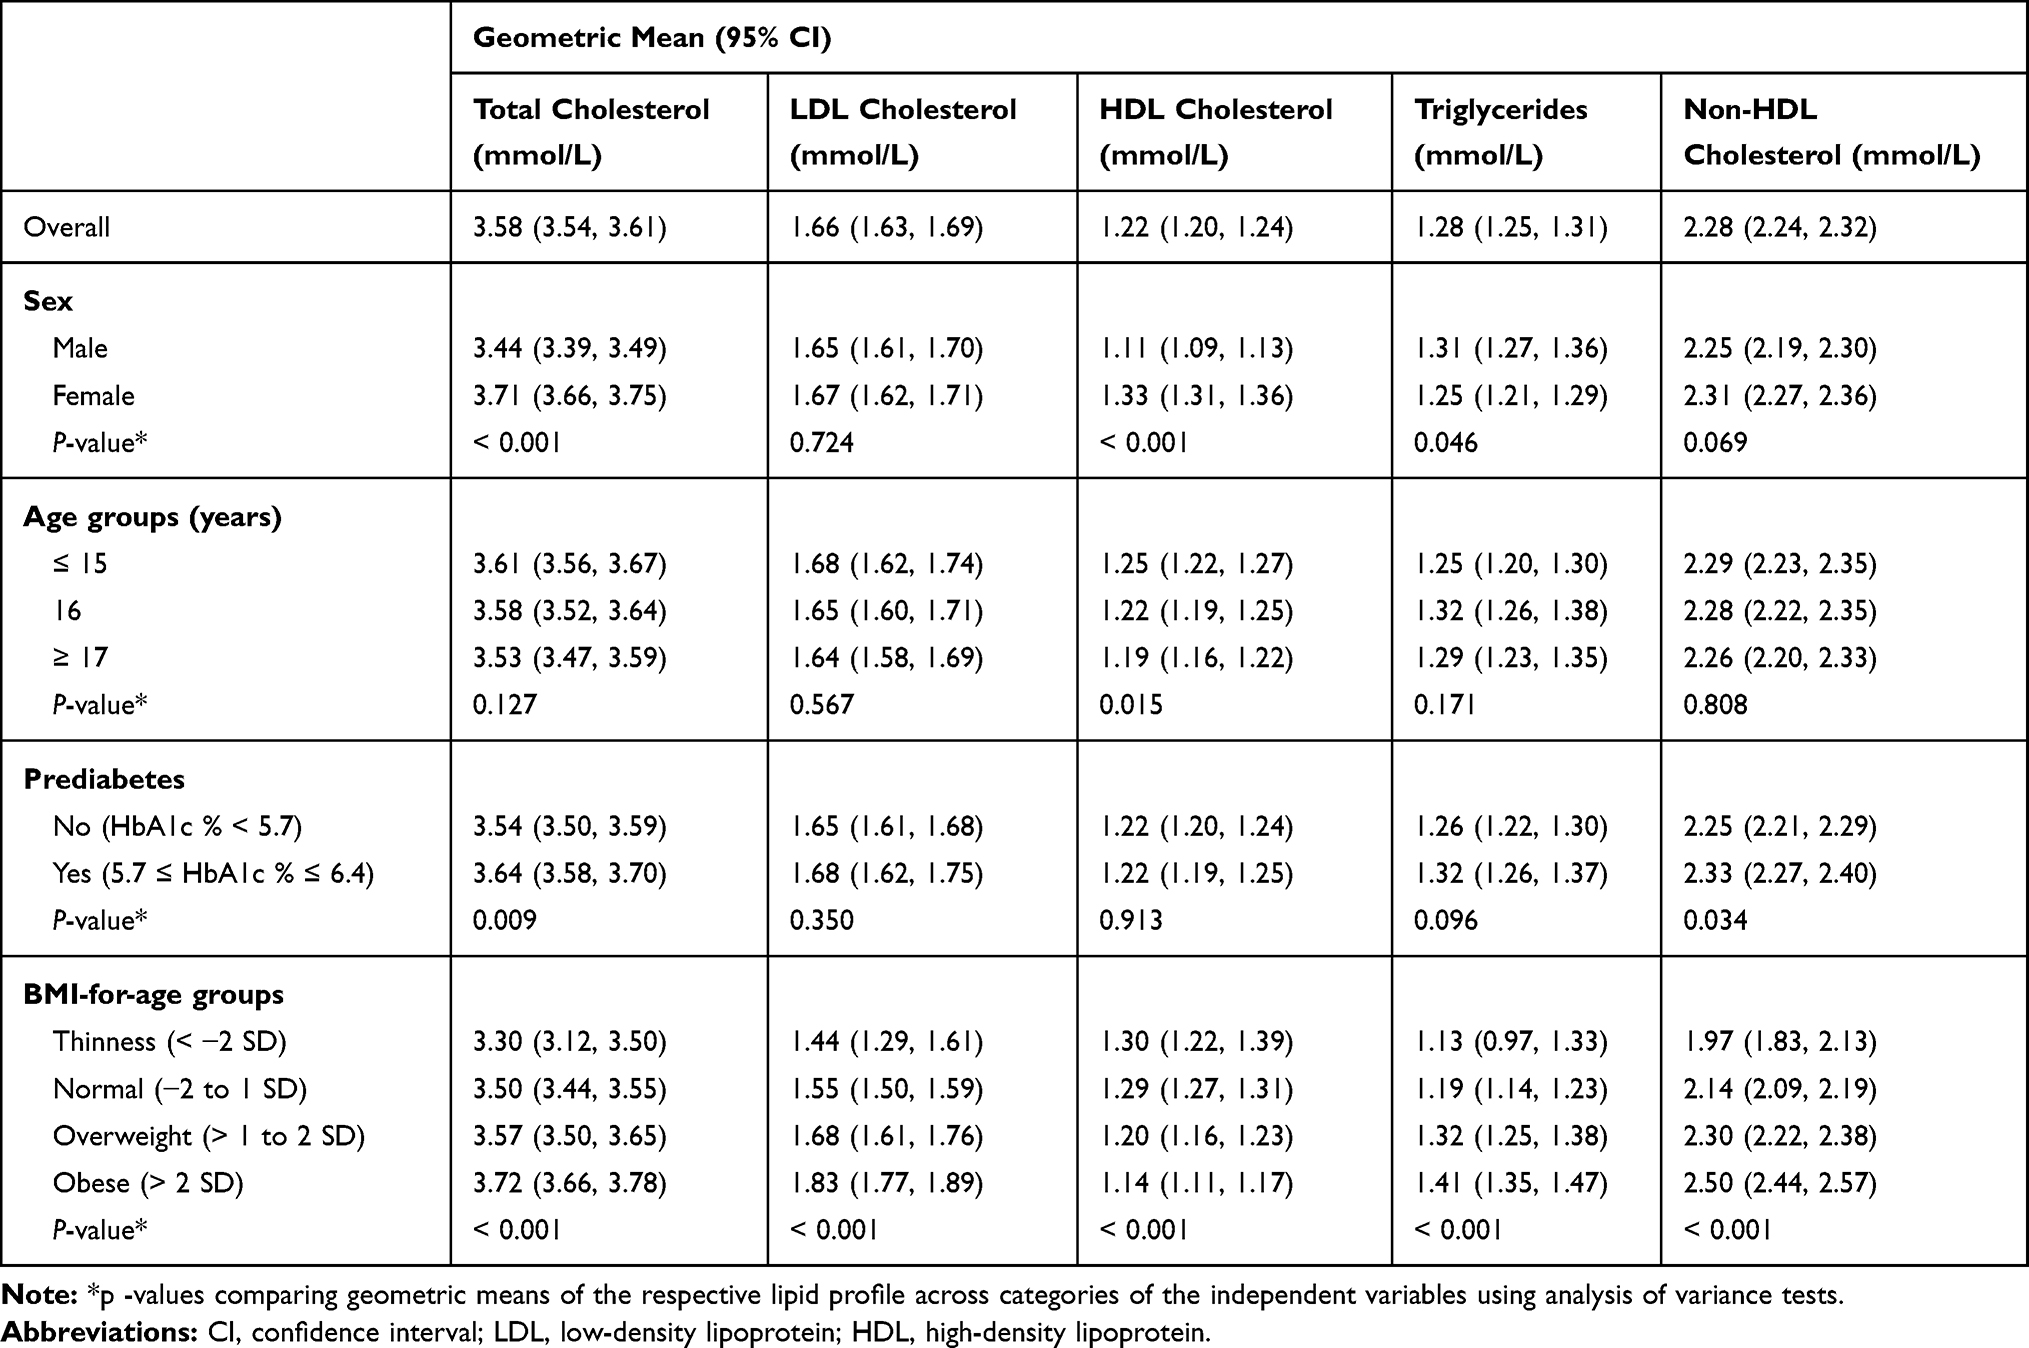 |
Table 2 Lipid Levels According to the Characteristics of Study Participants in the Analytical Study Sample (n = 1584) |
Independent Effects of Obesity and Prediabetes on Lipid Levels
Analysis of the independent and joint effects of obesity and prediabetes on lipid levels in the total analytical sample and stratified by sex are presented in Table 3. Independent of prediabetes, obesity was significantly associated with all the investigated lipid levels. For instance, in the total analytical sample, compared to the “no prediabetes and normal BMI” group, participants in the “no prediabetes and obese” group (ie, independent effect of obesity) had higher levels of TC (RoGM = 1.08, 95% CI: 1.05, 1.11), LDL-C (RoGM = 1.15, 95% CI: 1.08, 1.22), TG (RoGM = 1.16, 95% CI: 1.07, 1.25), and non-HDL-C (RoGM = 1.15, 95% CI: 1.10, 1.20), and decreased levels of HDL-C (RoGM = 0.94, 95% CI: 0.91, 0.98). Sex-specific associations in the aforementioned results were observed, where the independent effects of obesity on increased TC, LDL-C, and non-HDL-C were present only among males. In contrast, the observed decreased levels of HDL-C related to obesity were only present among females (RoGM = 0.93, 95% CI: 0.88, 0.98).
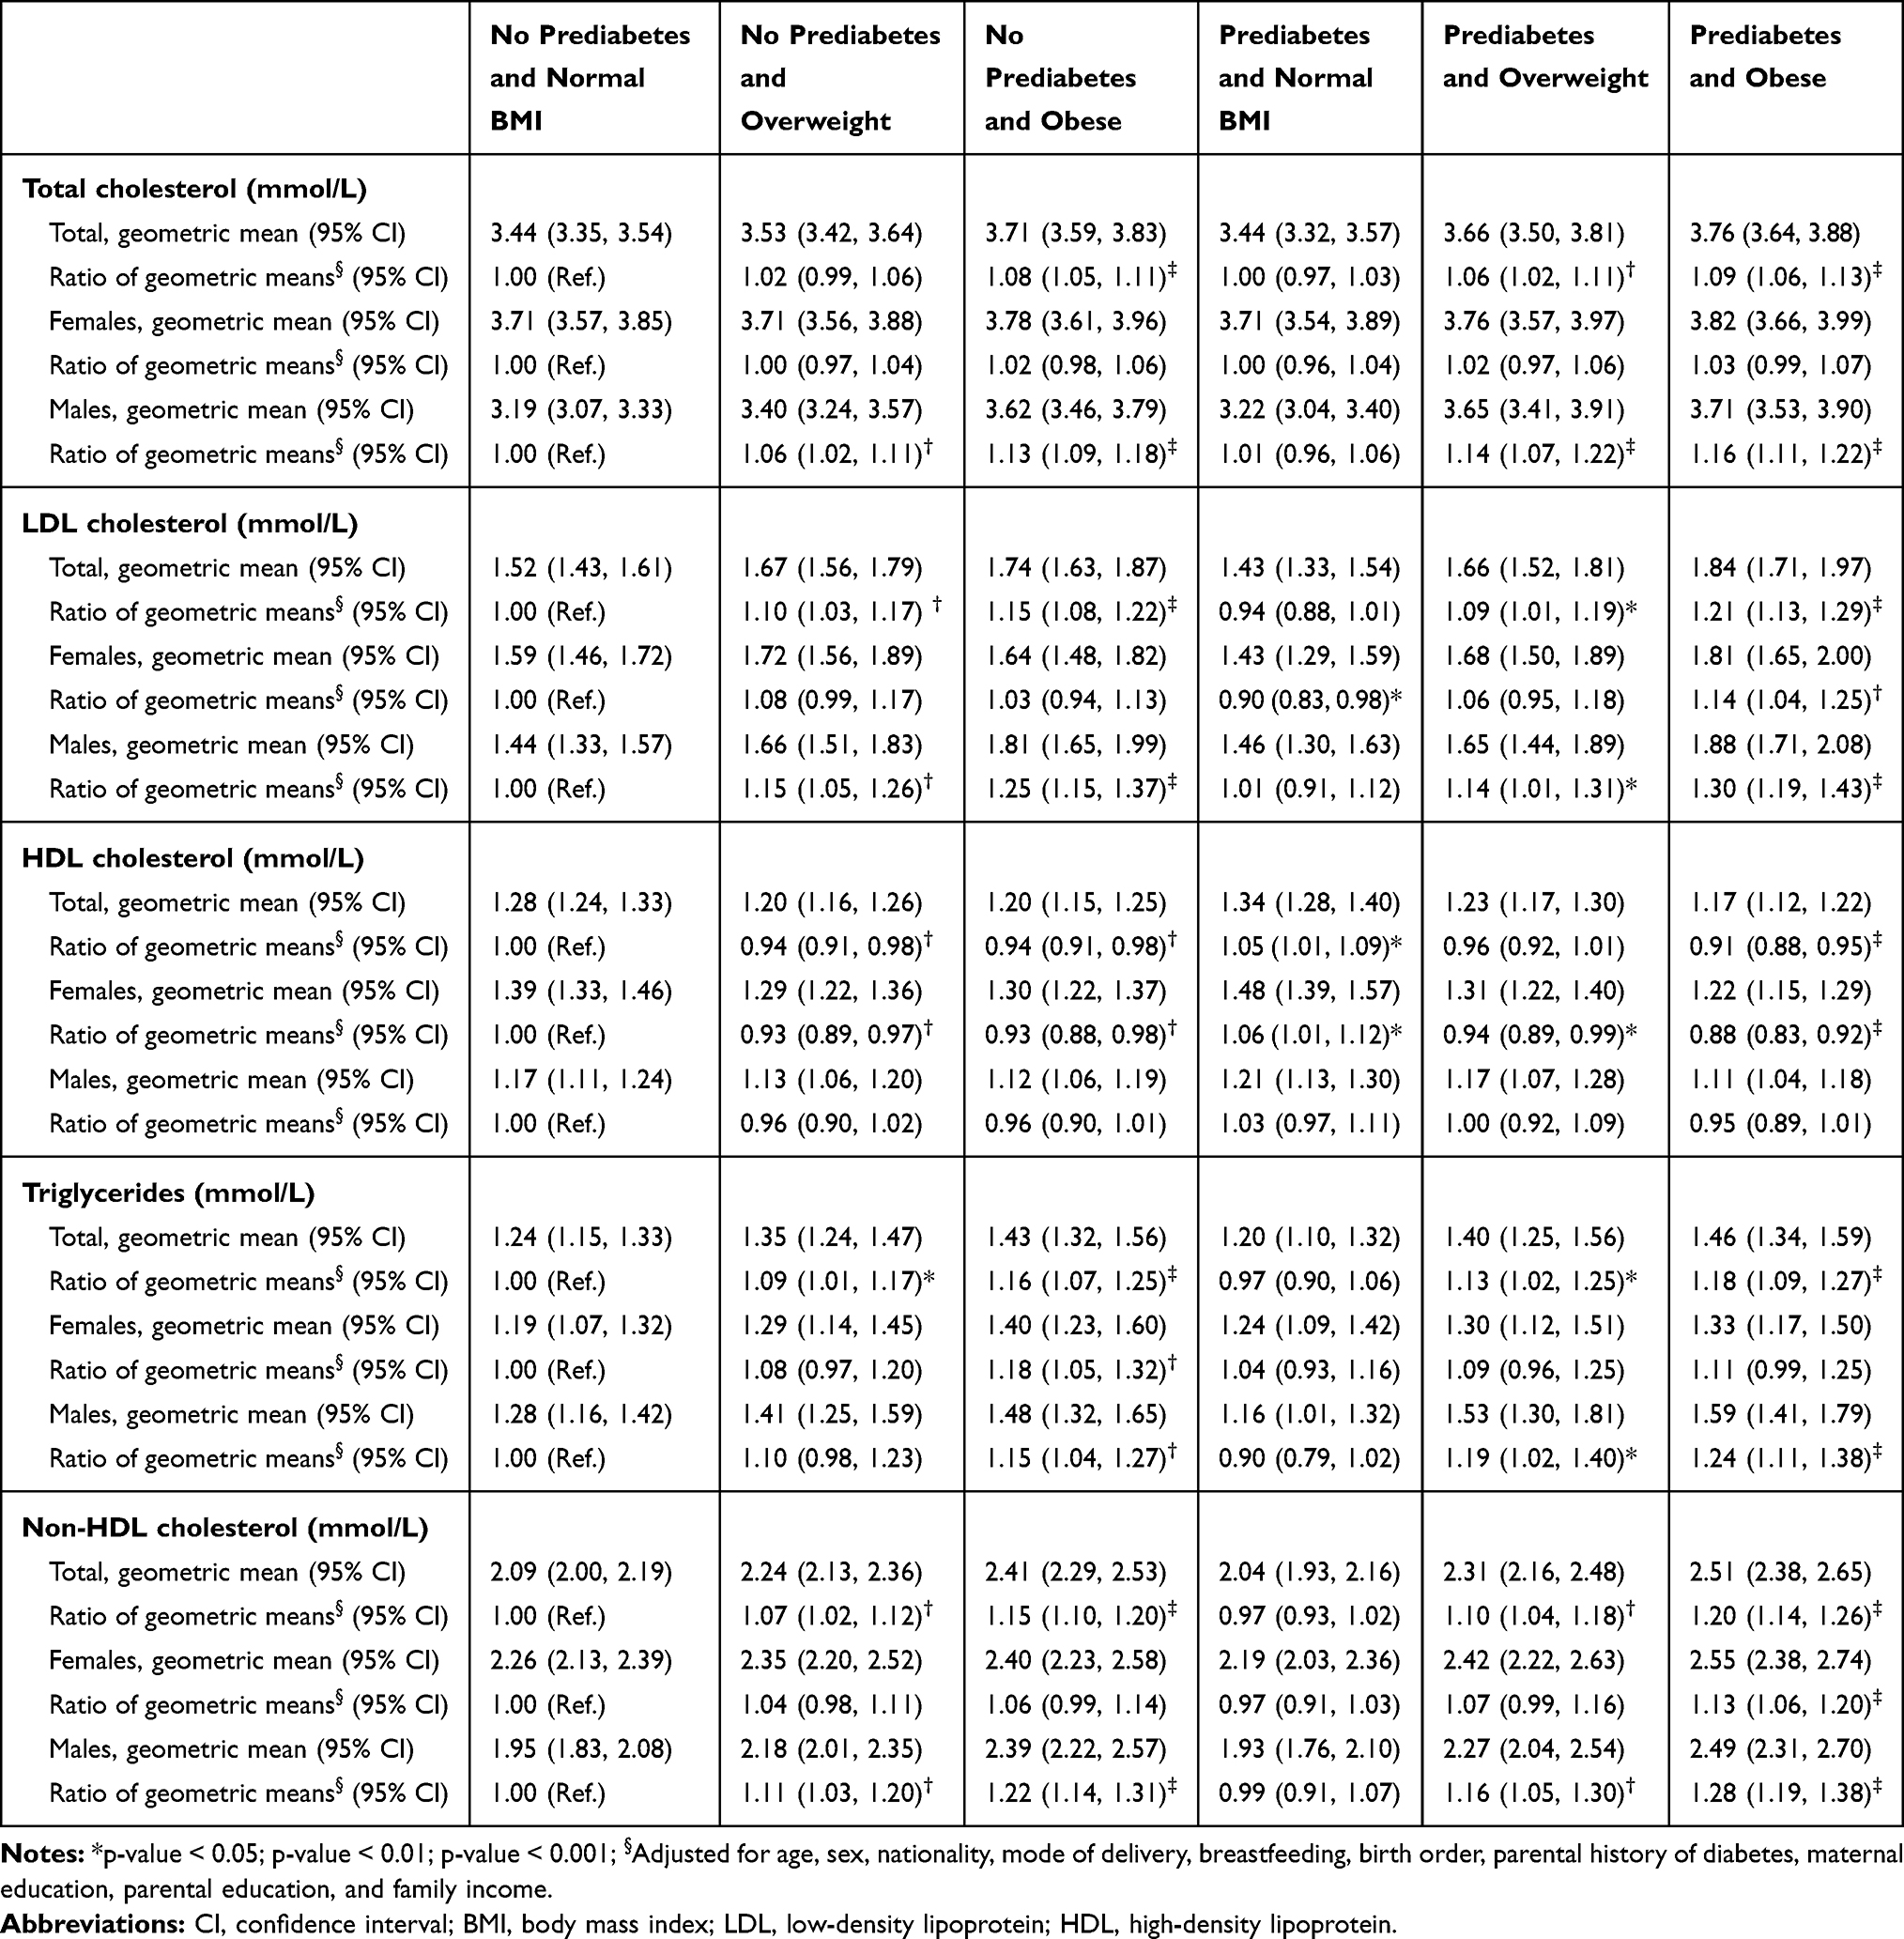 |
Table 3 Geometric Means of Lipid Levels and Ratios of Geometric Means According to Prediabetes Status and Body Mass Index (BMI) Groups in the Total Analytical Study Sample and Stratified by Sex |
The independent effects of prediabetes: compared to the “no prediabetes and normal BMI” group, participants in the “prediabetes and normal BMI” group had increased levels of HDL-C in the total analytical sample (RoGM = 1.05, 95% CI: 1.01, 1.09). This increased HDL-C level was only present among females (RoGM = 1.06, 95% CI: 1.01, 1.12). In addition, we observed that prediabetes was independently associated with decreased LDL-C levels among females (RoGM = 0.90, 95% CI: 0.83, 0.98; Table 3).
Joint Effects of Obesity and Prediabetes on Lipid Levels
Obesity and prediabetes jointly affected the levels of all the investigated lipids. Compared to the “no prediabetes and normal BMI” group, participants in the “prediabetes and obese” group (ie, joint effects of prediabetes and obesity) had higher levels of TC (RoGM = 1.09, 95% CI: 1.06, 1.13), LDL-C (RoGM = 1.21, 95% CI: 1.13, 1.29), TG (RoGM = 1.18, 95% CI: 1.09, 1.27), and non-HDL-C (RoGM = 1.20, 95% CI: 1.14, 1.26), and decreased levels of HDL-C (RoGM = 0.91, 95% CI: 0.88, 0.95) in the total analytical sample. The joint effects of prediabetes and obesity that were associated with increased TC and TG levels in the total analytical sample were only present among males in the sex-stratified analysis (Table 3). The observed decreased HDL-C levels associated with the joint effects of prediabetes and obesity in the total analytical sample were present only among females in the sex-stratified analysis. Prediabetes and obesity were jointly associated with increased levels of LDL-C and non-HDL-C among both females and males (Table 3).
Discussion
The current study investigated the independent and joint effects of obesity and prediabetes on lipid levels among adolescents. Obesity independently showed associations with all investigated lipid indicators, which were associated with increased levels of TC, LDL-C, TG, and non-HDL-C and decreased HDL-C levels. Prediabetes was independently associated with increased HDL-C levels and decreased LDL-C levels only among females. In addition, obesity and prediabetes were jointly associated with unfavorable lipid profiles characterized by elevated levels of TC, LDL-C, TG, and non-HDL-C, and lower levels of HDL-C. Overall, obesity independently and in combination with prediabetes demonstrated strong unfavorable effects on lipids. Interestingly, prediabetes independently influenced LDL-C and HDL-C only among females in a favorable manner. These results also indicate that the effects of obesity and prediabetes on lipid levels are sex-specific.
Approximately one in three adolescents in the current study sample were classified as obese according to their BMI-for-age z-scores. This high prevalence estimate is in agreement with a previous study in Kuwait, where the reported prevalence of obesity was 30.5% among school children aged 6–18 years.25 Such findings demonstrate an alarmingly high prevalence of obesity among the pediatric population in Kuwait, which exceeds prevalence estimates of most parts of the world.15 Similarly, we estimated that 34.3% of adolescents in our study sample met the ADA-HbA1c criteria for prediabetes. This estimate of prediabetes prevalence exceeds most regional and international estimates. For instance, among obese/overweight Emirati children and adolescents (aged 11 to 17 years), prediabetes prevalence was estimated to be 21.9% according to the ADA-HbA1c criteria.26 Among an adolescent sample in the United States, the prevalence of prediabetes was estimated to be 18.0%, defined by having impaired fasting glucose (IFG), impaired glucose tolerance (IGT), or increased HbA1c level according to the ADA criteria.17 Therefore, the high estimates of obesity and prediabetes observed in our study indicate that a significant proportion of adolescents in Kuwait are predisposed to the early risk of cardiometabolic disorders.
In the current analysis, we reported that obesity was independently associated with an unfavorable lipid profile. This adverse impact of obesity on lipid levels has been reported in a number of studies.27–29 On the other hand, emerging evidence has suggested that prediabetes is potentially linked to an adverse lipid profile.30 For instance, it has been demonstrated that HbA1c-defined prediabetes is associated with abnormal lipid profiles (characterized by high TG levels and low HDL-C levels) among adults.31 However, the results of this analysis can be highly confounded due to the fact that the authors did not account for participants’ body fat mass. Similarly, a study among adolescents in the United States reported higher non-HDL-C levels among those with prediabetes compared to those without prediabetes; however, this analysis did not adjust for body fat mass.17 Among a sample of Danish children and adolescents, the prevalence of dyslipidemia was higher among those with IFG compared to those with normal glucose tolerance.10 On the other hand, this association lost statistical significance after adjusting for the participants’ BMI. In our study, the unadjusted analysis indicated that adolescents with prediabetes had significantly higher levels of TC and non-HDL-C compared to those with normal HbA1c levels (Table 2). Nonetheless, after adjusting for the effects of obesity degree and other covariates, this association was negligible.
Obesity independently and in combination with prediabetes demonstrated strong associations with an adverse lipid profile. In general, the strength of the independent effect of obesity was similar to the joint effects of obesity and prediabetes on lipid profile. For instance, obesity was independently associated with 1.15-fold higher LDL-C levels, whereas obesity and prediabetes jointly increased LDL-C levels by 1.21-fold. Hence, this observation indicates that obesity is the major factor affecting lipid profiles among adolescents, and prediabetes has a minimal additive effect (Table 3).
Interestingly, we observed sex-specific associations between obesity and prediabetes with lipid levels. For example, obesity was independently associated with elevated levels of TC, LDL-C, and non-HDL-C only among males, whereas it was associated with reduced HDL-C levels only among females. This observation of obesity having more detrimental effects on lipid profile among males compared to females has been corroborated in previous studies.32 The sex dimorphism in the effect of obesity on lipids has been explained by differences in body fat distribution that is influenced by sex hormones:33 females have more subcutaneous fat (pear-shaped) and males have more visceral fat (apple-shaped), and visceral fat is more metabolically deleterious than subcutaneous fat.32,34,35 Moreover, the observed reduction in HDL-C in obese females compared to normal-weight females in the current report is in agreement with observations from a previous report.36 Moreover, we observed lower LDL-C levels and higher HDL-C levels among females with prediabetes and normal BMI compared to those with no prediabetes and normal BMI. This indicates that prediabetes in the absence of adiposity is associated with favorable LDL-C and HDL-C levels among females. Although a previous investigation reported slightly, but significantly, lower mean total LDL-C among subjects with diabetes compared to those without diabetes,37 future studies are needed to corroborate our new findings of favorable LDL-C and HDL-C levels that are associated with prediabetes among females.
The strengths of our study include a large sample size using random school-based adolescents and objective measurements of weight, height, HbA1c, and lipids. Nevertheless, our study had some limitations. The use of the point-of-care system to measure HbA1c and lipid profile has been speculated to be less accurate than standardized laboratory-based analysis.16 However, studies have shown that the Cobas b 101 system meets the NGSP requirements and provides valid and reliable measurements of HbA1c.38,39 Similarly, the point-of-care system meets the NCEP guidelines for measuring lipids and provides valid and reliable measurements.19,40 Hence, the effect of measurement error when assessing lipid profile and misclassification of prediabetes status, if present, is minimal in the results of the current report. Moreover, a further limitation is the use of non-fasting capillary blood for measuring lipid profiles. However, emerging studies and new recommendations indicate that fasting is not necessary for lipid profile assessment.41 For instance, the results of a large study (n = 12,744) conducted among children showed minimal differences between fasting and non-fasting lipid profiles, indicating that fasting before lipid assessment may not be necessary.42 Additionally, studies have shown that fasting and non-fasting lipid profiles similarly predict coronary events.43,44 Lack of information on the race/ethnic background of study participants is a further limitation to our study. However, given that 94.4% of the study participants were of Kuwaiti nationality, we speculate that the unmeasured effect of race/ethnicity, if any, is negligible in our results. It is also essential to note that our analysis aimed to assess concurrent associations between obesity and prediabetes with lipid profiles, and not to infer causal relationships.
Conclusion
Our data suggest that obesity is an important predictor of lipid abnormalities among adolescents, and this adverse effect of obesity was slightly augmented when coupled with the co-occurrence of prediabetes. Overall, the effect of obesity on lipid profile was more pronounced in males than in females. In contrast, our data showed for the first time that prediabetes can have favorable effects on LDL-C and HDL-C levels only among females; this observation needs further corroboration. Therefore, to reduce early cardiovascular disease risk among youth, prevention of childhood obesity should be a public health priority.
Data Sharing Statement
The data used to support the findings of this study are available from the corresponding author upon request ([email protected]).
Ethics Approval and Informed Consent
This study was approved by the Health Sciences Center Ethical Committee at Kuwait University (no. VDR/EC/3067). Written informed consent was obtained from the parents or legal guardians to enroll study participants.
Consent for Publication
Not applicable.
Acknowledgments
We would like to thank the nursing team and field workers, namely Khalid H. Alenezi, Waleed F. Alrasheedi, Nawaf M. Alqattan, Jerome Tacaisan, Samer H. Noufal, Tamer M. Attiy, Mohamed F. Khalaf, Hazzel J. Lera, Liby K. Thomas, and Junna M. Casimina for their hard work and dedication.
Funding
This study was partially funded by the Kuwait National Guard, which also provided the nursing team. We also acknowledge partial funding from the College of Graduate Studies at Kuwait University and Salman Abdullah Al Dabbous and Sons Company. The funders had no role in the study design, data collection, analysis and interpretation, decision to publish, or preparation of the manuscript.
Disclosure
The authors declare that they have no conflicts of interest.
References
1. Wong ND. Epidemiological studies of CHD and the evolution of preventive cardiology. Nat Rev Cardiol. 2014;11(5):276–289. doi:10.1038/nrcardio.2014.26
2. Camhi SM, Katzmarzyk PT. Tracking of cardiometabolic risk factor clustering from childhood to adulthood. Int J Pediatr Obes. 2010;5(2):122–129. doi:10.3109/17477160903111763
3. Juhola J, Magnussen CG, Viikari JS, et al. Tracking of serum lipid levels, blood pressure, and body mass index from childhood to adulthood: the Cardiovascular Risk in Young Finns Study. J Pediatr. 2011;159(4):584–590. doi:10.1016/j.jpeds.2011.03.021
4. Juonala M, Viikari JS, Ronnemaa T, et al. Associations of dyslipidemias from childhood to adulthood with carotid intima-media thickness, elasticity, and brachial flow-mediated dilatation in adulthood: the cardiovascular risk in young finns study. Arterioscler Thromb Vasc Biol. 2008;28(5):1012–1017. doi:10.1161/ATVBAHA.108.163329
5. Tabak AG, Herder C, Rathmann W, Brunner EJ, Kivimaki M. Prediabetes: a high-risk state for diabetes development. Lancet. 2012;379(9833):2279–2290. doi:10.1016/S0140-6736(12)60283-9
6. Kurihara O, Takano M, Yamamoto M, et al. Impact of prediabetic status on coronary atherosclerosis: a multivessel angioscopic study. Diab Care. 2013;36(3):729–733. doi:10.2337/dc12-1635
7. Drexel H, Aczel S, Marte T, et al. Is atherosclerosis in diabetes and impaired fasting glucose driven by elevated LDL cholesterol or by decreased HDL cholesterol? Diab Care. 2005;28(1):101–107. doi:10.2337/diacare.28.1.101
8. Hirano T. Pathophysiology of Diabetic Dyslipidemia. J Atheroscler Thromb. 2018;25(9):771–782. doi:10.5551/jat.RV17023
9. Chakarova N, Tankova T, Atanassova I, Dakovska L. Serum lipid and hsCRP levels in prediabetes–impaired fasting glucose (IFG) and impaired glucose tolerance (IGT). Diabetes Res Clin Pract. 2009;86(1):56–60. doi:10.1016/j.diabres.2009.04.005
10. Kloppenborg JT, Fonvig CE, Nielsen TRH, et al. Impaired fasting glucose and the metabolic profile in Danish children and adolescents with normal weight, overweight, or obesity. Pediatr Diabetes. 2018;19(3):356–365. doi:10.1111/pedi.12604
11. Riano-Galan I, Fernandez-Somoano A, Rodriguez-Dehli C, Valvi D, Vrijheid M, Tardon A. Proatherogenic lipid profile in early childhood: association with weight status at 4 years and parental obesity. J Pediatr. 2017;187:153–157.e2. doi:10.1016/j.jpeds.2017.04.042
12. Bluher M. Obesity: global epidemiology and pathogenesis. Nat Rev Endocrinol. 2019;15(5):288–298. doi:10.1038/s41574-019-0176-8
13. Grundy SM. Pre-diabetes, metabolic syndrome, and cardiovascular risk. J Am Coll Cardiol. 2012;59(7):635–643. doi:10.1016/j.jacc.2011.08.080
14. Weiss R, Santoro N, Giannini C, Galderisi A, Umano GR, Caprio S. Prediabetes in youth - mechanisms and biomarkers. Lancet Child Adolesc Health. 2017;1(3):240–248. doi:10.1016/S2352-4642(17)30044-5
15. Ng M, Fleming T, Robinson M, et al. Global, regional, and national prevalence of overweight and obesity in children and adults during 1980–2013: a systematic analysis for the Global Burden of Disease Study 2013. Lancet. 2014;384(9945):766–781. doi:10.1016/S0140-6736(14)60460-8
16. Almari M, Alsaedi S, Mohammad A, Ziyab AH. Associations of adiposity and parental diabetes with prediabetes among adolescents in Kuwait: A cross-sectional study. Pediatr Diabetes. 2018;19(8):1362–1369. doi:10.1111/pedi.12780
17. Andes LJ, Cheng YJ, Rolka DB, Gregg EW, Imperatore G. Prevalence of prediabetes among adolescents and young adults in the United States, 2005–2016. JAMA Pediatr. 2019;e194498.
18. Friedewald WT, Levy RI, Fredrickson DS. Estimation of the concentration of low-density lipoprotein cholesterol in plasma, without use of the preparative ultracentrifuge. Clin Chem. 1972;18(6):499–502. doi:10.1093/clinchem/18.6.499
19. Roche Diagnostics International Ltd. Study report from a multicenter evaluation of the new cobas b 101 system for the measurement of HbA1c and lipid panel. Switzerland 2013. Available from: http://www.cobas.roche.it/content/dam/cobas_com/pdf/product/cobas-b-101-system/cobas%20b%20101%20performance%20evaluation%20study%20report_8pg.pdf.
20. Little RR, Rohlfing C, Sacks DB. The national glycohemoglobin standardization program: over 20 years of improving hemoglobin a1c measurement. Clin Chem. 2019;65(7):839–848. doi:10.1373/clinchem.2018.296962
21. Panel on Detection, Evaluation, and Treatment of High Blood Cholesterol in Adults E, Expert Panel on Detection E, Treatment of High Blood Cholesterol in A. Executive summary of the third report of the national cholesterol education program (NCEP) expert panel on detection, evaluation, and treatment of high blood cholesterol in adults (adult treatment panel III). JAMA. 2001;285(19):2486–2497. doi:10.1001/jama.285.19.2486
22. American Diabetes Association. 2. Classification and Diagnosis of Diabetes: standards of Medical Care in Diabetes-2019. Diab Care. 2019;42(Suppl 1):S13–S28. doi:10.2337/dc19-S002
23. de Onis M, Onyango AW, Borghi E, Siyam A, Nishida C, Siekmann J. Development of a WHO growth reference for school-aged children and adolescents. Bull World Health Organ. 2007;85(9):660–667. doi:10.2471/BLT.07.043497
24. Bland JM, Altman DG. The use of transformation when comparing two means. BMJ. 1996;312(7039):1153.
25. Elkum N, Al-Arouj M, Sharifi M, Shaltout A, Bennakhi A. Prevalence of childhood obesity in the state of Kuwait. Pediatr Obes. 2016;11(6):e30–e34.
26. Al Amiri E, Abdullatif M, Abdulle A, et al. The prevalence, risk factors, and screening measure for prediabetes and diabetes among Emirati overweight/obese children and adolescents. BMC Public Health. 2015;15:1298.
27. Kit BK, Kuklina E, Carroll MD, Ostchega Y, Freedman DS, Ogden CL. Prevalence of and trends in dyslipidemia and blood pressure among US children and adolescents, 1999–2012. JAMA Pediatr. 2015;169(3):272–279. doi:10.1001/jamapediatrics.2014.3216
28. Friedland O, Nemet D, Gorodnitsky N, Wolach B, Eliakim A. Obesity and lipid profiles in children and adolescents. J Pediatr Endocrinol Metab. 2002;15(7):1011–1016.
29. Lamb MM, Ogden CL, Carroll MD, Lacher DA, Flegal KM. Association of body fat percentage with lipid concentrations in children and adolescents: united States, 1999–2004. Am J Clin Nutr. 2011;94(3):877–883. doi:10.3945/ajcn.111.015776
30. Tsimihodimos V, Florentin M. Chapter 13 hypertension and dyslipidemia in patients with pre-diabetes: dietary and other therapies. In: Watson RR, Dokken BB, editors. Glucose Intake and Utilization in Pre-Diabetes and Diabetes. Boston: Academic Press; 2015:157–179.
31. Calanna S, Scicali R, Di Pino A, et al. Lipid and liver abnormalities in haemoglobin A1c-defined prediabetes and type 2 diabetes. Nutr Metab Cardiovasc Dis. 2014;24(6):670–676. doi:10.1016/j.numecd.2014.01.013
32. Palmisano BT, Zhu L, Eckel RH, Stafford JM. Sex differences in lipid and lipoprotein metabolism. Mol Metab. 2018;15:45–55. doi:10.1016/j.molmet.2018.05.008
33. Palmer BF, Clegg DJ. The sexual dimorphism of obesity. Mol Cell Endocrinol. 2015;402:113–119. doi:10.1016/j.mce.2014.11.029
34. Gonzalez-Granillo M, Helguero LA, Alves E, et al. Sex-specific lipid molecular signatures in obesity-associated metabolic dysfunctions revealed by lipidomic characterization in ob/ob mouse. Biol Sex Differ. 2019;10(1):11. doi:10.1186/s13293-019-0225-y
35. Regitz-Zagrosek V, Lehmkuhl E, Weickert MO. Gender differences in the metabolic syndrome and their role for cardiovascular disease. Clin Res Cardiol. 2006;95(3):136–147. doi:10.1007/s00392-006-0351-5
36. Woudberg NJ, Goedecke JH, Blackhurst D, et al. Association between ethnicity and obesity with high-density lipoprotein (HDL) function and subclass distribution. Lipids Health Dis. 2016;15:92. doi:10.1186/s12944-016-0257-9
37. Collins R, Armitage J, Parish S, Sleigh P, Peto R. Heart Protection Study Collaborative G. MRC/BHF heart protection study of cholesterol-lowering with simvastatin in 5963 people with diabetes: a randomised placebo-controlled trial. Lancet. 2003;361(9374):2005–2016.
38. Lenters-Westra E, Slingerland RJ. Three of 7 hemoglobin A1c point-of-care instruments do not meet generally accepted analytical performance criteria. Clin Chem. 2014;60(8):1062–1072. doi:10.1373/clinchem.2014.224311
39. Yu HJ, Lim S, Kwon MJ, Woo HY, Park H. Evaluation of cobas b 101 HbA1c analyzer performance for point-of-care testing. Lab Med Online. 2017;7(4):182–188. doi:10.3343/lmo.2017.7.4.182
40. Wells S, Rafter N, Kenealy T, et al. The impact of a point-of-care testing device on CVD risk assessment completion in New Zealand primary-care practice: A cluster randomised controlled trial and qualitative investigation. PLoS One. 2017;12(4):e0174504. doi:10.1371/journal.pone.0174504
41. Nordestgaard BG, Langsted A, Mora S, et al. Fasting is not routinely required for determination of a lipid profile: clinical and laboratory implications including flagging at desirable concentration cut-points-a joint consensus statement from the European Atherosclerosis Society and European Federation of Clinical Chemistry and Laboratory Medicine. Eur Heart J. 2016;37(25):1944–1958. doi:10.1093/eurheartj/ehw152
42. Steiner MJ, Skinner AC, Perrin EM. Fasting might not be necessary before lipid screening: a nationally representative cross-sectional study. Pediatrics. 2011;128(3):463–470. doi:10.1542/peds.2011-0844
43. Langsted A, Nordestgaard BG. Nonfasting versus fasting lipid profile for cardiovascular risk prediction. Pathology. 2019;51(2):131–141. doi:10.1016/j.pathol.2018.09.062
44. Mora S, Chang CL, Moorthy MV, Sever PS. Association of nonfasting vs fasting lipid levels with risk of major coronary events in the anglo-scandinavian cardiac outcomes trial-lipid lowering arm. JAMA Intern Med. 2019;179(7):898–905. doi:10.1001/jamainternmed.2019.0392
 © 2021 The Author(s). This work is published and licensed by Dove Medical Press Limited. The
full terms of this license are available at https://www.dovepress.com/terms
and incorporate the Creative Commons Attribution
- Non Commercial (unported, 3.0) License.
By accessing the work you hereby accept the Terms. Non-commercial uses of the work are permitted
without any further permission from Dove Medical Press Limited, provided the work is properly
attributed. For permission for commercial use of this work, please see paragraphs 4.2 and 5 of our Terms.
© 2021 The Author(s). This work is published and licensed by Dove Medical Press Limited. The
full terms of this license are available at https://www.dovepress.com/terms
and incorporate the Creative Commons Attribution
- Non Commercial (unported, 3.0) License.
By accessing the work you hereby accept the Terms. Non-commercial uses of the work are permitted
without any further permission from Dove Medical Press Limited, provided the work is properly
attributed. For permission for commercial use of this work, please see paragraphs 4.2 and 5 of our Terms.