Back to Journals » Cancer Management and Research » Volume 13
OATP1B3 Expression in Hepatocellular Carcinoma Correlates with Intralesional Gd-EOB-DTPA Uptake and Signal Intensity on Gd-EOB-DTPA-Enhanced MRI
Authors Zhou X, Long L, Mo Z ![]() , Li Y
, Li Y
Received 19 November 2020
Accepted for publication 5 January 2021
Published 9 February 2021 Volume 2021:13 Pages 1169—1177
DOI https://doi.org/10.2147/CMAR.S292197
Checked for plagiarism Yes
Review by Single anonymous peer review
Peer reviewer comments 2
Editor who approved publication: Professor Seema Singh
Xiaojiao Zhou, Liling Long, Zhiqing Mo, Yajuan Li
Department of Radiology, The First Affiliated Hospital of Guangxi Medical University, Nanning, 530021, People’s Republic of China
Correspondence: Liling Long
Department of Radiology, The First Affiliated Hospital of Guangxi Medical University, Nanning, 530021, People’s Republic of China
Tel +86 13807712604
Email [email protected]
Background: To evaluate the predictive value of the OATP1B3 expression in hepatocellular carcinoma (HCC) for the gadolinium ethoxybenzyl-diethylenetriaminepentaacetic acid (Gd-EOB-DTPA) uptake and the signal intensity (SI) in the hepatobiliary (HB) phase.
Methods: In this retrospective study, we analyzed 69 liver nodules of 64 patients who underwent Gd-EOB-DTPA enhancement magnetic resonance imaging (MRI) before operation. Based on the SI in the HB phase, the patients were categorized into the hypointense HCC and iso- or hyperintense HCC groups. The OATP1B3 expression was detected by polymerase chain reaction (PCR) and immunohistochemistry. The differences between the expression of OATP1B3 and Gd-EOB-DTPA enhanced magnetic resonance imaging between the two groups of hepatocellular carcinoma were compared. The relationship between the OATP1B3 expression and the SI and relative enhancement (RE) was analyzed.
Results: The examined HCC nodules were 59 hypointense HCC and 10 iso- or hyperintense. The relative expressions of OATP1B3, HB-phase signal, and the RE of the HB phase in iso- or hyperintense were significantly higher than those of the hypointense HCC, while the RE of the HB phase increased with an increase in the OATP1B3 expression (P < 0.05).
Conclusion: The OATP1B3 expression in HCC can predict the uptake of Gd-EOB-DTPA and the SI of the HB phase. We believe that the evaluation of OATP1B3 expression will facilitate the comprehension of imaging performance of HCC in Gd-EOB-DTPA-enhanced MRI.
Keywords: carcinoma, hepatocellular, gadolinium ethoxybenzyl DTPA, magnetic resonance imaging, OATP1B3
Introduction
Hepatocellular carcinoma (HCC) is one of the most common tumors in the world and the second-leading cause of cancer-related mortality.1 Past studies have shown that the occurrence of liver cancer is closely related to chronic liver diseases, such as chronic hepatitis B, chronic hepatitis C, and alcoholic cirrhosis.2,3 The formation of HCC is a multistep process that first evolves from the regenerative nodules (RN) to atypical proliferative nodules (DN), and, eventually, into small HCCs (SHCC).4,5 The expression and transport functions of organic anion transporters are modified in liver diseases, because of which they have different manifestations in the imaging.
Gd-EOB-DTPA is a hepatobiliary (HB)-specific contrast agent that not only possess the characteristics of non-cellular, specific external contrast agents but also those of hepatocyte-specific contrast agents.6,7 After administering an intravenous injection, approximately 50% of the Gd-EOB-DTPA was taken up by organic anion transport protein (OATP) on the liver cell membrane and then passed through multidrug resistance proteins (MRPs) and excreted into the biliary system.8 Because of these features, Gd-EOB-DTPA adds substantial information during the hepatobiliary (HB) phase, which improves the detection of focal liver lesions and diffuse liver disease.8,9 Past studies have demonstrated that Gd-EOB-DTPA-enhanced MRI has higher sensitivity in the detection of HCC than dynamic computed tomography (CT) and gadopentetate dimeglumine-enhanced MRI.10,11 Enhanced CT, MRI and enhanced contrast-enhanced ultrasound (CEUS) can be applied as the primary inspection method for evaluating the intrahepatic focal lesions, but Gd-EOB-DTPA enhanced MRI HB stage remains the only imaging method that can accurately detect early SHCC.12–15 Gd-EOB-DTPA-enhanced MRI provides more accurate information for characterizing and staging HCC that can facilitate the selection of accurate treatment strategy.16,17
OATP1B3 is an uptake transporter located on the sinusoidal surface of the liver cell membrane and the main uptake transporter of SI in the HB phase.18–20 According to past reports, the OATP1B3 expression in HCC is significantly related to the RE of the HB phase.21 Most HCCs demonstrate low SI in the HB phase, while a few well-differentiated HCCs demonstrate equal or slightly higher SI.22,23,24 In the process of carcinogenesis from RN to HCC, the expression of OATP1B3 decreases with the progress of liver cancer and the signal of hepatobiliary phase also decreases; OATP1B3 is the main transporter that determines the level of HB-phase signals We therefore speculated whether detecting the level of OATP1B3 expression can help predict the uptake of Gd-EOB-DTPA by hepatocytes and its relationship with the level of the HB-phase signals.
This study aimed to elucidate the prediction of Gd-EOB-DTPA uptake in liver cancer with a chronic liver disease background and the relationship between OATP1B3 expression and the level of the HB-phase SI .
Materials and Methods
Patients
This retrospective analyses were conducted with the approval of the ethics committee (This study was conducted in accordance with the Declaration of Helsinki, First Affiliated Hospital of Guangxi Medical University Ethics Review Committee, Approval Number: 2020 (KY-E-123)), and the relevant MRI of all patients was obtained with prior-informed consent. Between April 2019 and February 2020, our hospital undertook 82 cases of HCC, excluding 9 patients who did not undergo Gd-EOB-DTPA-enhanced MRI examination, 9 with a history of liver cancer, and those with a history of treatment including radiofrequency ablation and transarterial embolization. Therefore, we focused on 69 HCCs in 64 patients who were surgically resected at our institution from the study subjects. The average age of the entire study group ranged 16–76 years, male: 52 cases, female: 12 cases, male:female: 52:12. There were 56 cases of chronic hepatitis B, 3 of chronic hepatitis C, 2 of chronic hepatitis B combined with chronic hepatitis C, and 3 of alcoholic cirrhosis. 58 patients had a history of antiviral therapy, and 6 patients had not.All patients retained liver functions, and all patients with cirrhosis were classified as Grade A cirrhosis as per the Child classification (Table 1).
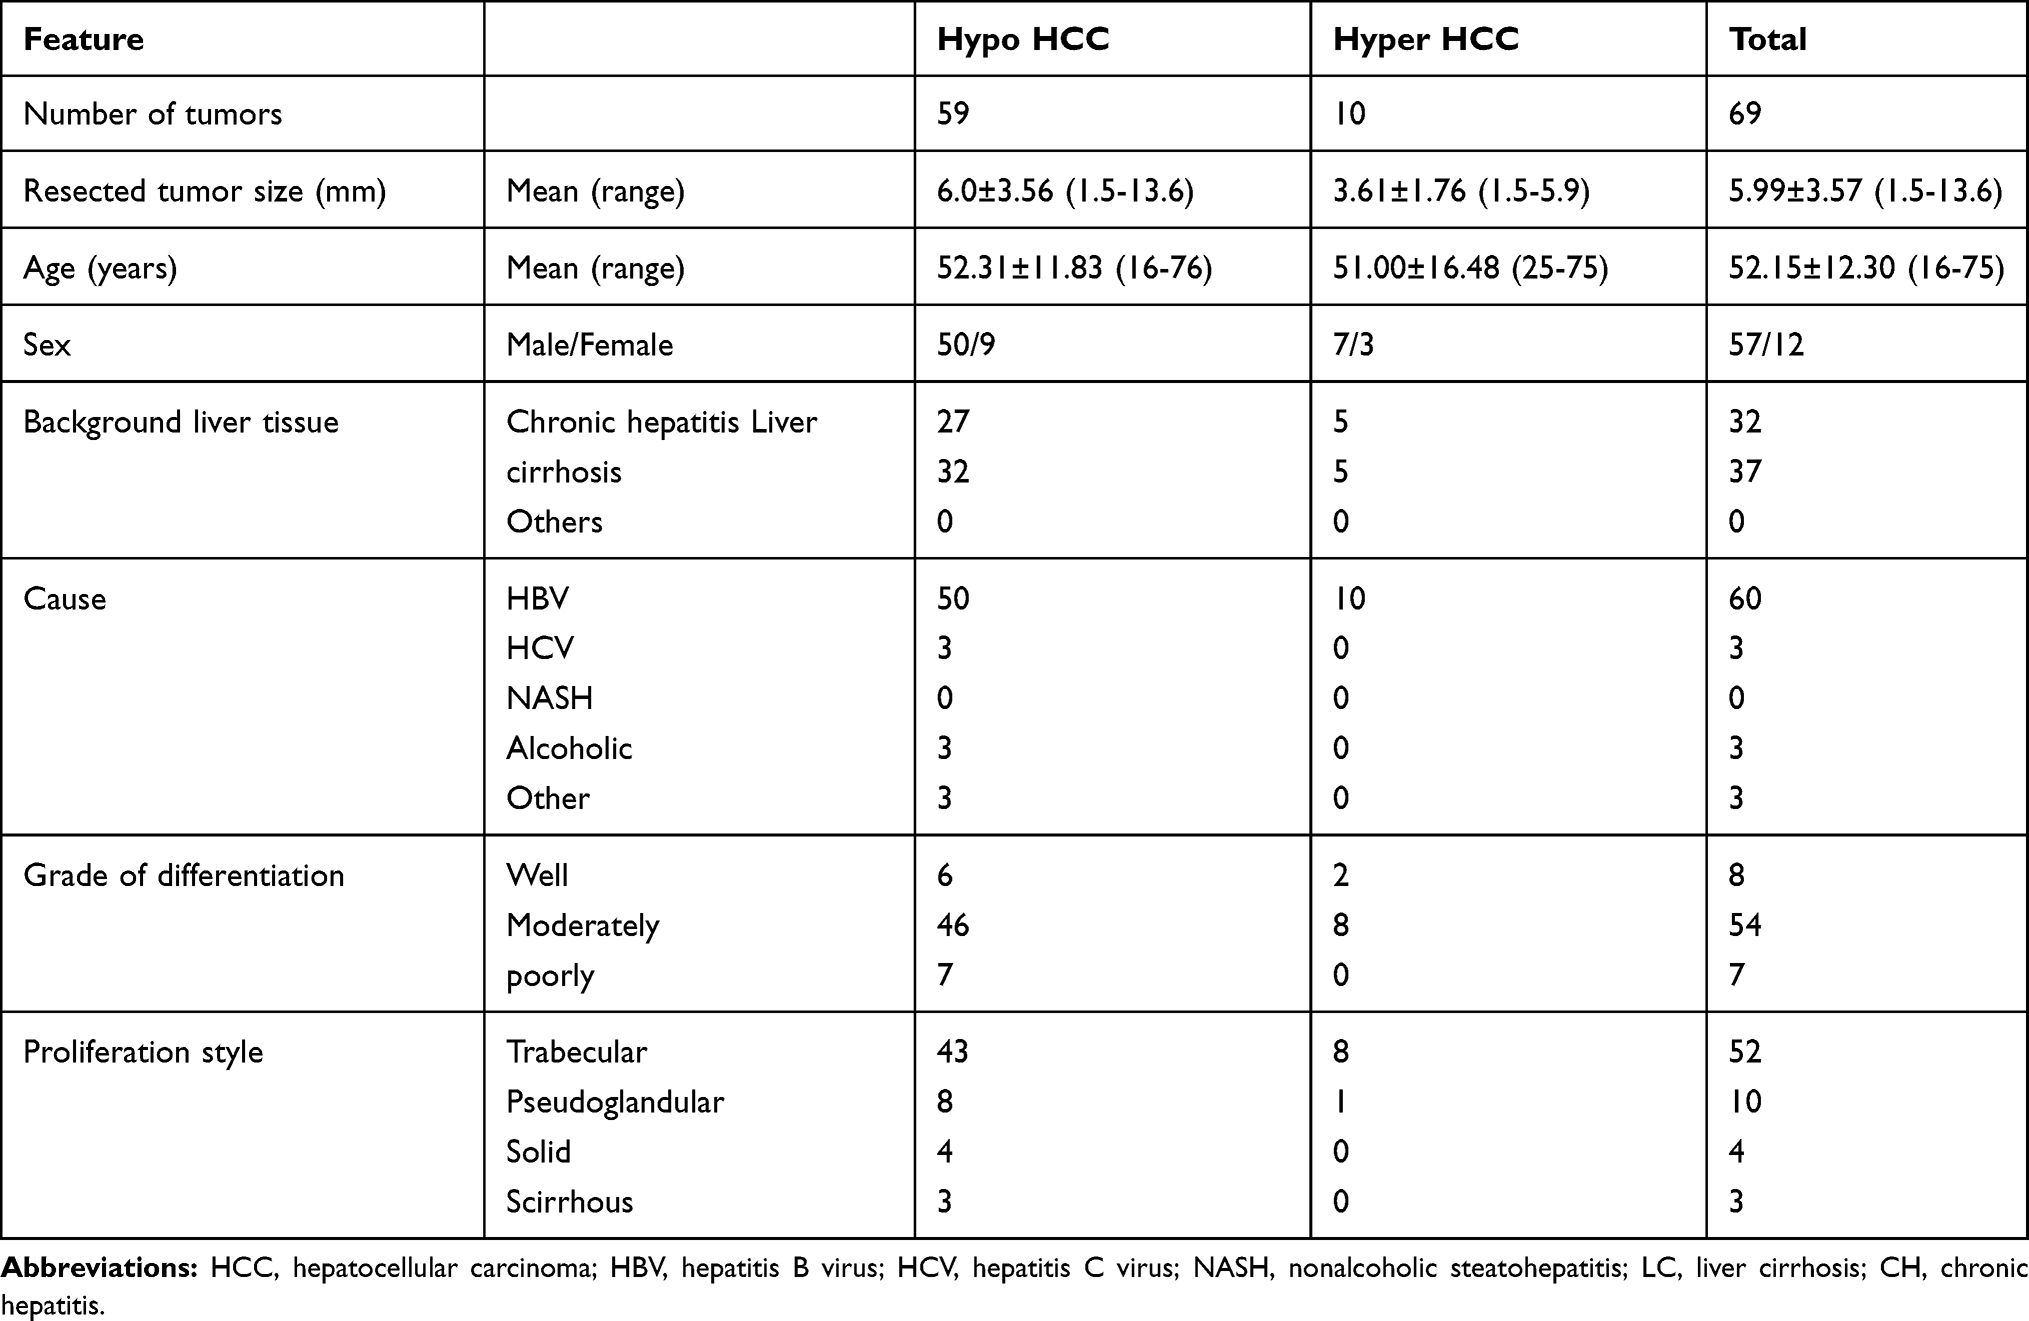 |
Table 1 Clinicopathological Features of the Study Patients |
Gd-EOB-DTPA MRI
All patients underwent plain liver scan and Gd-EOB-DTPA (Bayer Healthcare Co., Ltd., Germany)-enhanced MRI examination with the Magnetom Verio 3.0 T MR scanner (German Siemens) equipped with an 8-channel body-phased array coil 1 month before their surgeries. Gd-EOB-DTPA was injected through the anterior cubital vein at a flow rate of 2 mL/s and at a dosage of 0.025 mmol/kg. Next, 20 mL of normal saline was injected at the same flow rate for flushing. The scanning sequence and the parameters included the following: coronal T2WI (TR 1800.00 ms, TE 95.00 ms) and half Fourier single excitation fast spin echo axial T2WI (TR 2930.00 ms, TE 89.00 ms) with the blade technology for axial fat suppression Sequence T2WI (TR 2930.00 ms, TE 89.00 ms), and reversal angle 133; three-dimensional (3D) reversal recovery fast gradient echo T1WI (TR 171.00 ms, TE 2.31 ms; FOV 350 mm × 350 mm, matrix 224 × 320, layer thickness 6.0 mm, layer spacing 1.2 mm). Scans were performed in the arterial, portal vein, equilibrium, and HB phases at 14 s, 40 s, 120 s, and 20 min after the injection of the contrast medium.
Image Analysis
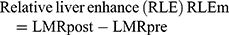
All patient images were uploaded to the image software and submitted to the Siemens Syngo workstation in Germany, where the images were analyzed by 2 experienced radiologists. In the dynamic-enhancement and HB phases, the region of interest (ROI) was placed to measure the SI (SLtum) at the same level, same location, and the same size of the tumor, the surrounding background liver SI (SIliv), and the right erector spinae on the same level (SIm); all the variables were measured thrice and then averaged. The diameter of the ROI was 10–20 mm, which should not exceed the scope of the lesion while avoiding the large blood vessels. The degree of SI enhancement was calculated at each stage of dynamic enhancement and the HB phase and the liver–muscle ratio (LMR) of the liver and erector spinae using the following formulae:


Classification of HCCs in the HB Phase of Gd-EOB-DTPA MR Imaging
According to the signal level of the HB phase, the lesions were categorized into 2 types: hypointense HCC and iso- or hyperintense HCC. The hypointense HCC HB phase showed low SI relative to the surrounding liver parenchyma (SItum/SIliv <1) (Figure 1), while the iso- or hyperintense HCC HB phase showed equal or high SI relative to the surrounding liver parenchyma (SItum/SIliv ≥1) (Figure 1). In this study, all HCCs demonstrated low SI before the enhancement, indicating that HCC that showed equal or high SI in the HB phase was enhanced in the HB phase.
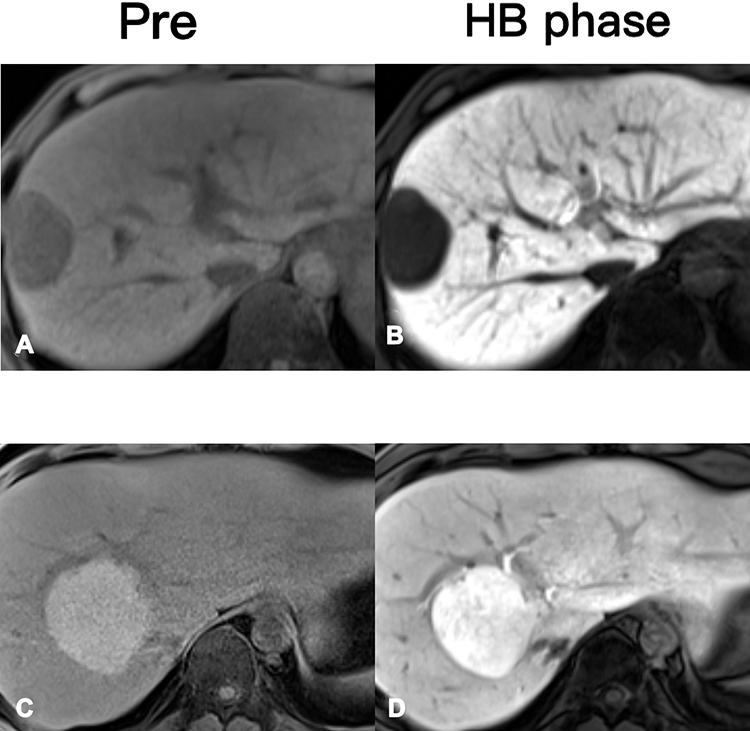 |
Figure 1 (A and B) show images from the pre-enhancement and the HB phases (20 min after injection of the contrast agent) for a 56-year-old male patient. The HB phase is hypointense. (C and D) The images of a 40-year-old male patient at the pre-enhancement and HB stages. The HB stage showing iso- or hyperintense images. |
Pathological Diagnosis
HE staining was performed on 69 HCC specimens collected during the surgeries. Two experienced pathologists conducted the diagnosis with reference to the WHO classification system and the international liver cancer consensus group, which were divided into three categories: well-differentiated, moderately differentiated, and poorly differentiated (Figure 2). Next, liver cancer was categorized into 4 types of proliferation: trabecular, pseudoglandular, scirrhous, and solid (Table 1).
 |
Figure 2 (A) WD HCC, (B) MD HCC, and (C) PD HCC. Abbreviations: WD, well-differentiated; MD, moderately differentiated; PD, poorly differentiated. |
RT-PCR Analysis
Pairs of liver cancer tissue specimens and the corresponding normal tissue specimens adjacent to the cancer tissues were collected from 64 patients and subjected to RT-PCR in order to detect the OATP1B3 expression. The collected fresh specimens were placed in RNA protection solution and frozen at −80°C or used directly for RNA extraction while strictly following the Trizol (Invitrogen) extraction method for total RNA. Next, spectrophotometer was used to estimate the content and purity of the extract and a RT kit was used to perform RT on the extracted RNA, followed by freezing the obtained cDNA sample at −20°C or using it for RT-PCR analyses. GAPDH was used as the housekeeping gene with the following primer set of OATP1B3: forward ATGAAGTGGTCCACCAACAGC, reverse AAGCCCAAGTAGACCCTTCC. The SYBR Primescript miRNA RT-PCR Kit was used for PCR amplification. The sample was then analyzed according to the real-time amplification curve and dissolution curve to obtain the Ct value. The expression of the gene OATP1B3 in the liver cancer tissues was found to be relative to that of the adjacent tissues, as calculated using the following formula:

whereCtca = Ctca-CtGAPDH Ctcaliv = Ctcaliv- CtGAPDH. The relationship between the OATP1B3 expression and Gd-EOB-DTPA-enhanced MRI HB SI was analyzed.
Immunohistochemical Analyses
All liver cancer tissues and background liver tissues excised via surgery were preserved in the form of paraffin-embedded blocks, and the antigenicity was preserved for immunohistochemical staining. The primary antibody against human OATP1B3 (anti-SLCO1B3/OATP1B3 antibody) was employed to perform OATP1B3 immunohistochemical staining on all nodule specimens. We employed a semi-quantitative method to evaluate the expression intensity of OATP1B3 on the membrane of HCC cells relative to that on normal hepatocytes in the surrounding tissues, using the following grade pattern: 0, no expression; 1, decreased expression; 2, equal expression; and 3, increased expression.
Statistical Analysis
The SPSS23.0 software was used to perform statistical data analyses, and the measured data were expressed as x ± s. Unpaired t-test was used for the analyses of clinical features and RT-PCR results, while Fisher’s exact test was used for clinical and histological feature analyses. The correlation between the degree of expression of OATP1B3 and the enhancement rate by immunohistochemistry was analyzed by one-way analysis of variance (ANOVA) and post hoc tests. Pearson correlation test was performed to evaluate the correlation between RT-PCR and HB enhancement rate. P < 0.05 was considered to be statistically significant.
Results
Clinicopathological Characteristics of Liver Cancer in Different Signal Groups
Based on the signal level of the HB stage, we categorized the HCC cases into 2 groups: high-signal (n = 10) and low-signal (n = 59). None of these two groups showed any significant clinical differences (P < 0.05). In the HB stage of iso- or hyperintense HCC group, the differentiation status was high differentiation (n = 2), moderate differentiation (n = 8), and poor differentiation (n = 0). In the hypointense HCC group at the HB stage, the differentiation cases were well-differentiated (n = 6), moderately differentiated (n = 46), and poorly differentiated (n = 7) (Figure 3).
 |
Figure 3 Graph showing tumor differentiation. The hypointense HCCs (hypo) consisted of well- differentiated (n = 6), moderately differentiated (n = 46), and poorly differentiated HCCs (n = 7), while 80% (n = 8) of hyperintense HCCs (iso/hyper) were moderately differentiated. |
HB Enhancement Rate in Different Signal Groups
The normal hepatic parenchyma demonstrated high signal at the HB stage. The RE of peripheral hepatic parenchyma in this study was 1.52 ± 0.67 in 69 HCC. The average enhancement rate of HCC in 10 cases of the iso- or hyperintense group was 1.70 ± 0.53 and in 59 cases of hypointense group was 0.31 ± 0.33 (P < 0.05). The enhancement rate of the high-signal group was significantly higher than that of the low-signal group (P < 0.05).
Expression of OATP1B3 results of RT-PCR
OATP1B3 is continuously expressed in the liver background. We compared the expression of OATP1B3 in the hypointense HCC and iso- or hyperintense HCC. The expression in the iso- or hyperintense group was 2.30 ± 1.17, and the expression in the hypointense group was 0.06 ± 0.09 (P<0.01) (Figure 4) In the 10 cases of iso- or hyperintense group, the expression of OATP1B3 was equal to or greater than that of the background liver. In one case, the expression of OATP1B3 was the highest in the well-differentiated liver cancer tissues, while the degree of HB phase enhancement was also the highest. In the 59 cases of the hypointense group, the expression of OATP1B3 was lower than that of the background liver (P < 0.05).
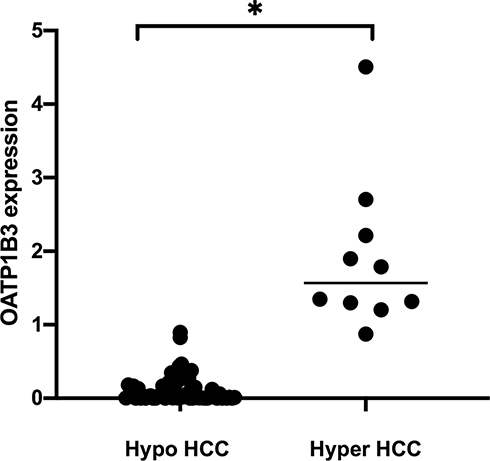 |
Figure 4 The expression of OATP1B3 at different signal intensities of the 2 groups. The expression in the iso- or hyperintense groups is significantly higher than that in the hypointense group (*P < 0.05). |
The RE in the HB phase was significantly related to the expression of OATP1B3. As the expression of OATP1B3 increased, the RE in the HB phase also increased (R = 0.74, P < 0.01) (Figure 5).
 |
Figure 5 The relationship between the expression of transporter OATP1B3 and the enhancement rate (RE) in the HB phase. We found that the OATP1B3 expression was proportional to the RE in the HB phase. As the OATP1B3 expression increased, the enhancement rate in the RE phase also increased (R = 0.747, P < 0.01). |
Immunohistochemistry Results of OATP1B3 Expression
Analyses of liver cancer and the corresponding surrounding liver tissues revealed that OATP1B3 was uniformly distributed in the background liver cell membrane and continuously expressed in the background liver tissue. In the iso- or hyperintense group, 8 cases had OATP1B3 expression level 3 and 2 case was 2; in the hypointense group, 1 case OATP1B3 expression level was 3, 5 cases were 2, 21 cases were 1, and 32 cases were 0 (Figure 6). We observed that the OATP1B3 expression in the hypointense group was significantly lower than that in the corresponding background liver, while the OATP1B3 expression in the high-signal group was equal to or greater than that of the surrounding background liver, As the expression of OATP1B3 increased, the RE of the HB phase also increased (P < 0.05) (Figures 7 and 8).
 |
Figure 6 A bar graph showing the results of semiquantitative analysis of the immunohistochemistry of OATP1B3 (*P < 0.05). |
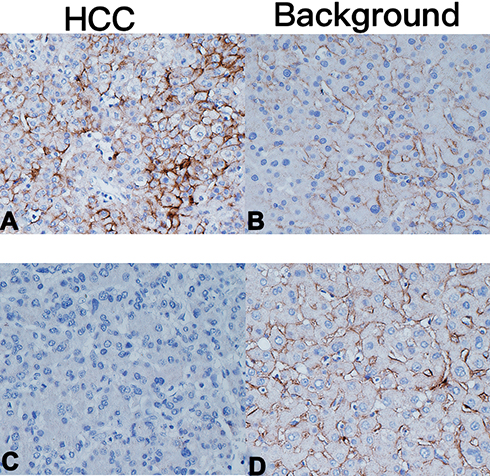 |
Figure 7 (A and B) An HCC patient with iso- or hyperintense images at the HB stage. The expression of OATP1B3 is significantly higher than that of the background liver. (C and D) An HCC patient with hypointense images at the HB stage. The expression of OATP1B3 in HCC is basically not expressed and is significantly lower than that of the background liver. |
 |
Figure 8 The relationship between the expression of transporter OATP1B3 and the RE of the HB phase. The expression of OATP1B3 relative to that in background liver was significantly related to the SI of the HB phase. As the expression of OATP1B3 increased, the RE of the HB phase also increased (P < 0.05). |
Discussion
Gd-EOB-DTPA is a HB-specific contrast agent that is of particular importance in the detection of liver cancer.25 Kitao et al.21 reported that, in HCC, Gd-EOB-DTPA is mainly ingested through OATP1B3 located on the liver cell membrane, which is then excreted through MRP3. However, the excretion rate may be slower than the uptake rate at the HB stage; therefore, the main factor of the signal level at the HB stage may be the uptake protein.26,27 Therefore, the evaluation of the expression of OATP1B3 in HCC could help predict the relationship between its uptake of Gd-EOB-DTPA and its HB signaling.
Most HCCs showed low signal in the Gd-EOB-DTPA-enhanced MRI at the HB stage, and only a few cells showed iso-signal or high signal.16,28,29 In this study, we compared the levels of HB-phase signals and their RE in the two HCC groups based on the chronic liver background. The HB-phase RE of the iso- or hyperintense group was significantly higher than that of the hypointense signal group. Kitao et al.21,30,31 reported that, with the progress of HCC, its degree of differentiation gradually decreases along with a decrease in the expression of OATP1B3, as a result of which, the signal in the HB stage also decreases. In our current study, the iso- or hyperintense group basically represents moderately differentiated liver cancer, while the hypointense group represents high, medium, and poorly differentiated groups. However, the relationship between OATP1B3 expression and the degree of differentiation of HCC needs further verification by employing more number of cases in the future.
In the two groups analyzed in this study, the results of RT-PCR and immunohistochemistry demonstrated that the expression of OATP1B3 in the iso- or hyperintense groups was higher than or equal to the expression in the surrounding liver tissues, while the expression of OATP1B3 in the hypointense group was lower than that in the surrounding background liver tissues. The OATP1B3 expression in the iso- or hyperintense group was significantly higher than that in the hypointense group, and the HB stage RE of the corresponding high-signal group was also significantly higher than that of the low-signal group. These results were in conformance to those of Miura et al.,16,32 as they also reported that the HB-phase signal in HCC increased with an increase in the OATP1B3 expression. According to the authors, the signal of HB stage in HCC patients with high OATP1B3 expression on the hepatocyte membrane was also higher than that in the liver tissue background. OATP1B3 is the main transport intake protein of Gd-EOB-DTPA; therefore, we speculated that the OATP1B3 expression can predict the intake of Gd-EOB-DTPA and that it is significantly related to the SI of the HB stage. Larger sample size should be analyzed in the future for a more thorough analysis of the predictive value of OATP1B3 expression for HB SI and for the prediction of benign and malignant liver cancers.
Fukusato et al.19,22,33,34 reported that the decreased expression of OATP1B3 in HCC was related to the increased expression of hepatocyte nuclear factor (HNF)-3β, while the high expression of OATP1B3 was related to the co-activation of nuclear β-catenin and mature hepatocyte-related pathway HNF-4α. The modification of these factors could have alterations in the expression of OATP1B3, as a result of which the SI and RE exhibited in the HB phase also changed accordingly. Gd-EOB-DTPA-enhanced MRI is gaining popularity as an important tool for the in detection and characterization of HCC and benign hepatocellular nodules, including focal nodular hyperplasia (FNH), nodular regenerative hyperplasia (NRH), hepatocellular adenoma (HCA), and DN. In these benign hepatocellular nodules, there exists a positive correlation between the OATP1B3 expression and SI of the HB phase.20,35 For instance, Amedeo et al. reported that the tissue expression of OATP1B3 in FNH and HCA subtypes correlated with the signal intensity observed on HBP of Gd-EOB-DTPA- enhanced MRI.
We identified some limitations in our research. First, past studies have shown that, in addition to OATP1B3, Gd-EOB-DTPA, OATP1B1, and NTCP also act as transporters. We should have also used the same method to evaluate the expression of OATP1B1 and NTCP. Second, we only studied the uptake transporter OATP1B3 and did not evaluate the excretion transporter. The excretion protein can also affect the enhancement rate of HB signal to a certain extent, indicating that we should also evaluate the excretion protein. Finally, the amount of sample processed was small, with insufficient cases of HB-stage high-signal liver cancers, because the HB-stage high-signal tumors are relatively rare. Moreover, we believe that the data obtained from the study are sufficient to support the concept we have proposed.
In conclusion, the expression of OATP1B3 in HCC could predict the uptake of Gd-EOB-DTPA, and it was significantly related to the signal intensity and the enhancement rate of the HB phase. As the expression of OATP1B3 increased, the uptake of Gd-EOB-DTPA also increased in parallel with an increase in the SI and enhancement rate in the HB phase. The evaluation of OATP1B3 expression is expected to facilitate the comprehension of imaging performance of HCC in Gd-EOB-DTPA-enhanced MRI.
Data Sharing Statement
The data used to support the findings of this study are available from the corresponding author upon a reasonable request.
Funding
This study was supported by grants from the National Natural Science Foundation of China, Grant Number: 82060310.
Disclosure
The authors declare no competing interests.
References
1. Tang A, Hallouch O, Chernyak V, Kamaya A, Sirlin CB. Epidemiology of hepatocellular carcinoma: target population for surveillance and diagnosis. Abdom Radiol. 2018;43(1):13–25. doi:10.1007/s00261-017-1209-1
2. Petruzziello A. Epidemiology of Hepatitis B Virus (HBV) and Hepatitis C Virus (HCV) related hepatocellular carcinoma. Open Virol J. 2018;12(Suppl–1, M3):26–32. doi:10.2174/1874357901812010026
3. Johnson PJ. How do mechanisms of hepatocarcinogenesis (HBV, HCV, and NASH) affect our understanding and approach to HCC?. Am Society Clin Oncol Educational Book. 2013;2013:132–136. doi:10.14694/EdBook_AM.2013.33.e132
4. Narsinh KH, Cui J, Papadatos D, et al. Hepatocarcinogenesis and LI-RADS. Abdominal Radiol. 2018;43:1–11. doi:10.1007/s00261-017-1386-y
5. Wei WU, Min-Hua C, Maryellen S, et al. Contrast-enhanced ultrasound of hepatocarcinogenesis in liver cirrhosis. Chinese Medical Journal (English version). 2012;125(017):3104–3109.
6. Zech CJ, Herrmann KA, Reiser MF, et al. MR imaging in patients with suspected liver metastases: value of liver-specific contrast agent Gd-EOB-DTPA. Magnetic Resonance Med Ences. 2007;6(1):43–52. doi:10.2463/mrms.6.43
7. Granito A, Galassi M, Piscaglia F, et al. Impact of gadoxetic acid (Gd-EOB-DTPA)-enhanced magnetic resonance on the non-invasive diagnosis of small hepatocellular carcinoma: a prospective study. Aliment Pharmacol Ther. 2013;37(3):355–363. doi:10.1111/apt.12166
8. Leonhardt M, Keiser M, Oswald S, et al. Hepatic uptake of the magnetic resonance imaging contrast agent Gd-EOB-DTPA: role of human organic anion transporters. Drug Metabol Disposition. 2010;38(7):1024–1028. doi:10.1124/dmd.110.032862
9. Verloh N, Haimerl M, Zeman F, et al. Assessing liver function by liver enhancement during the hepatobiliary phase with Gd-EOB-DTPA-enhanced MRI at 3 Tesla. Eur Radiol. 2014;24(5):1013–1019. doi:10.1007/s00330-014-3108-y
10. Chung YE, Kim MJ, Kim YE, et al. Characterization of incidental liver lesions: comparison of multidetector CT versus Gd-EOB-DTPA-enhanced MR imaging. PLoS One. 2013;8.
11. Fujinaga Y, Ohya A, Matsushita T, et al. Effect of hepatobiliary uptake of Gd-EOB-DTPA on the hepatic venous phase of dynamic magnetic resonance imaging on a 3.0-T apparatus: comparison between Gd-EOB-DTPA and Gd-DTPA. Jpn J Radiol. 2011;29(10):695–700. doi:10.1007/s11604-011-0615-5
12. Furlan A, Marin D, Cabassa P, et al. Enhancement pattern of small hepatocellular carcinoma (HCC) at contrast-enhanced US (CEUS), MDCT, and MRI: intermodality agreement and comparison of diagnostic sensitivity between 2005 and 2010 American Association for the Study of Liver Diseases (AASLD) guidelines. Eur J Radiol. 2012;81(9):2099–2105. doi:10.1016/j.ejrad.2011.07.010
13. Avinash R, Kambadakon, et al. LI-RADS technical requirements for CT, MRI, and contrast-enhanced ultrasound. Abdominal Radiol. 2017.
14. Sano K, Ichikawa T, Motosugi U, et al. Imaging study of early hepatocellular carcinoma:usefulness of gadoxetic acid-enhanced MR imaging[J]. International Journal of Medical Radiology. 2012;261(3):834–844..
15. Rhee H, Kim MJ, Park YN, et al. Gadoxetic acid -enhanced MRI findings of early hepatocellular carcinoma as defined by new histologic criteria. J Magn Reson Imaging. 2012;35:393–398. doi:10.1002/jmri.22828
16. Toyoda H, Kumada T, Tada T, et al. Non-hypervascular hypointense nodules on Gd-EOB-DTPA-enhanced MRI as a predictor of outcomes for early-stage HCC. Hepatol Int. 2015;9(1):84–92. doi:10.1007/s12072-014-9553-5
17. Fu J, Zhao J, Zhang X, et al. Staging hepatocellular carcinoma with gadolinium-ethoxybenzyl diethylenetriaminepentaacetic acid -enhanced magnetic resonance imaging: a comparison with multi-detector row computed tomography. OMICS J Radiol. 2015;4. doi: 10.4172/2167-7964.1000e133
18. Pastor CM, Mullhaupt B, Stieger B. The role of organic anion transporters in diagnosing liver diseases by magnetic resonance imaging. Drug Metab Dispos. 2014;42(4):675. doi:10.1124/dmd.113.055707
19. Fukusato T, Soejima Y, Kondo F, et al. Preserved or enhanced OATP1B3 expression in hepatocellular adenoma subtypes with nuclear accumulation of β-catenin. Hepatol Res. 2015;45(10):E32–E42. doi:10.1111/hepr.12453
20. Kitao A, Matsui O, Yoneda N, et al. The up take transporter OATP8 expression decreases during multistep hepatocarcinogenesis: correlation with gadoxetic acid enhanced MR imaging. Eur Radiol. 2011;21(10):2056–2066. doi:10.1007/s00330-011-2165-8
21. Kitao A, Zen Y, Matsui O, et al. Hepatocellular carcinoma: signal intensity at gadoxetic acid-enhanced MR Imaging–correlation with molecular transporters and histopathologic features. Int J Med Radiol. 2010;256(3):817.
22. Kitao A, Matsui O, Yoneda N, et al. Gadoxetic acid enhanced magnetic resonance imaging reflects co-activation of β-catenin and hepatocyte nuclear factor 4α in hepatocellular carcinoma. Hepatol Res. 2017;48(Suppl 19):205–216. doi:10.1111/hepr.12911
23. Kitao A, Matsui O, Yoneda N, et al. Hepatocellular carcinoma with β-catenin mutation: imaging and pathologic characteristics. Radiology. 2015;275(3):708–717. doi:10.1148/radiol.14141315
24. Narita M, Hatano E, Arizono S, et al. Expression of OATP1B3 determines uptake of Gd-EOB-DTPA in hepatocellular carcinoma. J Gastroenterol. 2009;44(7):793–798.
25. Beers BEV, Pastor CM, Hussain HK. Primovist, Eovist: what to expect?. J Hepatol. 2012;57:2.
26. Narita M, Hatano E, Arizono S, et al. Expression of OATP1B3 determines uptake of Gd-EOB-DTPA in hepatocellular carcinoma. J Gastroenterol. 2009;44(7):793–798. doi:10.1007/s00535-009-0056-4
27. Doi N, Tomiyama Y, Kawase T, et al. Focal nodular hyperplasia-like nodule with reduced expression of organic anion transporter 1b3 in alcoholic liver cirrhosis. Internal Med. 2011;50(11):1193. doi:10.2169/internalmedicine.50.4637
28. Ichikawa T, Sano K, Morisaka H. Diagnosis of pathologically early HCC with EOB-MRI: experiences and current consensus. Liver Cancer. 2014;3(2):97–107. doi:10.1159/000343865
29. Saitoh T, Sato S, Yazaki T, et al. Progression of hepatic hypovascular nodules with hypointensity in the hepatobiliary phase of Gd-EOB-DTPA-enhanced MRI in hepatocellular carcinoma cases. Internal Med. 2018;57:2. doi:10.2169/internalmedicine.8801-16
30. Kitao A, Matsui O, Yoneda N, et al. The uptake transporter of Gd-EOB-DTPA (OATP8) expression decreases during hepatocarcinogenesis[C]//Radiological Society of North America 2010 Scientific Assembly and Annual Meeting. 2010.
31. Kitao A, Matsui O, Yoneda N, et al. Gadoxetic acid-enhanced MR imaging for hepatocellular carcinoma: molecular and genetic backgroundJ]. Eur Radiol. 2020;30:2. doi:10.1007/s00330-020-06687-y
32. Miura T, Ban D, Tanaka,等 S. Distinct clinicopathological phenotype of hepatocellular carcinoma with ethoxybenzyl-magnetic resonance imaging hyperintensity: association with gene expression signatureJ]. Am J Surg. 2015;210(3):561–569. doi:10.1016/j.amjsurg.2015.03.027
33. Khalaf AM, Fuentes D, Morshid AI, et al. Role of Wnt/β-catenin signaling in hepatocellular carcinoma, pathogenesis, and clinical significance. J Hepatocellular Carcinoma. 2018;5:61–73. doi:10.2147/JHC.S156701
34. Ueno A, Masugi Y, Yamazaki K, et al. OATP1B3 expression is strongly associated with Wnt/β-catenin signalling and represents the transporter of gadoxetic acid in hepatocellular carcinoma. J Hepatol. 2014;61(5):1080–1087. doi:10.1016/j.jhep.2014.06.008
35. Yoneda N, Matsui O, Kitao A, et al. Benign hepatocellular nodules: hepatobiliary phase of gadoxetic acid-enhanced MR imaging based on molecular background. Radiographics Review Publication Radiological Society North America Inc. 2016;160037.
36. Fujiwara H, Sekine S, Onaya H, et al. Ring-like enhancement of focal nodular hyperplasia with hepatobiliary-phase Gd-EOB-DTPA-enhanced magnetic resonance imaging: radiological-pathological correlation. Jpn J Radiol. 2011;29(10):739–743. doi:10.1007/s11604-011-0624-4
 © 2021 The Author(s). This work is published and licensed by Dove Medical Press Limited. The
full terms of this license are available at https://www.dovepress.com/terms
and incorporate the Creative Commons Attribution
- Non Commercial (unported, 3.0) License.
By accessing the work you hereby accept the Terms. Non-commercial uses of the work are permitted
without any further permission from Dove Medical Press Limited, provided the work is properly
attributed. For permission for commercial use of this work, please see paragraphs 4.2 and 5 of our Terms.
© 2021 The Author(s). This work is published and licensed by Dove Medical Press Limited. The
full terms of this license are available at https://www.dovepress.com/terms
and incorporate the Creative Commons Attribution
- Non Commercial (unported, 3.0) License.
By accessing the work you hereby accept the Terms. Non-commercial uses of the work are permitted
without any further permission from Dove Medical Press Limited, provided the work is properly
attributed. For permission for commercial use of this work, please see paragraphs 4.2 and 5 of our Terms.