Back to Journals » Medical Devices: Evidence and Research » Volume 11
Novel evaluation method for electrosurgical ablation by monopolar hot biopsy forceps for colonoscopy
Received 21 July 2018
Accepted for publication 26 September 2018
Published 24 October 2018 Volume 2018:11 Pages 379—389
DOI https://doi.org/10.2147/MDER.S181025
Checked for plagiarism Yes
Review by Single anonymous peer review
Peer reviewer comments 2
Editor who approved publication: Dr Scott Fraser
Chen Tang,1 Jung Hun Choi2
1Department of Mechanical Engineering, Ohio University Athens, Athens, OH 45701, USA; 2Department of Mechanical Engineering, Georgia Southern University, Statesboro, GA 30459, USA
Aim: This study evaluates tissue injury, which results from electrosurgical ablation, by correlating lesion depth to tissue impedance, and introduces a newly developed real-time feedback control system that can be applied for preventing excessive tissue injury. Although some previous studies had evaluated such tissue injuries in other ways, a specific mechanism is necessary to actually prevent excessive tissue injury.
Materials and methods: Ablation tests were performed by using an impedance bridge circuit and gel block that have been developed in two previous studies. Depth of the ablation site was measured with the use of a laser displacement measurement device. To simplify the programing work, voltage was used, as a substitution of tissue impedance, to evaluate tissue injury.
Results: The depth of the ablation site was found to increase with either increased power setting or ablation duration, and the depth was analyzed to investigate correlation with measured voltage. The real-time feedback control system was developed by achieving communication between LabVIEW and an Arduino microcontroller.
Conclusion: It is concluded that the depth of the ablation site modestly correlates with the measured voltage under specific conditions, and the newly developed system fulfills the goal of the design.
Keywords: colonoscopy, electrosurgical ablation, impedance, perforation
Introduction
The quantity of thermal tissue injuries generated by monopolar colonoscopic ablation deserves extra attention from endoscopists, since excessive thermal injury potentially increases the risk of colonoscopy-related complications. Approximately 136,830 new cases of colorectal cancer and 50,310 deaths resulting from it are expected.1 Colonoscopy is widely acknowledged as the optimal modality used to screen precancerous lesions and prevent colorectal cancer.2–4 Although complications were reported, colonoscopy is still considered as a generally safe procedure.2,5 However, it should be noticed that the experience and colonoscopy volume of the endoscopist definitively affect the incidence of complications.6 Moreover, the evidence showed that the complication rate of an endoscopy procedure performed by a low-volume endoscopist is high when compared with those performed by an experienced endoscopist.7–10 Thus, it is necessary to seek a way that is feasible and helps the inexperienced endoscopist to improve their procedure performance.
Background
Colonoscopy plays a significant role in both detecting and preventing colorectal cancer and thus has become the most commonly accepted gastrointestinal (GI) endoscopic procedure.10 Therapeutic indications cover removal of GI neoplasms, treatment of bleeding, and so on. The bowel preparation for colonoscopy is critical, because it assuredly affects the procedural success rate and the incidence of some colonoscopy-related minor complications.5,11 Biopsy forceps and snare are the most common instruments used.12 Hot biopsy forceps are applied when tissue sampling or removal of small polyps is needed.13,14 This technique combines the principles of monopolar electrocoagulation and pinch biopsy forceps in order to achieve the effect of simultaneous tissue sampling and electrocoagulation.15 The hot biopsy forceps are electrically insulated to prevent current leaking into the colonoscope when current flows through. The resection is assumed to be completed when a white zone of coagulum is seen at the base of the lesion.12,13 In some colonoscopy cases, hot biopsy devices also serve as electrodes during tissue biopsy and electrocautery.16
Problem statement and purpose of the study
Although colonoscopy-related complications occurred rarely, they still can imperil a patient’s life. Moreover, complications preferentially occur in therapeutic procedures compared with diagnostic procedures.17 Colonoscopic polypectomy-related bleeding, postpolypectomy burn syndrome, and perforation are the three common major complications, which are mostly caused by excessive tissue thermal injury that results from electrocoagulation. According to a previous study, excessive tissue damage can be ascertained when coagulation injury goes deep through the outer muscularis and into the serosa.18 Thus, monitoring the amount of tissue damage during electrosurgical procedure is a feasible way to improve the procedure performance. It has previously been shown that electrical impedance of tissue between electrode tip and return pad can be utilized as a predictor of ablation site size and electrode-tissue interface contact force in some radiofrequency catheter ablation studies.19–27 The present study uses the impedance bridge circuit described in Randy’s research and the body equivalent stack developed by Liang was performed.28,29 The study objectives are presented as follows.
The purpose of this study was to investigate the correlation between electrical properties of the tissue and depth of the ablation site. Subsequently, a communication control system was developed to monitor and control the delivered radiofrequency energy, such that the ultimate goal of preventing excessive thermal tissue injury was achieved. The impedance medium used in another previous study was a sponge with some solution soaked in it.28 In the present study, to better emulate the ablation environment, a silicone gel block was incorporated in the ex vivo simulated test model to serve as impedance medium.29 Besides, the impedance bridge circuit described in the study was also necessary for data measurement, which compares the differences in the electrical properties before and after the ablation procedure.28 Moreover, the correlation between the magnitude of impedance difference and delivered ablation energy is also presented in this study.
Materials and methods
The ablation experiment procedure was divided into several steps, namely material preparation, ablation circuit setup and control system design, ablation test, and consequent post-test data analysis. Material preparation includes tissue preparation and gel block preparation. Ablation circuit and control system design are then introduced. The related data analysis method is described at the end.
Material preparation and ablation system
Porcine colon was used as a test subject in the ablation experiment. The gel block served as an impedance medium to compensate for the differences in biological features with a human body. In this experiment, it was used in combination with tissue sample to emulate a human colon well. This body equivalent stack is an important part of the ex vivo test model due to its effect on measured electrical parameters. A gel block mold, which had been made by Liang, was utilized in gel block generation, functioning as a container that holds the solution agents during the gel formation process.29
This subsection introduces the ablation circuit and presents the idea of the control system in detail. The overview of the entire ablation system is shown in Figure 1. The ablation circuit and the test area are the main components, which are marked in Figure 1 as “A” and “B”, respectively.
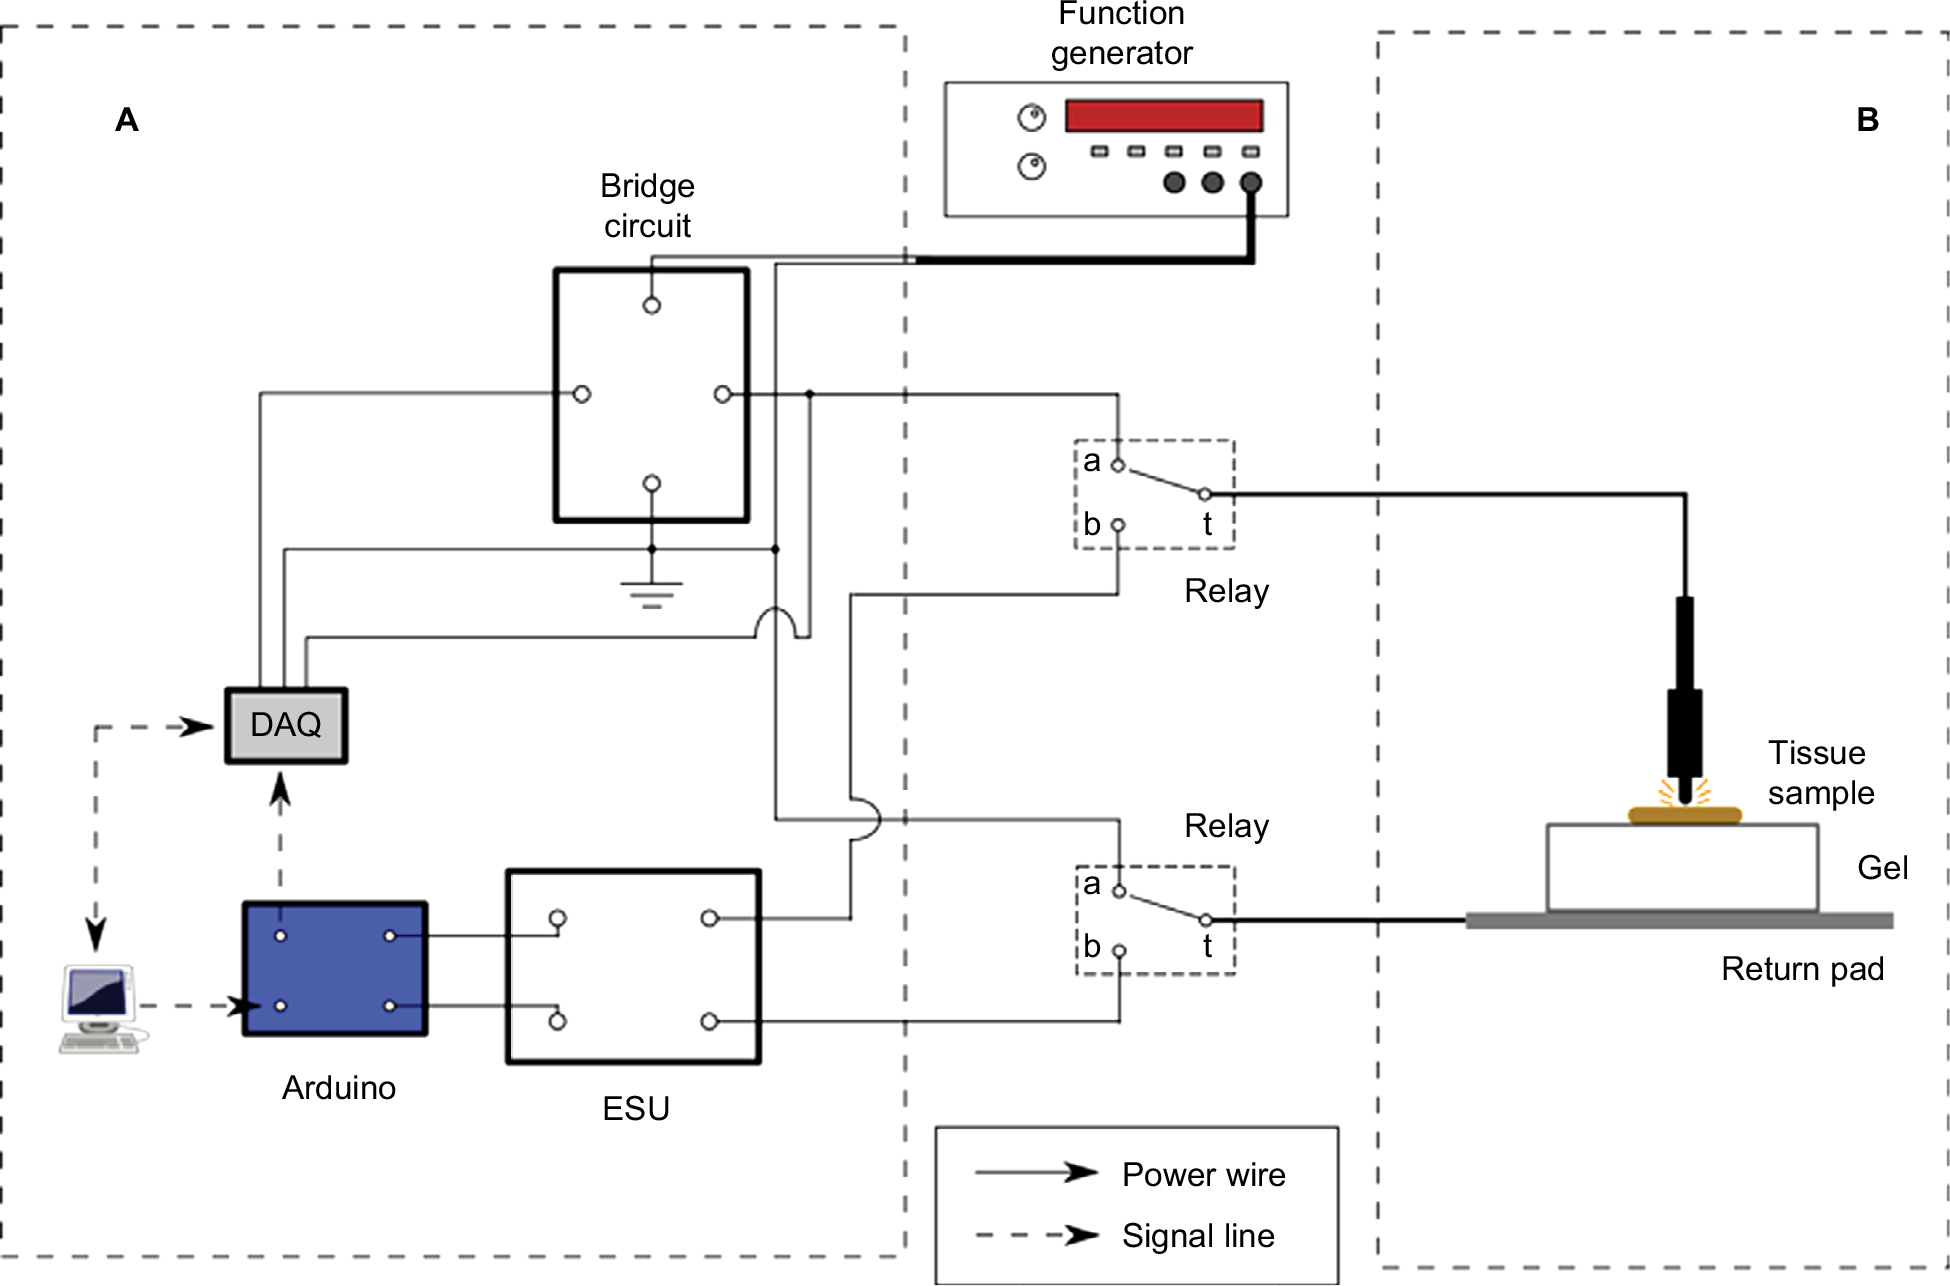 | Figure 1 The overview of the entire ablation system. Notes: Ablation circuit and control system are marked as area “A” and ablation test area is marked as “B”. Abbreviations: DAQ, data acquisition system; ESU, electro-surgical unit. |
Olympus PSD-20, a clinical monopolar electrosurgical unit, was applied serving as a radiofrequency ablation power generator. To precisely control the ablation duration, a modification was made to the foot pedal (aka “Electro-Surgical Unit’s Manual Trigger”). In a previous study, the pure current mode was selected for experiment, and thus only the “cut” infra-red gate was modified. While in the current study, the “coagulation” IR gate was modified since pure coagulation mode was chosen for the experiment.28
The ablation control part, located in area “A” of Figure 1, and its main body is constituted by a computer (with LabVIEW installed) and an Arduino microcontroller. Real-time ablation firing feedback control was achieved on the basis of serial communication of LabVIEW software and Arduino microcontroller. The corresponding mechanism is explained as follows: LabVIEW (10 k sample rate) receives collected data from the DAQ board and performs logical operations in consequence. The circuit diagram and a photograph of the assembled ablation system are shown in Figure 2. The blue lines in Figure 2 represent data transmission wires, which are all connected to data acquisition system . The ESU triggering was controlled correspondingly by duration buttons on a remote.
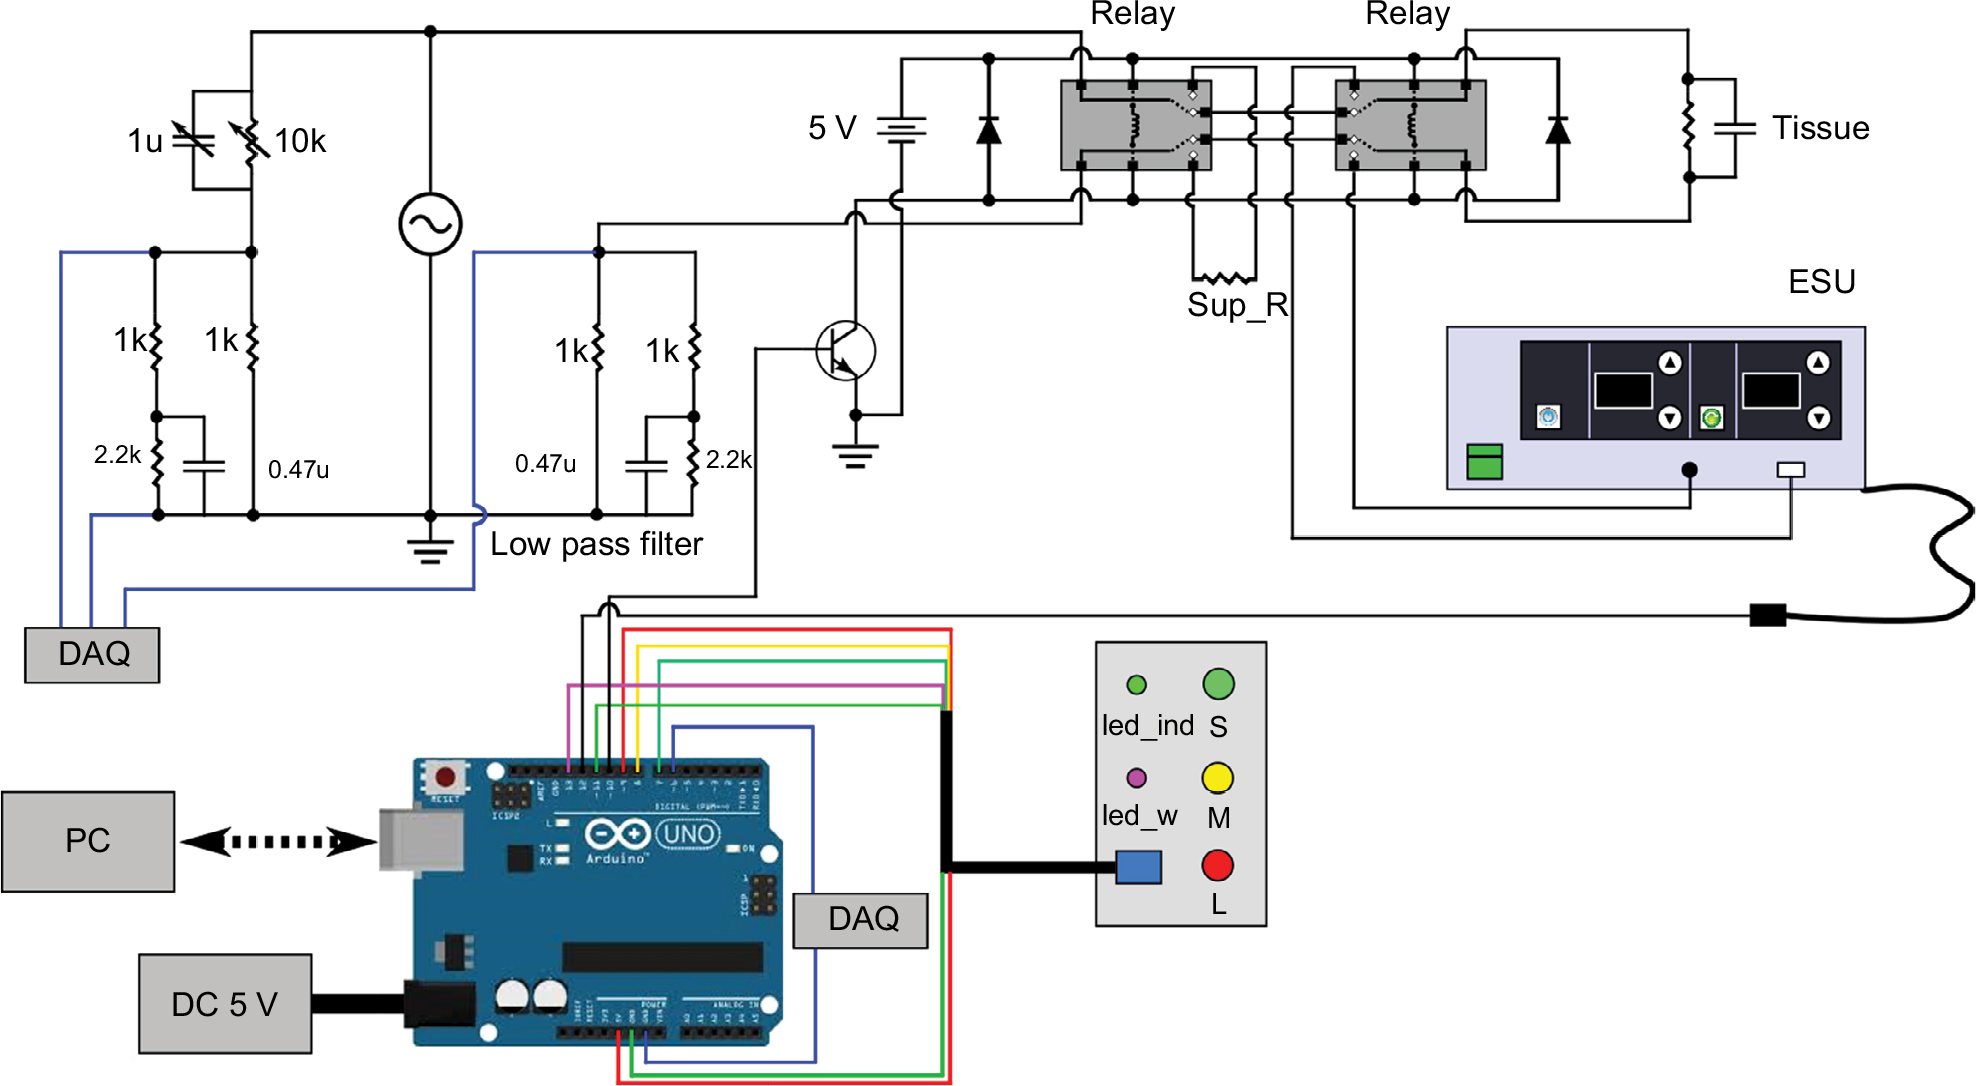 | Figure 2 The circuit diagram of the ablation system. Abbreviations: DAQ, data acquisition system; ESU, electro-surgical unit. |
The depth measurement was performed with the application of a laser displacement measurement system and the newly designed slide rail.
Experiment design and analysis
The entire experiment procedure was divided into two phases, the verification test (or in other word, preliminary experiment) and the ablation experiment. The verification test was performed with the use of sliced ham in which all described components were assembled (ablation circuit and equivalent stack).
The experiment design of the ablation experiment covers configuration of experimental parameters, repeated trials, and experiment procedure. Figure 3 shows experiment setup and post-ablation tissue sample. A transparent cover was put on top of the tissue so as to prevent tissue wrapping around electrode or slipping on the gel block. The combinations and test parameters and measured parameters are shown in Table 1. Each time, prior to experiment, the power settings were manually set up by inputting values into the ESU. The ablation durations were predefined and programed into the Arduino microcontroller, thereafter controlled by the remote accordingly.
 | Figure 3 (A) Ablation experiment setup; (B) post-ablation colon tissue. |
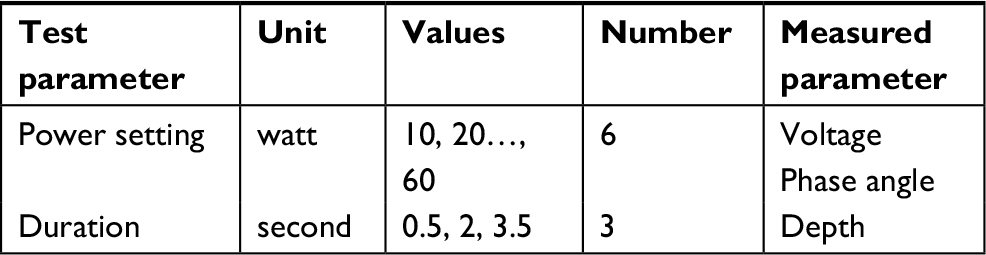 | Table 1 Experiment parameters |
Statistical analysis includes t-test, two-way ANOVA, and linear regression analysis, which were all performed in R-project. The goal of the statistical analysis was to investigate the effects of power settings and ablation duration on measured voltage drop and depth, and correlation between measured voltage drop and depth under different experiment settings (power and duration). Although all observations were derived from the same pig colon, they were obtained from geographically separated colon pieces (one square inch). Thus, all observations were assumed to be independent. All voltage changes (differences) were derived from the difference between pre-ablation voltage mean values and post-ablation voltage mean values, where the latter was calculated on the basis of the data from the last 10 seconds of the procedure. Moreover, the standard deviation calculation was performed for each trial, which is to enhance the availability of post-ablation voltage mean values.
Results
The Results section is divided into two parts, namely impedance calculation and linear regression analysis, and is presented in order.
Impedance calculation
The voltage (Va–b) value at long duration 50 and 60 W was excluded because of the presence of abnormal Va reversal, and the relevant voltage values were subsequently depicted in Figure 4. The voltage (Va–b) values were basically divided into three subsets according to different durations and then characterized by colors. Most of the voltage values basically followed an ascending trend with increment of power setting, while this trend was not that distinct with an increase of duration. For instance, the voltage increased as the firing duration became longer in the subset that has 20 W power setting, whereas in the subset with 30 W power setting, a descending trend was observed among middle and long durations. According to the mechanism of the impedance bridge, the increase of voltage values indicated that tissue impedance decreased accordingly.
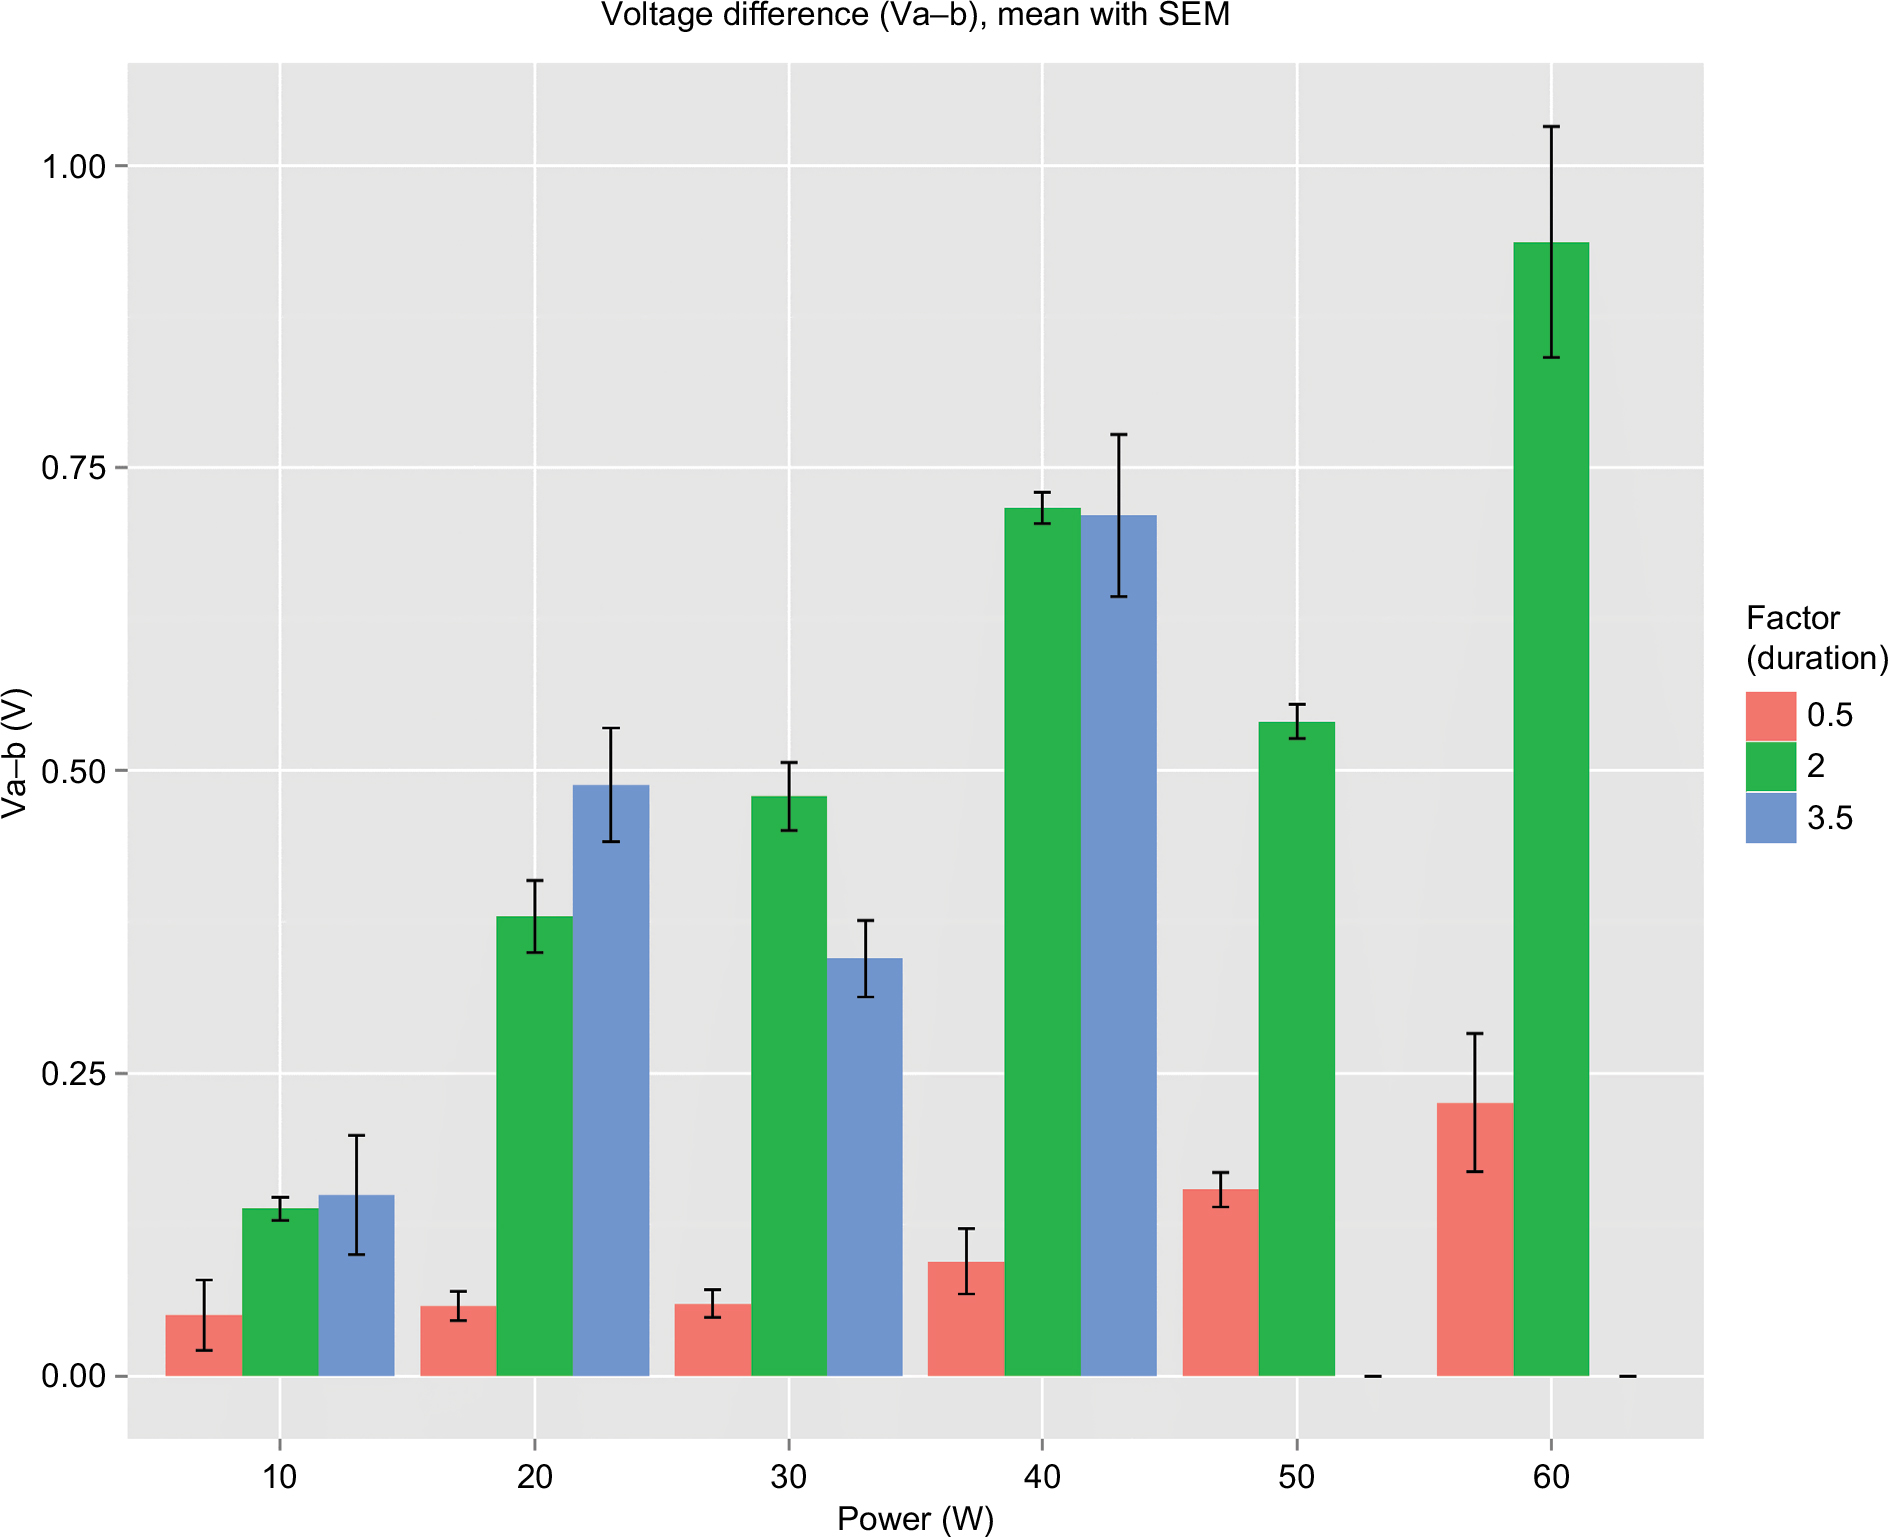 | Figure 4 Effect of power setting and ablation duration on voltage change. Notes: X-axis represents power setting of the ESU. The ablation durations being identified by colors. The height of the rectangle bar along the Y-axis represents amount of voltage change, Va–b. The length of the adherent black bar represents the standard error of Va–b. Abbreviations: SEM, standard error of the mean; ESU, electro-surgical unit. |
Figure 5 shows tissue impedance values at pre-ablation and post-ablation periods, separately, where the X-axis represents the power setting of the ESU. The ablation statuses are identified by colors. The height of the rectangle bar along the Y-axis represents the impedance value. The length of the adherent black bar represents the standard error of impedance. One important indication is that the decrement of impedance or the increment of voltage may be a better parameter for data analysis when compared with temporal impedance or voltage.
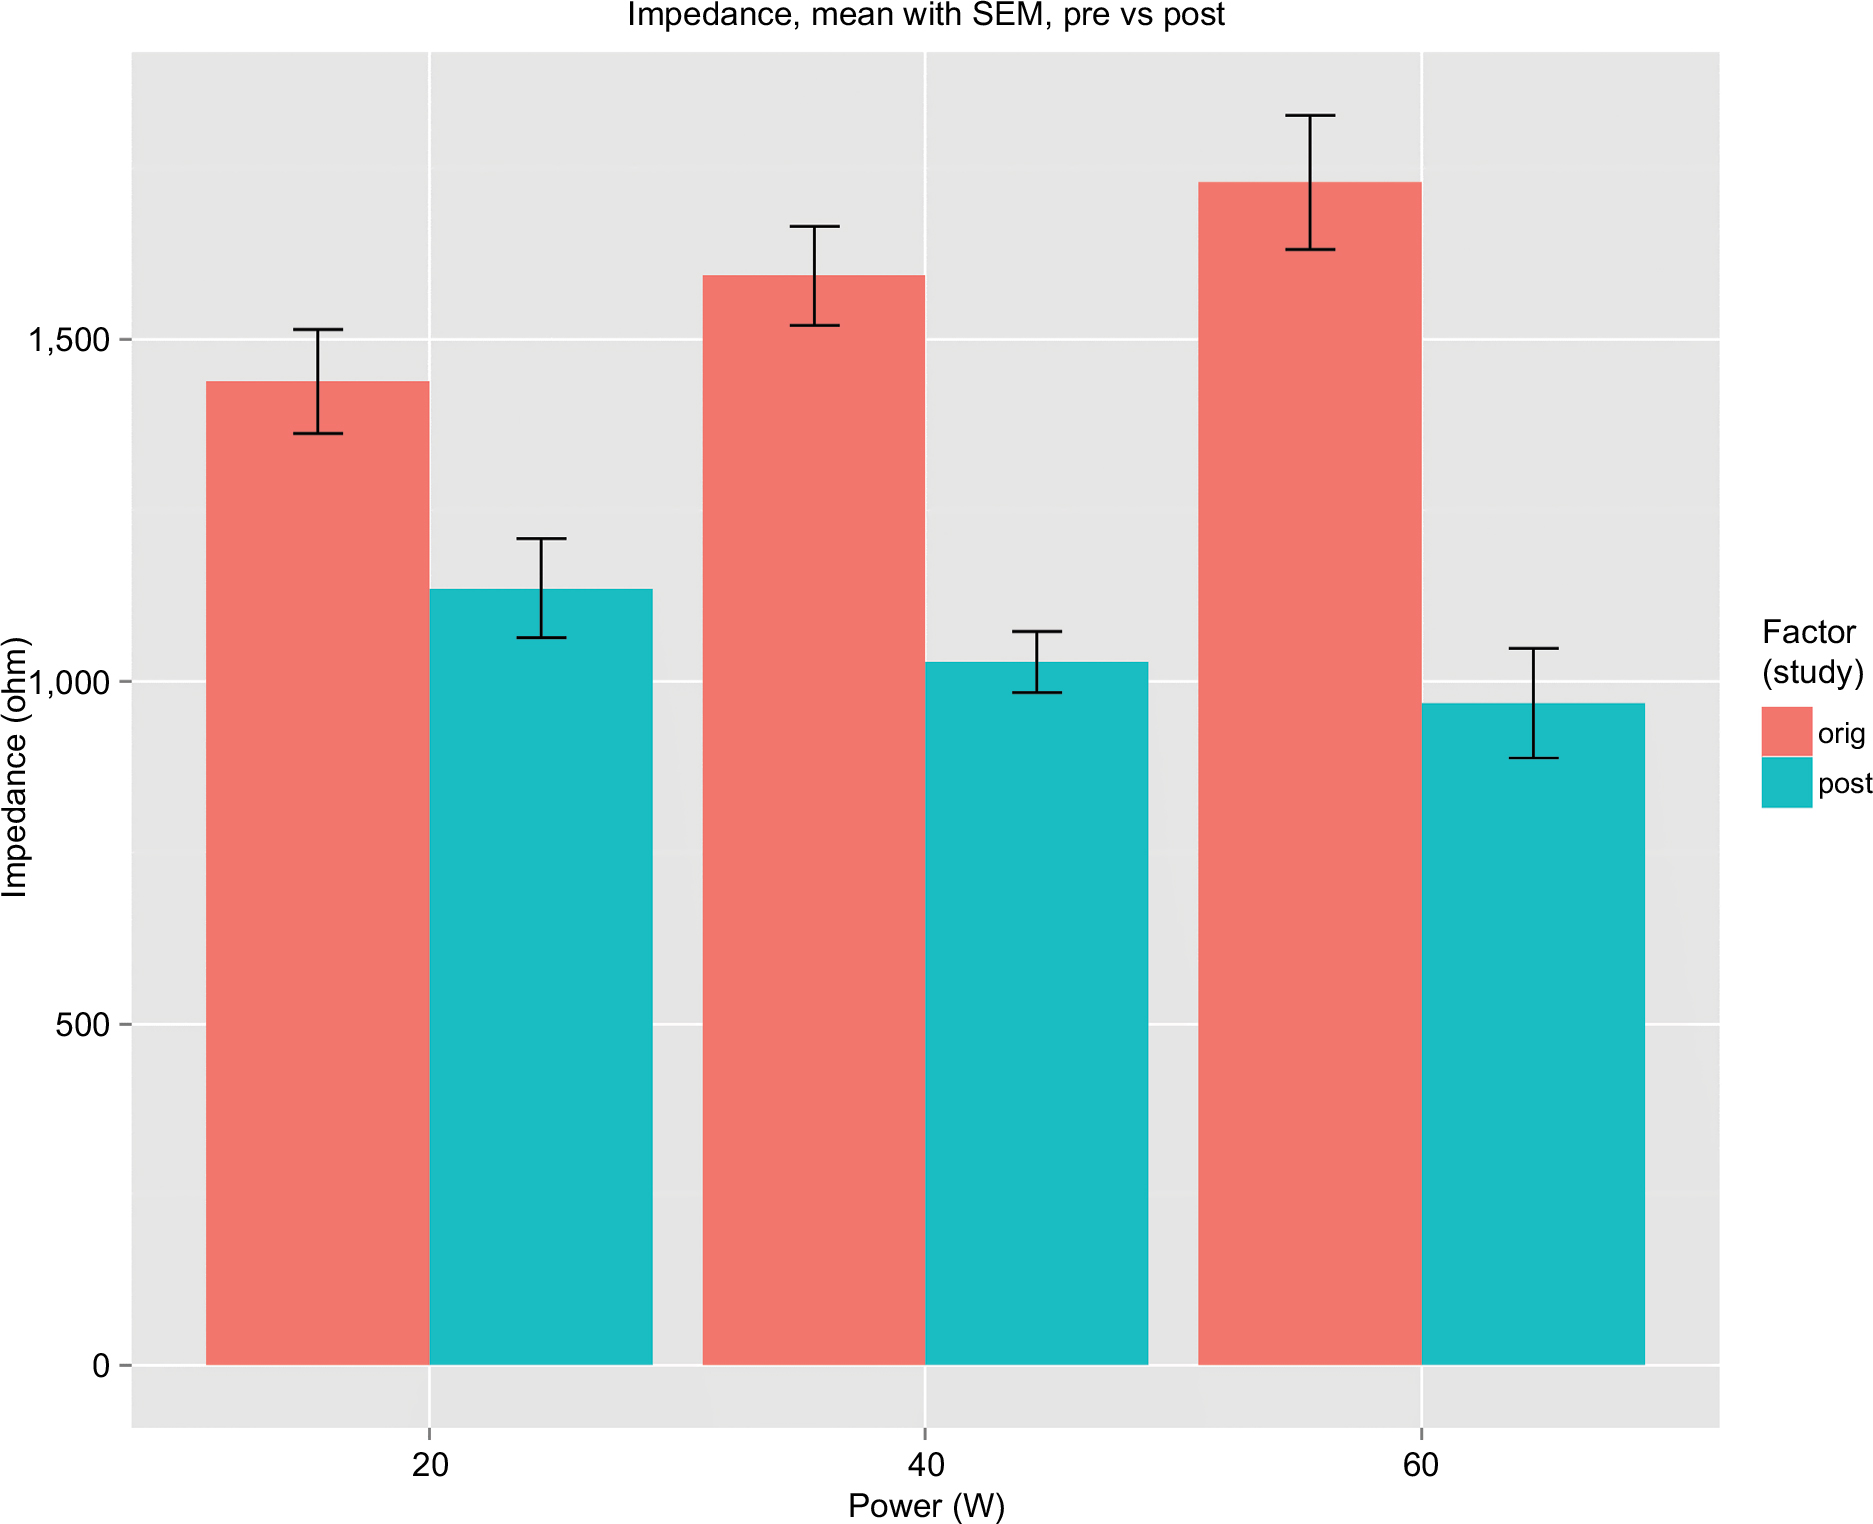 | Figure 5 Comparison between pre-ablation and post-ablation tissue impedance. Notes: X-axis represents power setting of the ESU. The ablation statuses are identified by colors. The height of the rectangle bar along the Y-axis represents impedance value. The length of the adherent black bar represents the standard error of impedance. |
The effect of power setting and ablation duration on depth of the ablation sites is shown in Figure 6, where the X-axis represents the power setting of the ESU; the ablation durations differ by colors; the height of the rectangle bar along the Y-axis represents depth of the ablation sites; the length of the adherent black bar represents the standard error of measured depth. Among all observations, low power settings observations (10–30 W) seemed to be largely affected by random error, instead of predefined experiment parameters (power and duration), while the observations at high-power settings demonstrated better trend and met the expectations of the ablation experiment. It was found that the high-power setting observations increased with either higher power or longer duration. Long error bars over 40L and 60L (40 and 60 W long duration) were due to the tilted surface of the ablation site, because the uneven surface resulted in a deviation of measuring accuracy when the laser displacement measurement system was applied.
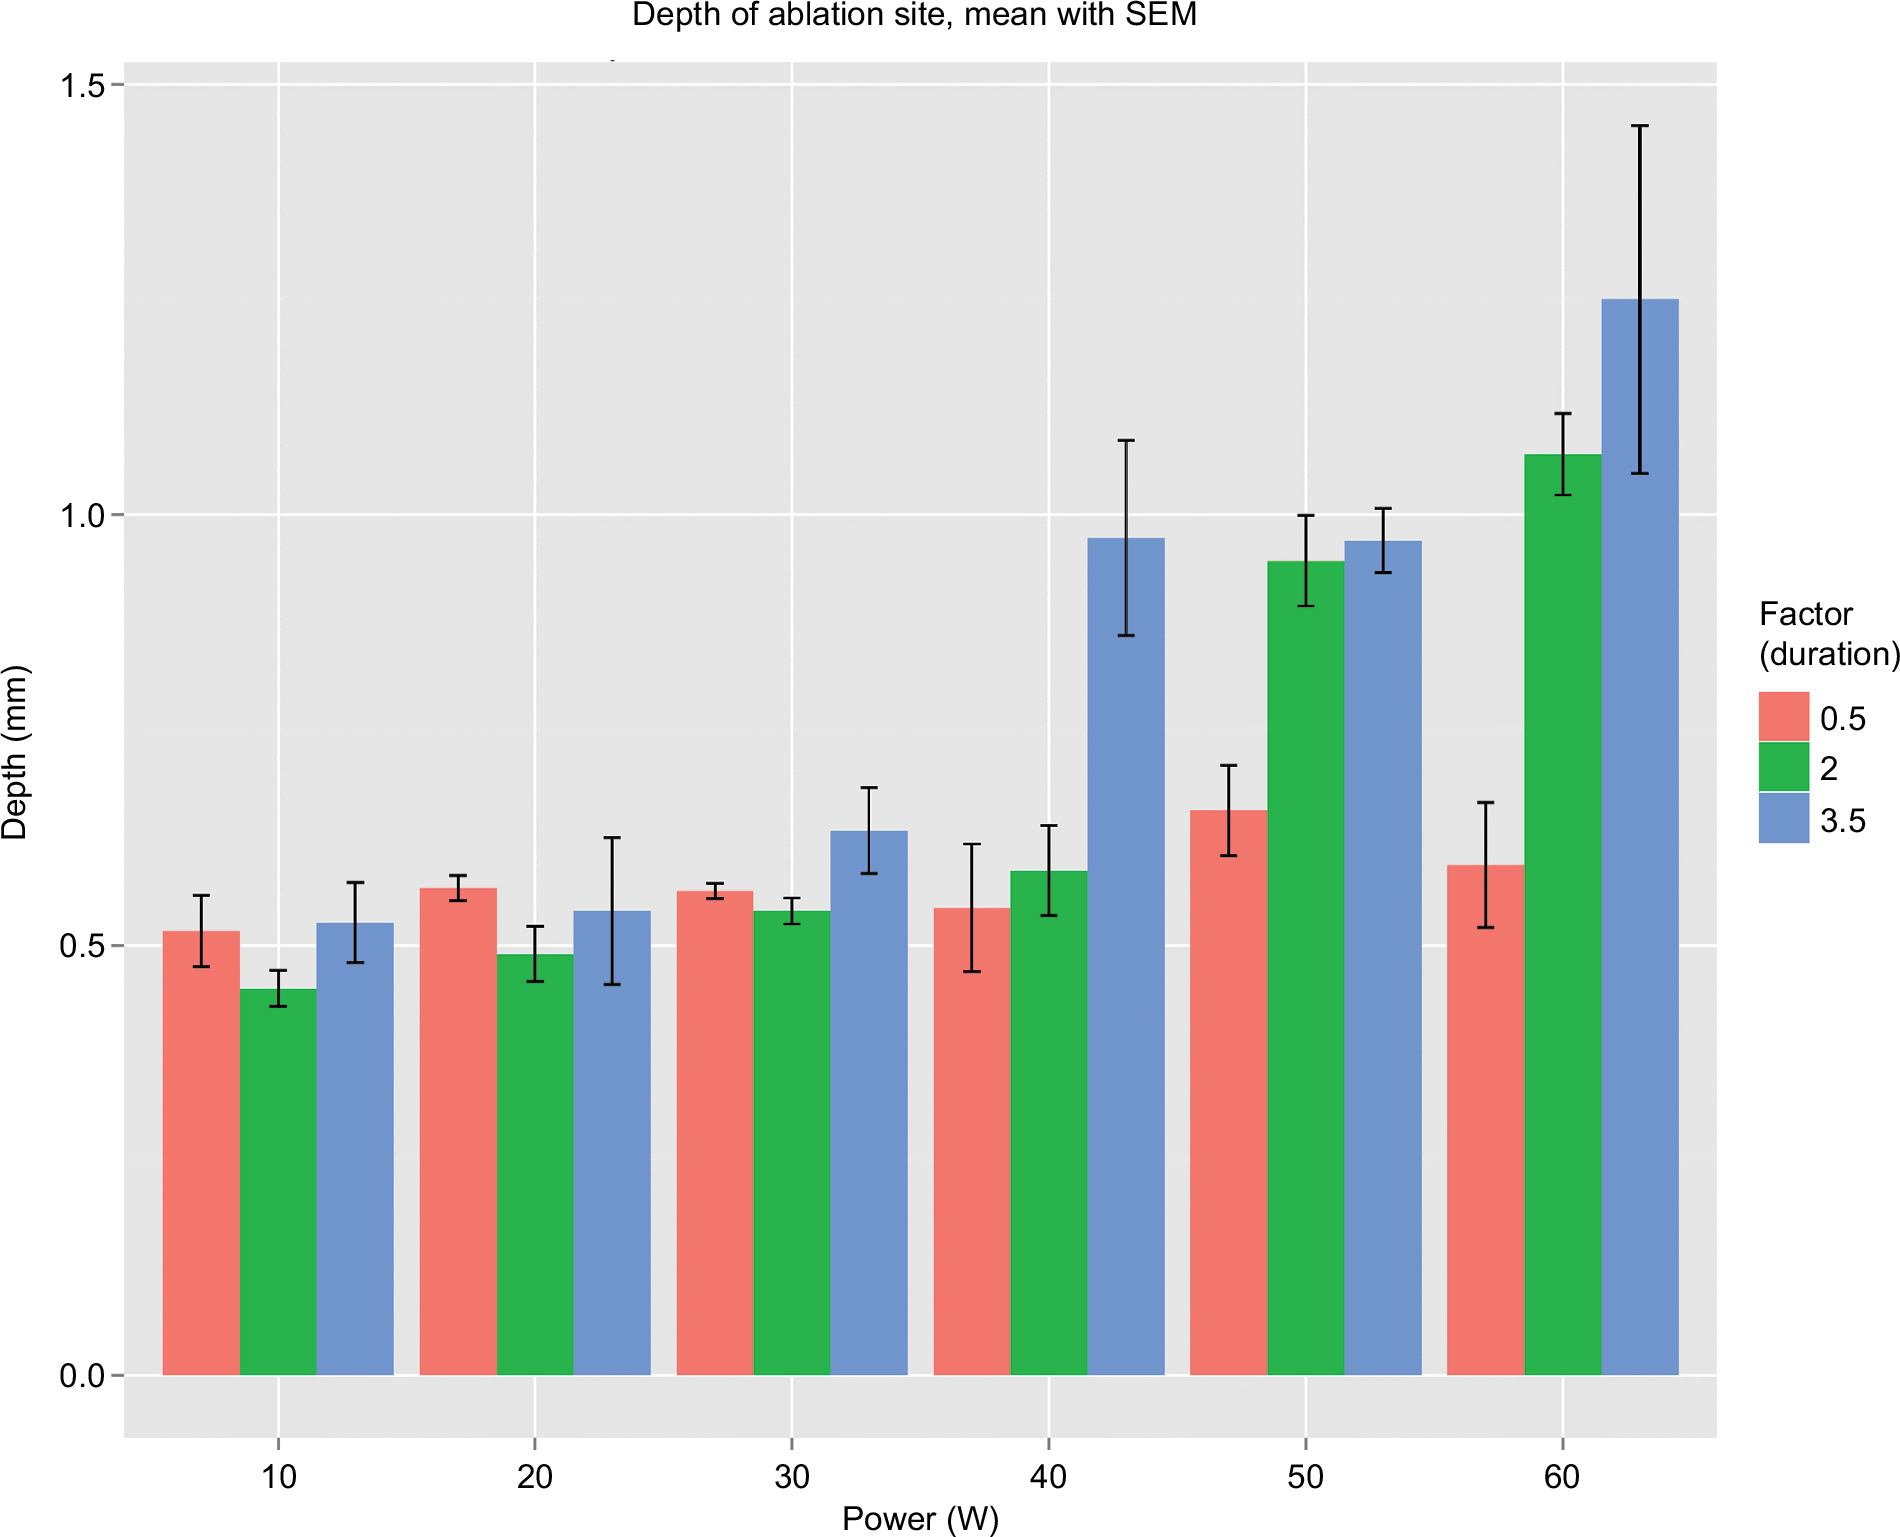 | Figure 6 The depth of ablation site obtained from different combinations of test parameters. Notes: X-axis represents power setting of the ESU. The ablation durations differ by colors. The height of the rectangle bar along the Y-axis represents depth of the ablation sites. The length of the adherent black bar represents the standard error of depth. |
A two-way ANOVA test was then performed in order to investigate the effect of power setting and ablation duration on depth of the ablation sites, and Table 2 shows the results. Power, duration, and their combination had P-values much smaller than 0.05, which indicated that they had significant influence on measured depth. The t-test was performed on voltage (Va–b) and measured depth, respectively, in order to investigate the effect of different power level and duration on voltage and measured depth. The results shows that 1) in the middle duration subset the power setting had a significant effect on voltage (Va–b); 2) in the s–m subset (short vs middle) duration played an important role in affecting measured voltage (Va–b); and 3) it seemed that there were some overlaps in measured depth.
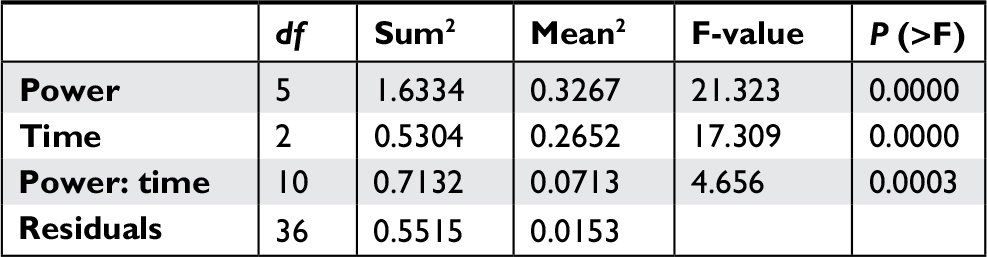 | Table 2 Two-way ANOVA test for effect of power setting and ablation duration on depth of ablation site |
Linear regression analysis
According to the method of impedance calculation, the voltage (Va–b) is proportional to tissue impedance. Moreover, the voltage (Va–b) is a real-time measured parameter which can be used without any further transformation process. That is, the use of voltage (Va–b) would simplify LabVIEW programing. Therefore, the voltage was chosen as the substitution of tissue impedance, being a predictor of depth of the ablation sites. To investigate correlation between two directly measured parameters, linear regression analysis was performed on three observation subsets.
Figure 7 shows the big picture of all observations and demonstrated a basic trend. That is, measured depth increased as Va–b became larger. In the figure, points were shaped and colored based on three different ablation durations. Red circles represent short-duration observations; green triangles represent middle-duration observations; and blue squares represent long-duration observations. The X-axis represents measured voltage. The Y-axis represents depth of the ablation sites.
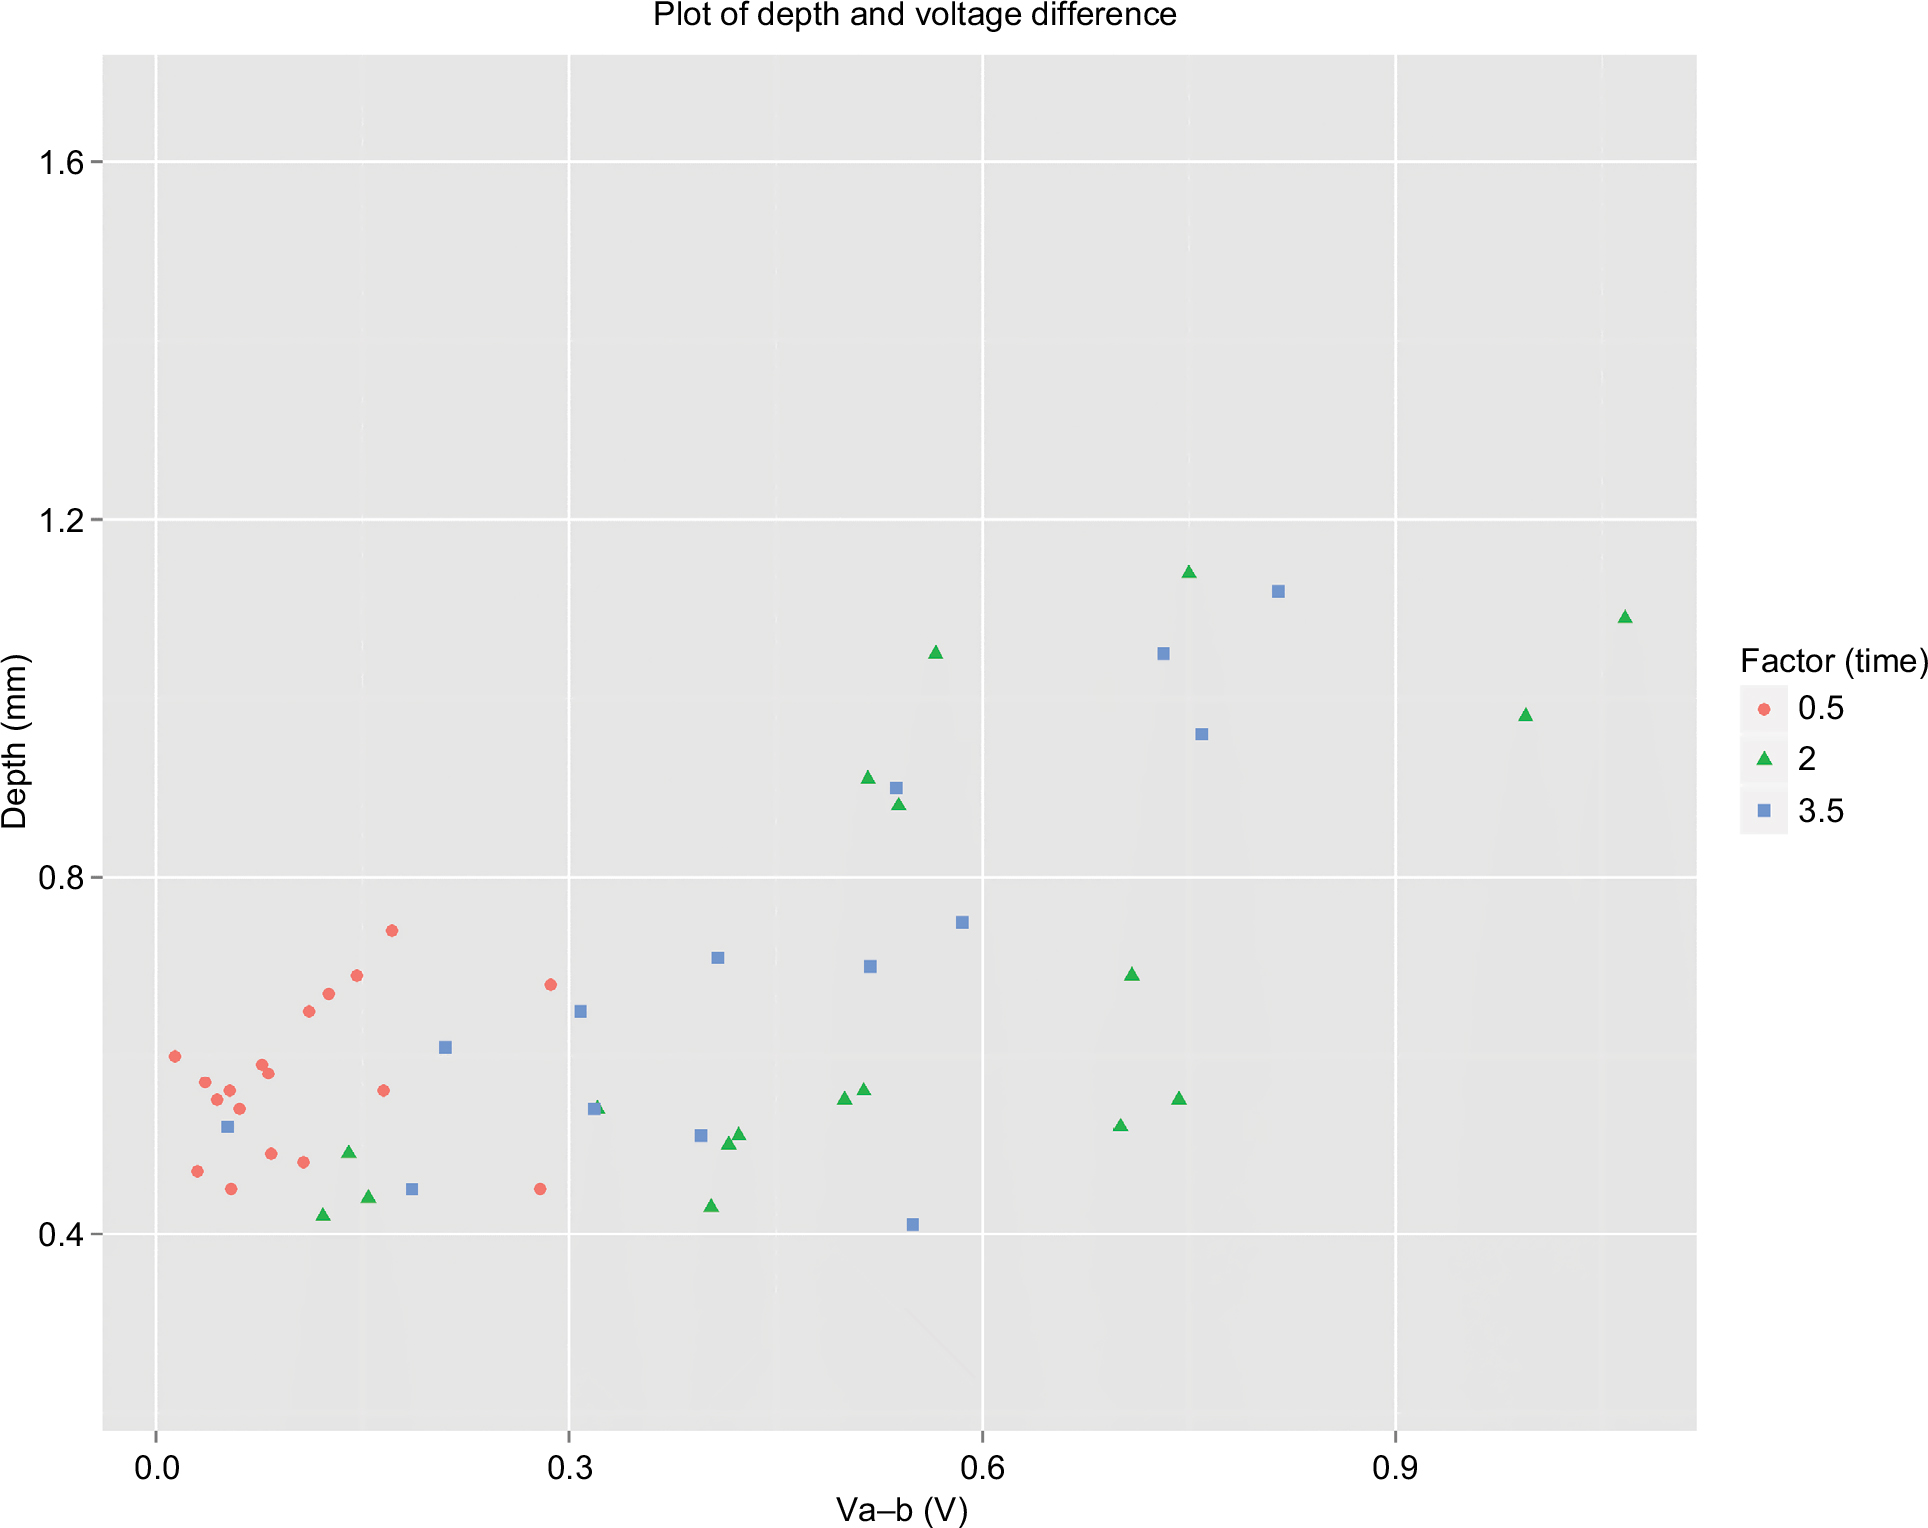 | Figure 7 Scatter plot of two measure parameters over all observations. Notes: Points were shaped and colored based on three different ablation durations. Red circles represent short-duration observations; green triangles represent middle-duration observations; and blue squares represent long-duration observations. X-axis represents the measure voltage. Y-axis represents depth of the ablation sites. |
Table 3 shows conclusion of linear regression analysis performed on the short-duration subset. The value of standard error was bigger according to estimate slope. P-value can be interpreted as the probability that the variable is not relevant. The estimate slope P-value was greater than 0.05. In addition, adjusted R2 was pretty low, where a higher value is better. Thus, the correlation between depth and Va–b was not significant for the short-duration subset.
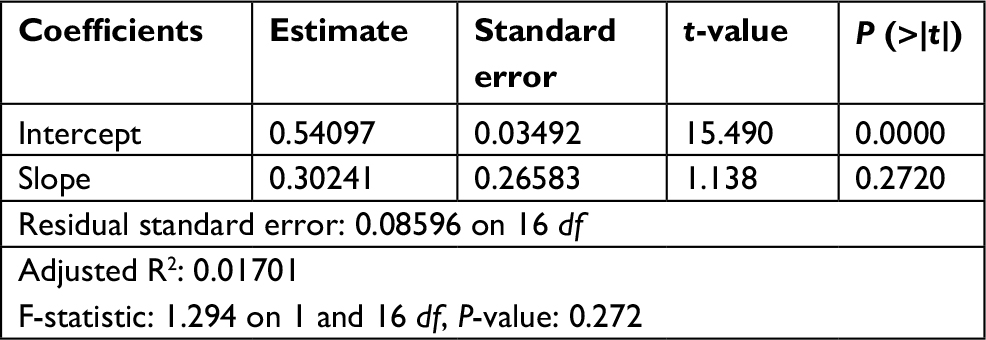 | Table 3 Linear regression analysis over short duration observations |
Table 4 shows results of linear regression analysis performed on the middle-duration subset. The standard error was tolerable. The estimate slope P-value was significant (much smaller than 0.05). In addition, adjusted R2 was about 0.45, meaning that depth only modestly correlated to Va–b. Thus, the depth of the ablation site modestly correlated to Va–b.
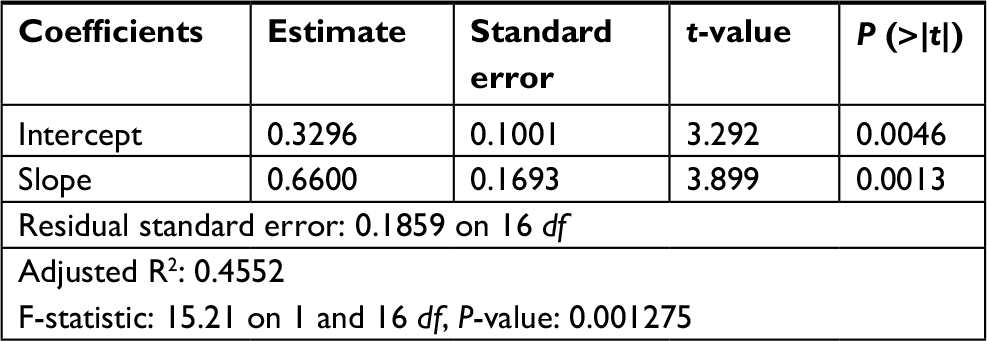 | Table 4 Linear regression analysis over middle-duration observations |
Since the voltage (Va–b) at 50L and 60L (50 and 60 W long duration) were excluded from the subset, regression analysis for long duration was performed only with the 10–40W interval. Table 5 shows the results. The standard error was tolerable. The estimated slope P-value was significant (much smaller than 0.05). Adjusted R2 was about 0.52, which is similar to that of the middle duration in the previous analysis. Therefore, the depth of the ablation site modestly correlated to Va–b.
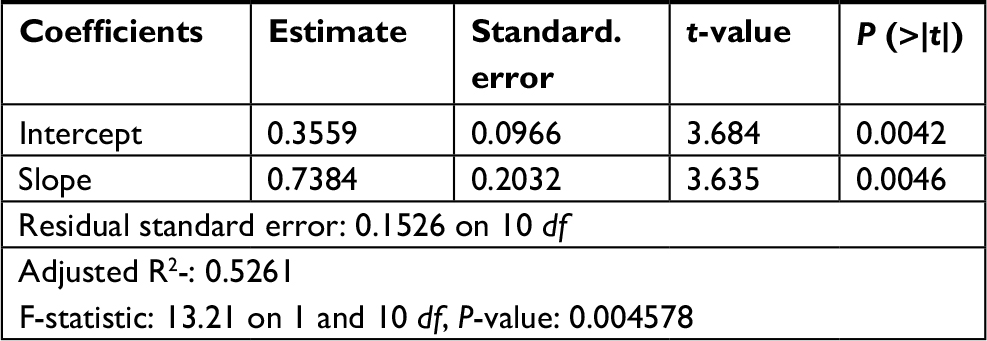 | Table 5 Linear regression analysis over only 10–40 W long-duration observations |
Prospective experiment of real-time ablation firing feedback control
To further assess availability of the newly developed control system, a prospective experiment was performed with the settings of 20M (20 W middle duration) and 40L (40 W long duration). On the basis of collected data and statistical analysis, the threshold value for the 20 W-test was first set to be the same as the corresponding mean. However, due to deviation of Va–b, all three trials were not successful. Thereafter, the threshold was determined as the corresponding mean with a decrement of 0.2 V. All three trials met the experiment expectation. Table 6 shows the result of the prospective test.
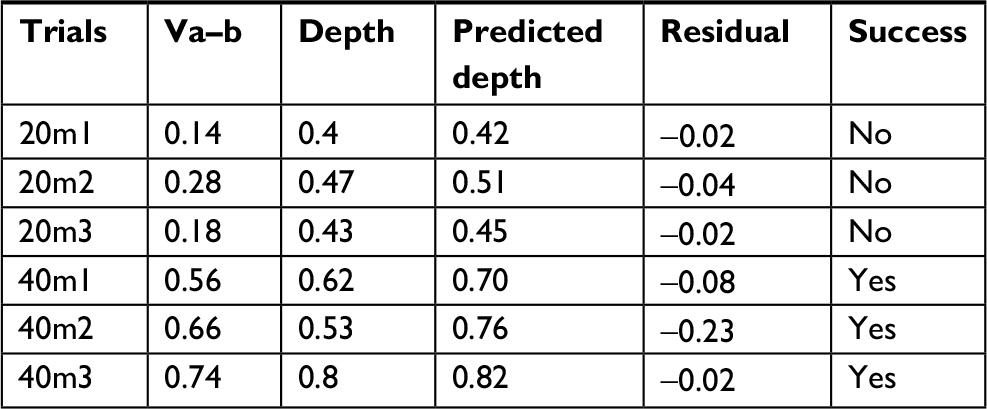 | Table 6 Result of prospective test Notes: Predicted depth was calculated on the basis of measured Va–b and linear model (middle duration). Residual represents difference between actual measured depth and predicted value. Success means that after the first ablation firing, the second ablation firing was successfully stopped. |
Discussion
Colonoscopy is widely used as a primary screening modality. It is highly accurate and effective in the examination of the entire colon as well as detecting and resecting adenomas throughout the colon, which significantly reduces the incidence of colorectal cancer by 76%–90%.11,30 The biopsy forceps and snare are the most commonly applied devices during colonoscopic procedure, in which hot biopsy forceps are usually applied for the removal of diminutive polyps (less than 5 mm in diameter).12 However, the use of hot biopsy forceps has been revealed to be associated with deeper injury.18,31 The current study sought a method that can be used as an adjunct to improve procedure performance.
Previous studies have shown that impedance can be used as predictor of size of the ablation site.19,20 Therefore, tissue impedance was chosen as a test parameter in the current study. Several studies have pointed out that the insulating effect of coagulum resulted in a rise of impedance.27,32–34 The coagulum is a thin insulating layer adherent on the metal surface of the distal electrode, which is formed when plasma proteins denature as temperature at the electrode–tissue interface increases. The formation of coagulum also causes a decrease in tissue heating, which may affect the formation and volume of ablation site. It was found in the current study that the coagulum occurred more often in trials with either a high-power setting or long duration. This is because either high power or long duration usually results in delivered ablation energy increasing, thereby raising the temperature at the electrode–tissue interface. Besides, the quality of electrode-tissue contact also has an influence on impedance change. Some previous studies on radiofrequency endocardium ablation indicated that impedance between tip electrode and dispersive electrode increased as electrode-tissue contact force became larger.21,22,27 The contact force usually results in an increased embedded length of tip electrode. Subsequently, the interface area between electrode and circulating medium becomes small.21,22,27 Since the circulating medium was blood, in those studies, of which impedance is small compared with the tissue, the impedance between electrodes decreased. Whereas, in the current study, in contrast to the other abovementioned studies, the impedance decreased with the increased contact force, because the circulating medium in the current study was air, which is considered as an infinite impedance. Therefore, the surface area exposed in air becomes larger when electrode-tissue contact is poor, consequently resulting in an increase in impedance. In other words, when this happened the increment of voltage is smaller than in a normal case.
Post-ablation voltage decreased compared to pre-ablation status. Interestingly, all these 50L and 60L trials were found to be with the presence of tissue perforation. Moreover, among some of these trials, the electrode went through and subsequently embedded in the gel block, which may be the cause of occurrence of voltage reversal. In consequence, the gel block was burned and then was unavailable. A previous study pointed out that as tissue becomes coagulated, impedance increases, which is in contrast to the result of the current study.35 Other studies have shown that tissue heating results in an impedance decrease.24,36 Another study related decrement of impedance to tissue temperature.35 The mechanism of tissue heating is such that the collision happens when the current flow goes through the tissue, which results in heat generation.37,38 Moreover, the atoms and molecules in tissue cell become more active which leads to a decrease of impedance. Therefore, impedance decreases during tissue heating. In the current study, the period of all test trials is shorter than 1 minute. The resulting consequence is that the heat still remains in the tissue. Thus, the impedance decreases (voltage Va–b increased).
The animal epicardial study demonstrated that impedance drop significantly correlated with ablation site dimensions, such as depth and volume.20 The current study presented comparable results. The difference is that the impedance drop only modestly correlated with the depth of the ablation sites. In addition, it was found, in the same epicardial study, that a greater impedance drop was observed with the presence of steam pop and crater formation. The formation of steam pop can be described as follows. The electrical resistance of tissue leads to heat generation when there is an electrosurgical current passing through it. Thus, high-density current at the point of electrode-tissue interface results in a sharp increase in tissue temperature. Subsequently, as the delivered energy (either power setting or ablation duration) increases, the steam pop, a tiny explosion, occurs when tissue temperature exceeds the boiling point of water. It can be explained as the water in cell vaporizes from the holes in the cell membranes when the boiling point of water is achieved. Thereafter, the cell explodes. The tissue protein was then coagulated to achieve hemostasis.31 In the current study, steam pop was found to be associated with high delivered ablation energy and resulted in a sudden rise in impedance. The short duration subsets did not show an obvious trend as power increased. This is because short ablation-firing duration resulted in less ablation energy delivered. Consequently, depth was largely affected by pushing force, which induced random error. Conversely, with long firing duration, more energy was delivered into tissue. In consequence, the effect of pushing force on depth was attenuated. Results of a t-test performed on depth indicated depth observations overlapped with each other, which may be attributed to potential measuring and random error. Measuring error may be induced by some necessary moves of slide rail and tilted tissue surface. Results of linear regression analysis were presented among which the short duration subset showed no correlation between depth and Va–b; and the middle duration and long duration subsets showed depth only modestly correlated with Va–b. However, the result derived from the long duration subset may be limited by the number of observations, since 50L and 60L were excluded from analysis.
This newly developed control system can be modified, thus being capable of adapting to the other sensor types, such as force sensor and heat sensor. A mounted force sensor can help with preventing diagnostic perforation, which results from too much external force against colonic wall. The use of heat sensor will be helpful with preventing perforation caused by electrocautery. The method of depth measurement has been a limitation to this study. A laser displacement measurement system was used for depth measurement. The mechanism of displacement measurement for this device is infrared reflection; therefore, the depth measurement is better performed on a flat plane. Since measuring environment in this study was colon surface, there might be potential measuring error induced by it. Future work should focus on the optimization of the measuring method. Modifying slide rail in size and structure to avoid unnecessary moves is promising. Of course, the histology analysis will be a reliable method if feasible. In further experiments, adaptive liquid circulating medium should be incorporated in the ex vivo model to better emulate in vivo condition; moreover, repetitive firing with short duration concentrated in a certain period would be a better experiment setting, which is similar to the real situation of a colonoscopy procedure.
Acknowledgment
This research was not supported from any funding agencies, commercial, or not-for-profit sectors.
Disclosure
The authors report no conflicts of interest in this work.
References
Siegel R, Ma J, Zou Z, Jemal A. Cancer statistics, 2014. CA Cancer J Clin. 2014;64(1):9–29. | ||
Ginsberg GG. Risks of colonoscopy and polypectomy. Tech Gastrointest Endosc. 2008;10(1):7–13. | ||
Arora G, Mannalithara A, Singh G, Gerson LB, Triadafilopoulos G. Risk of perforation from a colonoscopy in adults: a large population-based study. Gastrointest Endosc. 2009;69(3 Pt 2):654–664. | ||
Ko CW, Riffle S, Michaels L, et al. Serious complications within 30 days of screening and surveillance colonoscopy are uncommon. Clin Gastroenterol Hepatol. 2010;8(2):166–173. | ||
Ko CW, Riffle S, Shapiro JA. Incidence of minor complications and time lost from normal activities after screening or surveillance colonoscopy. Gastrointest Endosc. 2007;65(4):648–656. | ||
Panteris V, Haringsma J, Kuipers EJ. Colonoscopy perforation rate, mechanisms and outcome: from diagnostic to therapeutic colonoscopy. Endoscopy. 2009;41(11):941–951. | ||
Rabeneck L, Paszat LF, Hilsden RJ, et al. Bleeding and perforation after outpatient colonoscopy and their risk factors in usual clinical practice. Gastroenterology. 2008;135(6):1899–1906. | ||
Dafnis G, Ekbom A, Pahlman L, Blomqvist P. Complications of diagnostic and therapeutic colonoscopy within a defined population in Sweden. Gastrointest Endosc. 2001;54(3):302–309. | ||
Singh H, Penfold RB, Decoster C, et al. Colonoscopy and its complications across a Canadian regional health authority. Gastrointest Endosc. 2009;69(3 Pt 2):665–671. | ||
Rathgaber SW, Wick TM. Colonoscopy completion and complication rates in a community gastroenterology practice. Gastrointest Endosc. 2006;64(4):556–562. | ||
Nelson DB, McQuaid KR, Bond JH, Lieberman DA, Weiss DG, Johnston TK. Procedural success and complications of large-scale screening colonoscopy. Gastrointest Endosc. 2002;55(3):307–314. | ||
Tolliver KA, Rex DK. Colonoscopic polypectomy. Gastroenterol Clin North Am. 2008;37(1):229–251. | ||
Peluso F, Goldner F. Follow-up of hot biopsy forceps treatment of diminutive colonic polyps. Gastrointest Endosc. 1991;37(6):604–606. | ||
Waye JD. Techniques for polypectomy and the problem polyp. Tech Gastrointest Endosc. 2003;5(4):160–165. | ||
Gilbert DA, DiMarino AJ, Jensen DM, et al. Status evaluation: hot biopsy forceps. American Society for Gastrointestinal Endoscopy. Technology Assessment Committee. Gastrointest Endosc. 1992;38(6):753–756. | ||
Carpenter S, Petersen BT, Chuttani R, et al. Technology Status Evaluation Report: polypectomy devices. Gastrointest Endosc. 2007;65(6):741–749. | ||
Marino AW. Complications of colonoscopy. Dis Colon Rectum. 1978;21(1):15–19. | ||
Savides TJ, See JA, Jensen DM, Jutabha R, Machicado GA, Hirabayashi K. Randomized controlled study of injury in the canine right colon from simultaneous biopsy and coagulation with different hot biopsy forceps. Gastrointest Endosc. 1995;42(6):573–578. | ||
Avitall B, Mughal K, Hare J, Helms R, Krum D. The effects of electrode-tissue contact on radiofrequency lesion generation. Pacing Clin Electrophysiol. 1997;20(12 Pt 1):2899–2910. | ||
D’Avila A, Houghtaling C, Gutierrez P, et al. Catheter ablation of ventricular epicardial tissue: a comparison of standard and cooled-tip radiofrequency energy. Circulation. 2004;109(19):2363–2369. | ||
Haines DE. Determinants of Lesion Size During Radiofrequency Catheter Ablation: The Role of Electrode-Tissue Contact Pressure and Duration of Energy Delivery. J Cardiovasc Electrophysiol. 1991;2(6):509–515. | ||
Zheng X, Walcott GP, Hall JA, et al. Electrode impedance: an indicator of electrode-tissue contact and lesion dimensions during linear ablation. J Interv Card Electrophysiol. 2000;4(4):645–654. | ||
Makimoto H, Lin T, Rillig A, et al. In vivo contact force analysis and correlation with tissue impedance during left atrial mapping and catheter ablation of atrial fibrillation. Circ Arrhythm Electrophysiol. 2014;7(1):46–54. | ||
Reichlin T, Knecht S, Lane C, et al. Initial impedance decrease as an indicator of good catheter contact: insights from radiofrequency ablation with force sensing catheters. Heart Rhythm. 2014;11(2):194–201. | ||
Kumar S, Haqqani HM, Chan M, et al. Predictive value of impedance changes for real-time contact force measurements during catheter ablation of atrial arrhythmias in humans. Heart Rhythm. 2013;10(7):962–969. | ||
Strickberger SA, Vorperian VR, Man KC, et al. Relation between impedance and endocardial contact during radiofrequency catheter ablation. Am Heart J. 1994;128(2):226–229. | ||
Cao H, Tungjitkusolmun S, Choy YB, Tsai JZ, Vorperian VR, Webster JG. Using electrical impedance to predict catheter-endocardial contact during RF cardiac ablation. IEEE Trans Biomed Eng. 2002;49(3):247–253. | ||
Robert RB. Development of Control Method for RF Ablation [master’s thesis]. Athens: Ohio University; 2014. | ||
Chen L. Novel Ex Vivo Ablation Test Model for Monopolar Hot Biopsy Forceps [master’s thesis] Athens: Ohio University; 2014. | ||
The New England Journal of Medicine [homepage on the Internet]. Tel Aviv University. Available from: https://www.nejm.org. Accessed April 29, 2013. | ||
Chino A, Karasawa T, Uragami N, Endo Y, Takahashi H, Fujita R. A comparison of depth of tissue injury caused by different modes of electrosurgical current in a pig colon model. Gastrointest Endosc. 2004;59(3):374–379. | ||
Haines DE, Verow AF. Observations on electrode-tissue interface temperature and effect on electrical impedance during radiofrequency ablation of ventricular myocardium. Circulation. 1990;82(3):1034–1038. | ||
Strickberger SA, Ravi S, Daoud E, Niebauer M, Man KC, Morady F. Relation between impedance and temperature during radiofrequency ablation of accessory pathways. Am Heart J. 1995;130(5):1026–1030. | ||
Wittkampf FH, Hauer RN, Robles de Medina EO. Control of radiofrequency lesion size by power regulation. Circulation. 1989;80(4):962–968. | ||
Morris ML, Tucker RD, Baron TH, Song LM. Electrosurgery in gastrointestinal endoscopy: principles to practice. Am J Gastroenterol. 2009;104(6):1563–1574. | ||
Strickberger SA, Ravi S, Daoud E, Niebauer M, Man KC, Morady F. Relation between impedance and temperature during radiofrequency ablation of accessory pathways. Am Heart J. 1995;130(5):1026–1030. | ||
Berjano EJ. Theoretical modeling for radiofrequency ablation: state-of-the-art and challenges for the future. Biomed Eng Online. 2006;5:24. | ||
Bialasiewicz JT, Bowers WJ. Radio Frequency Power Generation under Power Curve Constraints, Proc. IEEE IECON’09, Porto, Spain: 3728-3732. |
 © 2018 The Author(s). This work is published and licensed by Dove Medical Press Limited. The
full terms of this license are available at https://www.dovepress.com/terms
and incorporate the Creative Commons Attribution
- Non Commercial (unported, 3.0) License.
By accessing the work you hereby accept the Terms. Non-commercial uses of the work are permitted
without any further permission from Dove Medical Press Limited, provided the work is properly
attributed. For permission for commercial use of this work, please see paragraphs 4.2 and 5 of our Terms.
© 2018 The Author(s). This work is published and licensed by Dove Medical Press Limited. The
full terms of this license are available at https://www.dovepress.com/terms
and incorporate the Creative Commons Attribution
- Non Commercial (unported, 3.0) License.
By accessing the work you hereby accept the Terms. Non-commercial uses of the work are permitted
without any further permission from Dove Medical Press Limited, provided the work is properly
attributed. For permission for commercial use of this work, please see paragraphs 4.2 and 5 of our Terms.