Back to Journals » Clinical Ophthalmology » Volume 10
Noninvasive detection of microaneurysms in diabetic retinopathy by swept-source optical coherence tomography
Received 15 June 2016
Accepted for publication 9 August 2016
Published 16 September 2016 Volume 2016:10 Pages 1791—1795
DOI https://doi.org/10.2147/OPTH.S115016
Checked for plagiarism Yes
Review by Single anonymous peer review
Peer reviewer comments 4
Editor who approved publication: Dr Scott Fraser
Sarah Cheng, Theodore Leng
Department of Ophthalmology, Byers Eye Institute at Stanford, Stanford University School of Medicine, Palo Alto, CA, USA
Background and objectives: A method of identifying retinal vascular microaneurysms (MAs) in nonproliferative diabetic retinopathy (NPDR) using swept-source optical coherence tomography (SS-OCT).
Patients and methods: SS-OCT images were acquired in 17 eyes with NPDR using prototype SS-OCT device and fluorescein angiography (FA) images were obtained simultaneously. MAs identified on SS-OCT slabs were correlated to MAs identified on FA.
Results: MAs were identified in SS-OCT slabs in 15/17 eyes, resulting in NPDR diagnosis rate of 88%. Mean number of MAs identified on FA was 11.7±11.9 (total 199) and was 8.1±9.3 (total 137) on SS-OCT. Wilcoxon rank sum test showed no significant difference in MAs detected on SS-OCT and FA (P=0.2995) across eyes. Wilcoxon rank sum test showed SS-OCT detected slightly fewer MAs than FA per eye (3.65 less, P=0.0009).
Conclusion: SS-OCT visualization of MAs could serve as a tool for diagnosing NPDR, and possibly applied as an imaging biomarker for population-based diabetic retinopathy screening.
Keywords: diabetic retinopathy, swept-source optical coherence tomography, optical coherence tomography
Introduction
Diabetic retinopathy is a leading cause of blindness and low vision in the US. Patients with diabetic retinopathy can develop retinal microaneurysms (MAs), which is the first clinical sign of diabetic retinopathy, and can lead to macular edema, resulting in loss of vision.1,2 Notably, the total number of MAs is an indication of likelihood of future retinopathy.1,3–5 Thus, the detection and calculation of the number of MAs in diabetic eyes is key to management of diabetic retinopathy.6,7 To diagnose nonproliferative diabetic retinopathy (NPDR), ophthalmologists can identify MAs by analyzing fluorescein angiography (FA) fundus images. This method is reliable, but is invasive to patients, as they must receive an intravenous injection in order to visualize the MAs. Patients who have had a previous life-threatening reaction to an angiogram, or those with unstable severe cardiopulmonary disease may be precluded from this examination due to the potential life-threatening risk.8
Optical coherence tomography (OCT) is a noninvasive, noncontact method that allows measurement of retinal thickness and volume. Spectral domain OCT (SD-OCT) is widely available, provides clear resolution of individual retinal layers, and has been used to explore key pathological processes.9–11 In recent years, researchers have explored the potential of using SD-OCT to detect MAs.12–14 Preliminary studies have shown that SD-OCT is a reliable measure and correlates well to concurrent FA images.
SD-OCT yields a horizontal or vertical cross-sectional view of the retina, much like a histological section.15 But the quality of the view is limited by how many sections can be taken per minute – the more sections, the more accurate. Commercial SD-OCT systems have scan speeds of ~27,000–70,000 A-scans/s, compared to a more recent technology, swept-source OCT’s (SS-OCTs) 100,000 A-scans/s.16 This allows SS-OCT to perform faster acquisition of B-scans, allowing wide field B-scans incorporating both the optic nerve and macula in high resolution. In both wide field scans and in smaller fields of view, SS-OCT may be able to obtain more densely sampled scans, which take full advantage of the transverse resolution of OCT imaging. When en face retinal sections are made, the high-resolution B-scans of SS-OCT are able to show MAs on a plane similar to that of FA. In contrast, SD-OCT would not be able to construct such a high resolution two-dimensional view of the entire macular area with all MAs in one plane. With the much faster point sampling speed of each slab in SS-OCT, the possibility of detecting MAs in the same frame as FA is within reach. Our goals were to determine whether SS-OCT and FA are comparable in detection of MAs in NPDR patients, and to explore if SS-OCT is a viable, noninvasive alternative to FA for the diagnosis of NPDR.
Patients and methods
A prospective comparison of FA and SS-OCT images in patients with NPDR was performed after approval from the Stanford University Human Subjects Institutional Review Board. Written informed consent was obtained from all participants after explaining the nature and potential consequences of the study. All research was performed in accordance with the Declaration of Helsinki, the Health Insurance Portability and Accountability Act, and all local, regional, and national laws.
For the purposes of this study, patients were classified as having NPDR if one or more MAs were detected on dilated fundus examination and/or FA. SS-OCT images were acquired in 17 eyes with NPDR using a prototype SS-OCT device (Carl Zeiss Meditec, Inc., Dublin, CA, USA) with a laser wavelength centered at 1,060 nm and an acquisition speed of 100,000 A-scans/s. 3×3×3 mm3 raster scans were obtained centered on the fovea (512 A-scans/B-scan, 512 B-scans/cube, 1,500 pixels of depth). Sequential patients who presented with NPDR to the Byers Eye Institute at Stanford were prospectively consented and enrolled into this study. Sequential restricted summed voxel projections, or “slabs”, were created with a thickness of 4 μm through the cube and the images registered with intravenous FA images were obtained at the same visit. Registration was accomplished by manual alignment of retinal vessels identified on the FA and the SS-OCT slabs. MAs were identified on SS-OCT slabs as highly reflective circular structures and were correlated to MAs identified on early frame FA images within the area of the FA that was registered to the OCT field of view (a 3×3 mm2 area centered on the fovea). Representative images are shown in Figure 1.
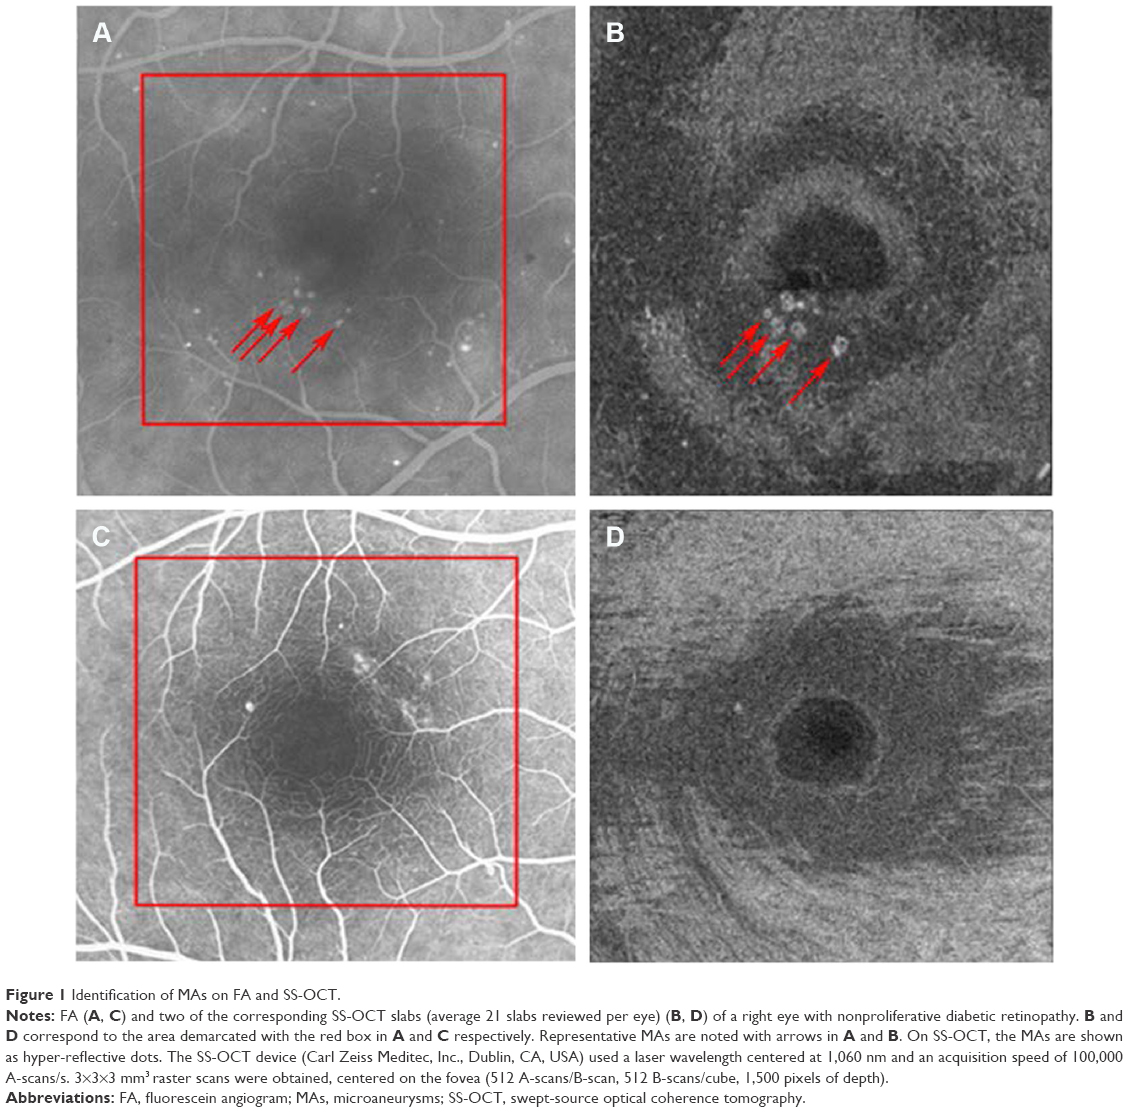 | Figure 1 Identification of MAs on FA and SS-OCT. |
Number of MAs detected on FA was then compared to number of MAs detected on SS-OCT for the same area in the eye, and the number of MAs on the two detecting devices was compared using Wilcoxon rank sum test as well as Wilcoxon rank sum test using the eyes as identification. All tests were performed on JMP statistical analysis software (JMP®, Version 11. SAS Institute Inc., Cary, NC, USA, 1989–2007). P<0.05 was taken as significant.
Results
MAs were identified in SS-OCT slabs in 15 of 17 eyes, resulting in a NPDR diagnosis rate of 88% compared to the 100% by FA (the gold standard). MAs were not observed to be associated with retinal edema or fluorescein pooling or leakage. A mean of 20.9 slabs (SD 3.0) were analyzed in each eye. The mean number of MAs identified on each FA was 11.7 (SD 11.9, range 1–38). The mean number of MAs identified via SS-OCT slabs was 8.1 per cube (SD 9.3, range 0–30). The two cases with no SS-OCT MA detection had only one MA identified on FA. Ultimately, the total number of MAs detected on SS-OCT was 68.8% of the total number of MAs identified on FA. This value was calculated by taking MAs detected on FA as the denominator, and total MAs detected on SS-OCT as the numerator (Table 1).
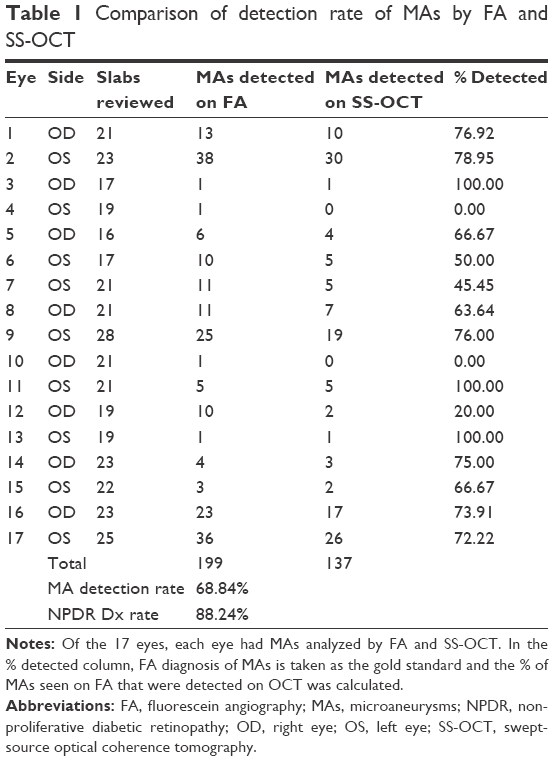 | Table 1 Comparison of detection rate of MAs by FA and SS-OCT |
Overall, SS-OCT and FA are able to detect a similar number of MAs if judged by comparing the detected number of MA across the eyes. However, if judged by detecting MAs as a whole, SS-OCT consistently detected less than FA detected (Wilcoxon rank sum test, P=0.0009) with SS-OCT detecting a mean of 3.65 fewer MAs. This translates to an overall MA detection rate of 68.8% as compared with FA. FA is thus able to pick up slightly more total MA than SS-OCT, on average, three more MAs for a given eye. However, the difference was not statistically significant, as the Wilcoxon rank sum test yielded a P-value of 0.2995. Eyes with a large number of MAs tended to have a larger difference in the number of MAs detected on SS-OCT and FA. Therefore, although SS-OCT may be useful for diagnosing the presence of NPDR when few MAs are present, use of SS-OCT to stage NPDR should take into account that total MAs in the eye may need to be adjusted to account for the relationship between MAs seen on OCT versus on FA.
Discussion
FA has been the established method for detecting MAs for the diagnosis of NPDR for many years. However, this technique is invasive and some patients cannot undergo this examination due to general health conditions.8,17 In the last decade, there have been reports of successfully using SD-OCT to detect MAs in NPDR.12–14 In particular, these groups found that SD-OCT correlated well to FA findings of MAs characteristic of NPDR. With technology moving toward noninvasive diagnostic techniques, OCT has proven to be a promising method to further investigate for diagnosis of NPDR.
This study examined whether the SS-OCT might be an alternative method to detect MAs for the diagnosis of NPDR. After analyzing MAs on FA and SS-OCT for each eye, it was determined that the two methods are comparable, with an overall SS-OCT NPDR diagnosis rate of 88% when using FA detection as the gold standard for comparison. On average, three to four fewer MAs were detected on SS-OCT than on FA, and there was no statistically significant difference in total number of MAs detected between the two devices. Thus, SS-OCT has the benefit of being able to detect MAs at a level close to using FA, while also having the benefit of being a less invasive process.
The draw of SS-OCT extends beyond its noninvasive nature. SS-OCT is able to detect MAs that may go unnoticed on FA because SS-OCT also allows us to detect MAs that do not have flow in them. In clinical practice, an MA can be confused with an intraretinal dot hemorrhage (which would appear as blocking on an FA and be missed by FA). FA and the less-invasive OCT angiography (OCTA) can both identify an MA if the MA has active blood flow through it (ie, it fluoresces on FA, whereas a stagnant dot hemorrhage will not). However, if the MA is one that lacks active blood flow – for example, a “clogged” MA – then it will not show on FA or on OCTA but will show on SS-OCT.18 SS-OCT can detect the MA because SS-OCT detects the light reflectivity index of various tissues instead of active blood flow. Even without flow, an empty MA will still appear on SS-OCT since it is still an extension of a blood vessel, which by nature will have greater reflectivity than surrounding retina.
Furthermore, SS-OCT is also novel compared to older methods of using SD-OCT to detect MA due to its high scan speed of 100,000 A-scans/s, compared to SD-OCTs ranging from 27,000 to 85,000 A-scans/s. Each A-scan is an image produced along the depth direction at one position of the scanned beam. Neighboring A-scans are then summed to produce an en face B-scan, with a similar view of the retina as in FA (note: B-scans can also be used to compose a planar cross-sectional view). The higher the A-scan speed, the easier it is to achieve high resolution in the ultimate B-scan image. The higher resolution of SS-OCT imaging allows for more accurate 3D reconstruction of the retina and choroid images. Smaller MAs that would have slipped through due to a slower A-scan speed in SD-OCT are more likely to be caught on SS-OCT with the better A-scan sampling, potentially diagnosing NPDR at earlier stages.
This study is the first to use SS-OCT to visualize MAs. To our knowledge, this is also the first study to compare SS-OCT visualization of MAs to FA visualization of MAs. We found that SS-OCT is able to detect comparable number of MAs as FA imaging, and could serve as a valuable and noninvasive tool to aid the diagnosis of NPDR. This is not to say that we should retire use of FA for detection of MAs (after all FA was able to detect more MAs per eye than SS-OCT), but rather that SS-OCT adds a new and interesting dimension in the visualization of FA, potentially revealing different MAs in the same eye that FA could not pick up. Thus, both FA and the novel SS-OCT can be used hand-in-hand for optimal diagnosis of NPDR via MA detection.
Our study is limited by its small sample size, lack of masking, and lack of multiple masked graders for the images. However, we hope that it will set the stage for larger masked studies analyzing the potential role of SS-OCT in noninvasive diagnosis of NPDR. In future studies, we also plan to explore the correlation between SS-OCT, SD-OCT, and FA for the diagnosis of NPDR through visualization of MAs on a large sample size. As OCT imaging technology achieves ever-evolving resolution and noise reduction, we also plan to examine individual MAs and their relative detection on SD-OCT, SS-OCT, FA, and color fundus images. With the further improvement of higher speed point sampling (more slabs within a given thickness), it may also be possible to apply SS-OCT imaging as a biomarker for population-based diabetic retinopathy screening initiatives. We hope that with further research, SS-OCT may someday be used independent of FA as a noninvasive diabetic retinopathy screening tool incorporated into yearly diabetic retinopathy screens. Patients in whom MAs are detected can then be followed closer for diabetic retinopathy management. Although our study shows that a drawback of SS OCT is not detecting as many total MAs as FA, SS-OCT carries the benefit of being less invasive than FA while also being able to diagnose NPDR at rates comparable to FA.
Disclosure
TL has served as a paid consultant to Carl Zeiss Meditec, Inc., the manufacturer of the prototype swept-source optical coherence tomography device used in this study. The authors report no other conflicts of interest in this work.
References
Nunes S, Pires I, Rosa A, Duarte L, Bernardes R, Cunha-Vaz J. Microaneurysm turnover is a biomarker for diabetic retinopathy progression to clinically significant macular edema: findings for type 2 diabetics with nonproliferative retinopathy. Ophthalmologica. 2009;223(5):292–297. | ||
Murakami T, Nishijima K, Sakamoto A, Ota M, Horii T, Yoshimura N. Foveal cystoid spaces are associated with enlarged foveal avascular zone and microaneurysms in diabetic macular edema. Ophthalmology. 2011;118(2):359–367. | ||
Kohner EM, Sleightholm M. Does microaneurysm count reflect severity of early diabetic retinopathy? Ophthalmology. 1986;93(5):586–589. | ||
Kohner EM, Stratton IM, Aldington SJ, Turner RC, Matthews DR. Microaneurysms in the development of diabetic retinopathy (UKPDS 42). UK Prospective Diabetes Study Group. Diabetologia. 1999;42(9):1107–1112. | ||
Klein R, Meuer SM, Moss SE, Klein BE. Retinal microaneurysm counts and 10-year progression of diabetic retinopathy. Arch Ophthalmol. 1995;113(11):1386–1391. | ||
Bernardes R, Nunes S, Pereira I, et al. Computer-assisted microaneurysm turnover in the early stages of diabetic retinopathy. Ophthalmologica. 2009;223(5):284–291. | ||
Goatman KA, Cree MJ, Olson JA, Forrester JV, Sharp PF. Automated measurement of microaneurysm turnover. Invest Ophthalmol Vis Sci. 2003;44(12):5335–5341. | ||
Lipson BK, Yannuzzi LA. Complications of intravenous fluorescein injections. Int Ophthalmol Clin. 1989;29(3):200–205. | ||
Ergun E, Hermann B, Wirtitsch M, et al. Assessment of central visual function in Stargardt’s disease/fundus flavimaculatus with ultrahigh-resolution optical coherence tomography. Invest Ophthalmol Vis Sci. 2005;46(1):310–316. | ||
Ko TH, Fujimoto JG, Duker JS, et al. Comparison of ultrahigh- and standard-resolution optical coherence tomography for imaging macular hole pathology and repair. Ophthalmology. 2004;111(11):2033–2043. | ||
Paunescu LA, Ko TH, Duker JS, et al. Idiopathic juxtafoveal retinal telangiectasis: new findings by ultrahigh-resolution optical coherence tomography. Ophthalmology. 2006;113(1):48–57. | ||
Horii T, Murakami T, Nishijima K, Sakamoto A, Ota M, Yoshimura N. Optical coherence tomographic characteristics of microaneurysms in diabetic retinopathy. Am J Ophthalmol. 2010;150(6):840–848. | ||
Wang H, Chhablani J, Freeman WR, et al. Characterization of diabetic microaneurysms by simultaneous fluorescein angiography and spectral-domain optical coherence tomography. Am J Ophthalmol. 2012;153(5):861–867.e1. | ||
Yeung L, Lima VC, Garcia P, Landa G, Rosen RB. Correlation between spectral domain optical coherence tomography findings and fluorescein angiography patterns in diabetic macular edema. Ophthalmology. 2009;116(6):1158–1167. | ||
Drexler W. Ultrahigh-resolution optical coherence tomography. J Biomed Opt. 2004;9(1):47–74. | ||
Michalewska Z, Michalewski J, Nawrocki J. Swept-source OCT. Retina Today. 2013:50–56. | ||
Hutchinson A, McIntosh A, Peters J, et al. Effectiveness of screening and monitoring tests for diabetic retinopathy – a systematic review. Diabet Med. 2000;17(7):495–506. | ||
Matsunaga DR, Yi JJ, De Koo LO, Ameri H, Puliafito CA, Kashani AH. Optical coherence tomography angiography of diabetic retinopathy in human subjects. Ophthalmic Surg Lasers Imaging Retina. 2015;46(8):796–805. |
 © 2016 The Author(s). This work is published and licensed by Dove Medical Press Limited. The
full terms of this license are available at https://www.dovepress.com/terms
and incorporate the Creative Commons Attribution
- Non Commercial (unported, 3.0) License.
By accessing the work you hereby accept the Terms. Non-commercial uses of the work are permitted
without any further permission from Dove Medical Press Limited, provided the work is properly
attributed. For permission for commercial use of this work, please see paragraphs 4.2 and 5 of our Terms.
© 2016 The Author(s). This work is published and licensed by Dove Medical Press Limited. The
full terms of this license are available at https://www.dovepress.com/terms
and incorporate the Creative Commons Attribution
- Non Commercial (unported, 3.0) License.
By accessing the work you hereby accept the Terms. Non-commercial uses of the work are permitted
without any further permission from Dove Medical Press Limited, provided the work is properly
attributed. For permission for commercial use of this work, please see paragraphs 4.2 and 5 of our Terms.