Back to Journals » Cancer Management and Research » Volume 10
Nomograms to predict overall survival and cancer-specific survival in patients with adrenocortical carcinoma
Authors Li Y ![]() , Bian XH, Ouyang JY
, Bian XH, Ouyang JY ![]() , Wei SY
, Wei SY ![]() , He MZ, Luo ZL
, He MZ, Luo ZL ![]()
Received 11 September 2018
Accepted for publication 24 October 2018
Published 13 December 2018 Volume 2018:10 Pages 6949—6959
DOI https://doi.org/10.2147/CMAR.S187169
Checked for plagiarism Yes
Review by Single anonymous peer review
Peer reviewer comments 2
Editor who approved publication: Dr Chien-Feng Li
Yan Li,1 Xiaohui Bian,2 Junyu Ouyang,2 Shuyi Wei,2 Meizhi He,2 Zelong Luo1
1Department of Oncology, Zhujiang Hospital of Southern Medical University, Guangzhou, Guangdong, China; 2The Second School of Clinical Medicine, Southern Medical University, Guangzhou, Guangdong, China
Purpose: To develop nomogram models to predict individualized estimates of overall survival (OS) and cancer-specific survival (CSS) in patients with adrenocortical carcinoma (ACC).
Patients and methods: A total of 751 patients with ACC were identified within the Surveillance Epidemiology, and End Results (SEER) database between 1973 and 2015. The predictors comprised marital status, sex, age at diagnosis, year of diagnosis, laterality, histologic grade, ethnicity, historic stage, radiation therapy, chemotherapy, and surgery of primary site. Based on the results of the multivariate logistic regression analyses, the nomogram models were used for predicting OS and CSS in patients with ACC. The nomograms were tested using concordance index (C-index) and calibration curves.
Results: In univariate and multivariate analyses of OS, OS was significantly associated with age at diagnosis, year of diagnosis, histologic grade, historic stage, and chemotherapy. In univariate and multivariate analyses of CSS, age at diagnosis, year of diagnosis, historic stage, and chemotherapy were the independent risk factors with CSS. These characteristics were included in the nomograms predicting OS and CSS. The nomograms demonstrated good accuracy in predicting OS and CSS, with the C-index of 0.677 and 0.672.
Conclusion: These clinically useful tools predicted OS and CSS in patients with ACC using readily available clinicopathologic factors and could aid individualized clinical decision making.
Keywords: adrenocortical carcinoma, nomogram, overall survival, cancer-specific survival
Introduction
Adrenocortical carcinoma (ACC) is a rare and typically aggressive malignancy with a poor prognosis. The estimated incidence of ACC is 1–2 cases per million populations per year leading to 0.2% of all cancer deaths in the United States.1 However, ACC is a quite heterogeneous disease. Consequently, the clinical outcome widely differs for any given tumor stage. For example, most patients with an advanced stage of disease had a median survival time of fewer than 12 months, even after complete tumor resection,2 while some patients might enjoy long-term remissions which lasted up to 8 years.3 Therefore, an accurate prognostic indicator is necessary to guide patients in individualized clinical decision making. According to patient and tumor characteristics, we established the nomogram models to provide individualized estimates of survival in patients with ACC using the Surveillance Epidemiology, and End Results (SEER) database, which is one of the largest population-based cancer databases.
Patients and methods
Data source
The SEER database was used to identify patients diagnosed with ACC from 1973 to 2015. SEER collects cancer incidence data from population-based cancer registries covering approximately 34.6% of the US population.4 The information in the SEER database is accrued from 18 regional cancer registries, including information on patients’ demographic, cancer diagnosis, and treatment, as well as the cause of death.4
Study population
We selected patients with positive histology of ACC (International Classification of Diseases for Oncology, third edition site codes: C740 and C749, and histologic subtype code: 8370). Then, the screening conditions were as follows: first and only malignant tumor, unilateral tumor. Patients whose death was reported by autopsy only or death certification only or who had an unknown marital status were excluded. These criteria resulted in 751 records (Figure 1).
 | Figure 1 Flow chart for creation of the SEER data set. Abbreviations: ICD-O, International Classification of Diseases for Oncology; SEER, Surveillance Epidemiology and End Results; OS, overall survival; CSS, cancer specific survival. |
Study variables
The characteristics analyzed were marital status, sex, age at diagnosis, year at diagnosis, laterality, histologic grade, ethnicity, primary tumor size, historic stage, treatment modality (surgery, chemotherapy, radiotherapy), the cause of death, and survival months. Overall survival (OS) and cancer-specific survival (CSS) were the endpoint outcomes of the study. OS was determined from the vital status recode and was defined as the time from diagnosis until death. CSS was determined from the SEER cause-specific death classification and was defined as the time from diagnosis until death because of ACC.
Statistical analyses
The clinicopathologic characteristics were categorized. In this study, the univariate logistic regression analyses were used to identify the characteristics which were significantly associated with OS and CSS. In the univariate analyses, hazard ratios (HRs) were calculated per one standard deviation increase in predictor variables. Characteristics with P<0.05 were included in the multivariate logistic regression model. Then, we used a backward stepwise logistic regression to find the optimal multivariate model where all contained characteristics were statistically significant with P<0.05. Kaplan–Meier survival analysis5 with a log-rank test6 was used to demonstrate differences in survival between patient groups for all characteristics, including OS and CSS. The HR and 95% CI were used to evaluate the strength of association between each characteristics and OS or CSS. Based on the results of the multivariate logistic regression analyses, nomograms for 1-, 3-, and 5-year OS and CSS were performed, which was constructed as a visualizing aid to obtain predicted values manually from the multivariate logistic regression models. The performance of the nomograms was measured by concordance index (C-index), which was a measure of discriminative ability that quantified the proportion of all patient pairs. A C-index of 0.5 indicated no predictive ability, whereas a C-index of 1.0 indicated perfect discrimination. Additionally, calibration curves were provided to evaluate the performance of the nomograms based on the logistic regression models. We used the bootstrap validation method to estimate the predictive accuracy of the nomograms by using 200 bootstrap resamples. All data analyses were performed by using SAS (version 9.4; SAS Institute Inc., Cary, NC, USA) and R software (version 3.2.3), and all calculations were performed by using SPSS (version 24.0; IBM Corporation, Armonk, NY, USA). All tests were two-sided, and P<0.05 was considered statistically significant.
Results
Patient characteristics
The demographic, clinical, and pathologic characteristics of 751 patients with ACC are listed in Table 1. Marital status included married (n=448, 59.65%) and unmarried (n=303, 40.35%). The population consisted of 424 (56.46%) female and 327 (43.54%) male patients. As for age at diagnosis, more than 70% of the cases were diagnosed between 40 and 89 years of age, and there was a single peak that was seen in the fourth, fifth, and sixth decades of life (Figure 2). The number of cases increased over the years of study from 175 (23.30%) in 1973–1987 to 319 (42.78%) in 2002–2015. The locations of the lesions were similar, with 399 (53.13%) cases left and 352 (46.87%) cases right. Most cases were with an unknown grade (n=584, 77.76%), followed by grade III and IV (n=105, 13.98%), grade I and II (n=62, 8.26%). The main ethnicity was the white ethnicity (n=631, 84.02%). According to the SEER staging system, 202 (26.90%) patients presented with localized disease, followed by distant metastatic disease (n=160, 21.31%) and regional disease (n=96, 12.78%), additionally, the number of patients with unknown stage was 293 (39.01%). Treatment modality consisted of surgery, chemotherapy, and radiation therapy. Surgery included surgery of primary site (n=308, 41.01%), no surgery of primary site (n=87, 11.58%), and unknown (n=356, 47.41%). Of 751 patients, 124 (16.51%) patients received radiation therapy and 627 (83.49%) did not receive radiation therapy or unknown. 173 patients received chemotherapy, while 491 (65.38%) patients not or unknown.
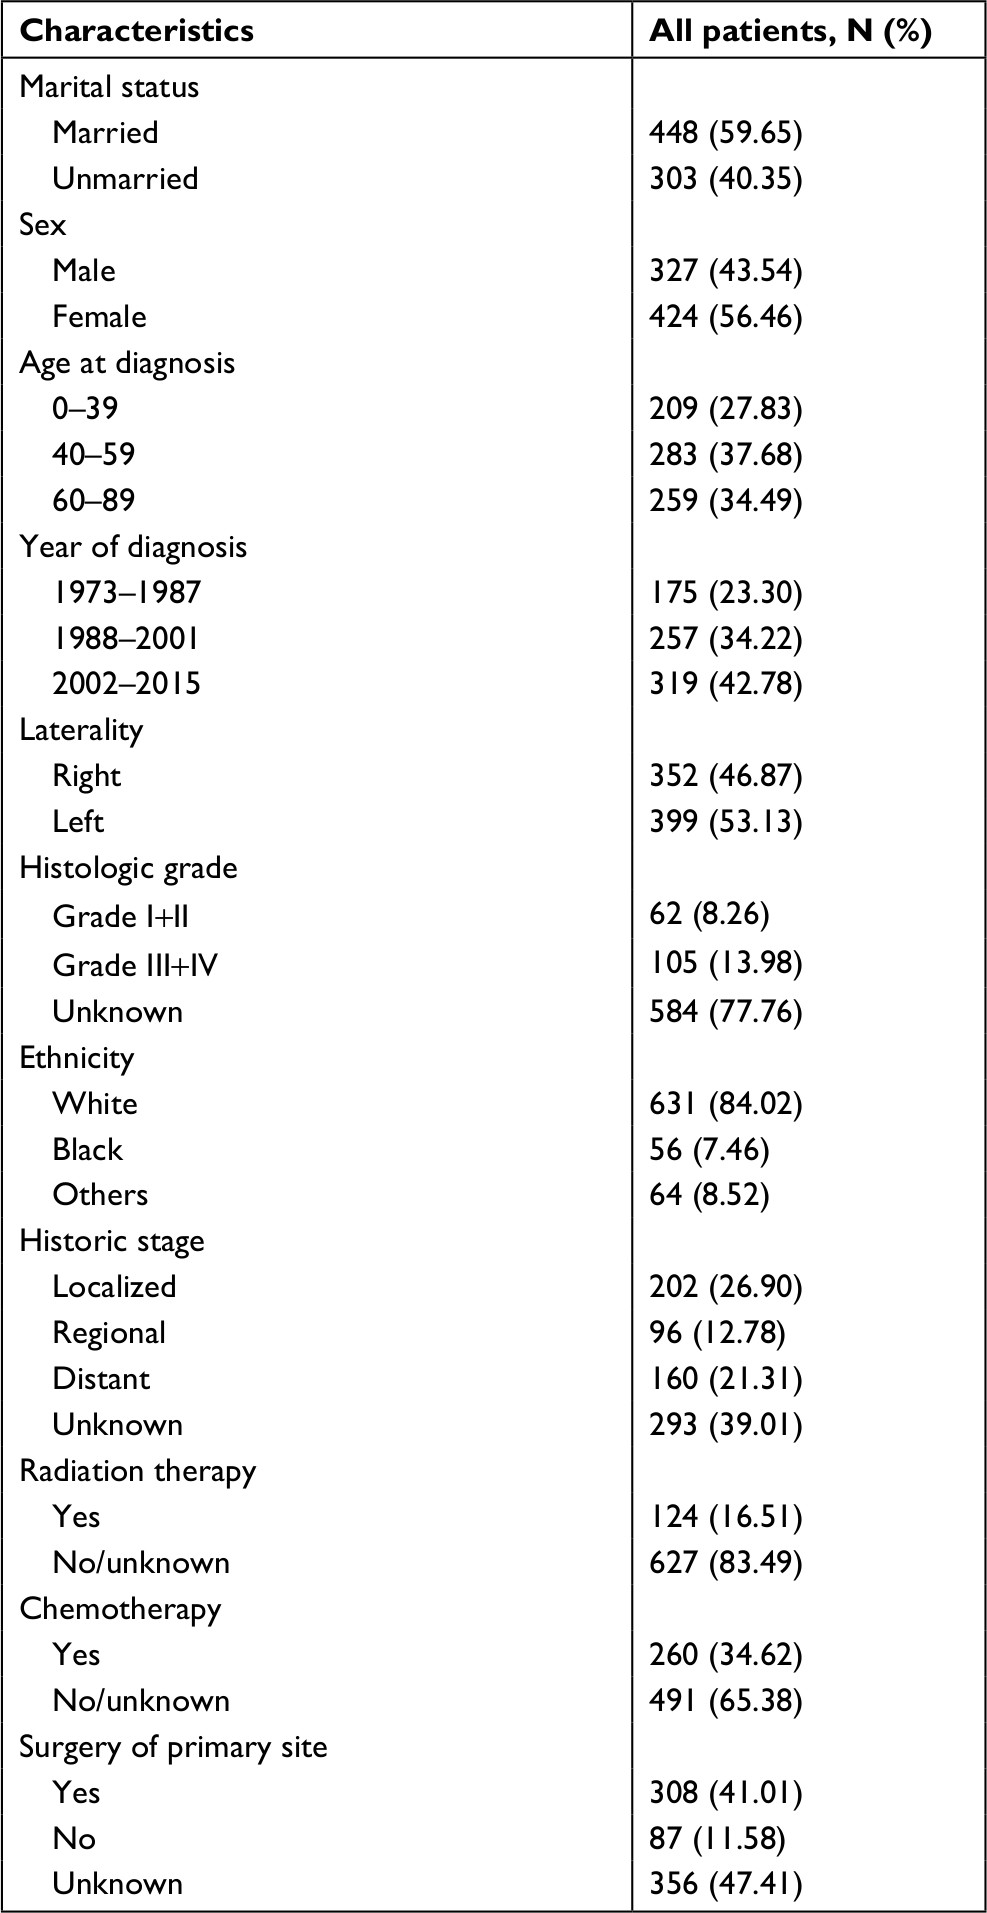 | Table 1 Demographics, clinical, and pathologic characteristics of 751 patients with adrenocortical carcinoma |
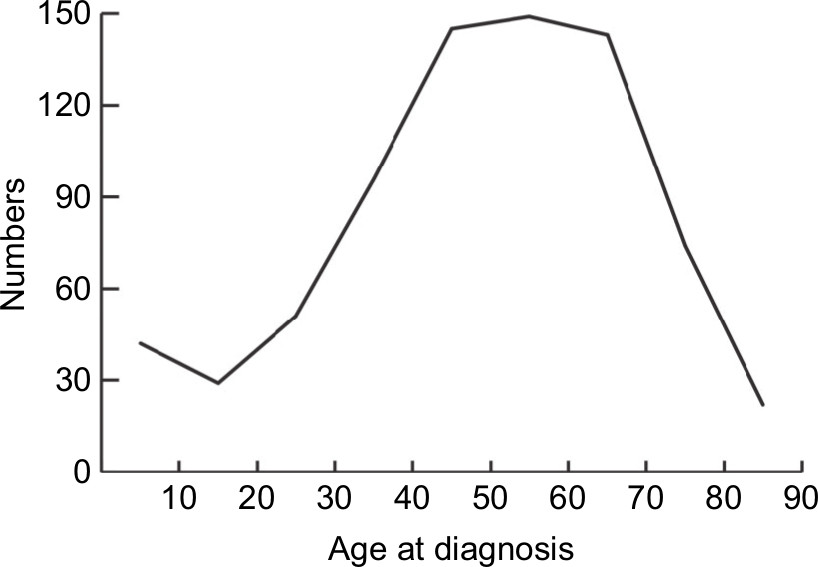 | Figure 2 Number of patients diagnosed in each age group with ACC. Abbreviation: ACC, adrenocortical carcinoma. |
Factors associated with OS
Table 2 shows the univariate and multivariate analyses of OS. In the univariate analysis, OS was significantly associated with age at diagnosis (P<0.001), year of diagnosis (P<0.001), histologic grade (P=0.002), historic stage (P<0.001), chemotherapy (P=0.017), and surgery of primary site (P=0.009). Conversely, OS was not significantly associated with marital status, sex, laterality, ethnicity, and radiation therapy. As for the multivariate analysis, the independent prognostic factors were age at diagnosis (P<0.001), year of diagnosis (P<0.001), histologic grade (P=0.035), historic stage (P<0.001), and chemotherapy (P=0.001).
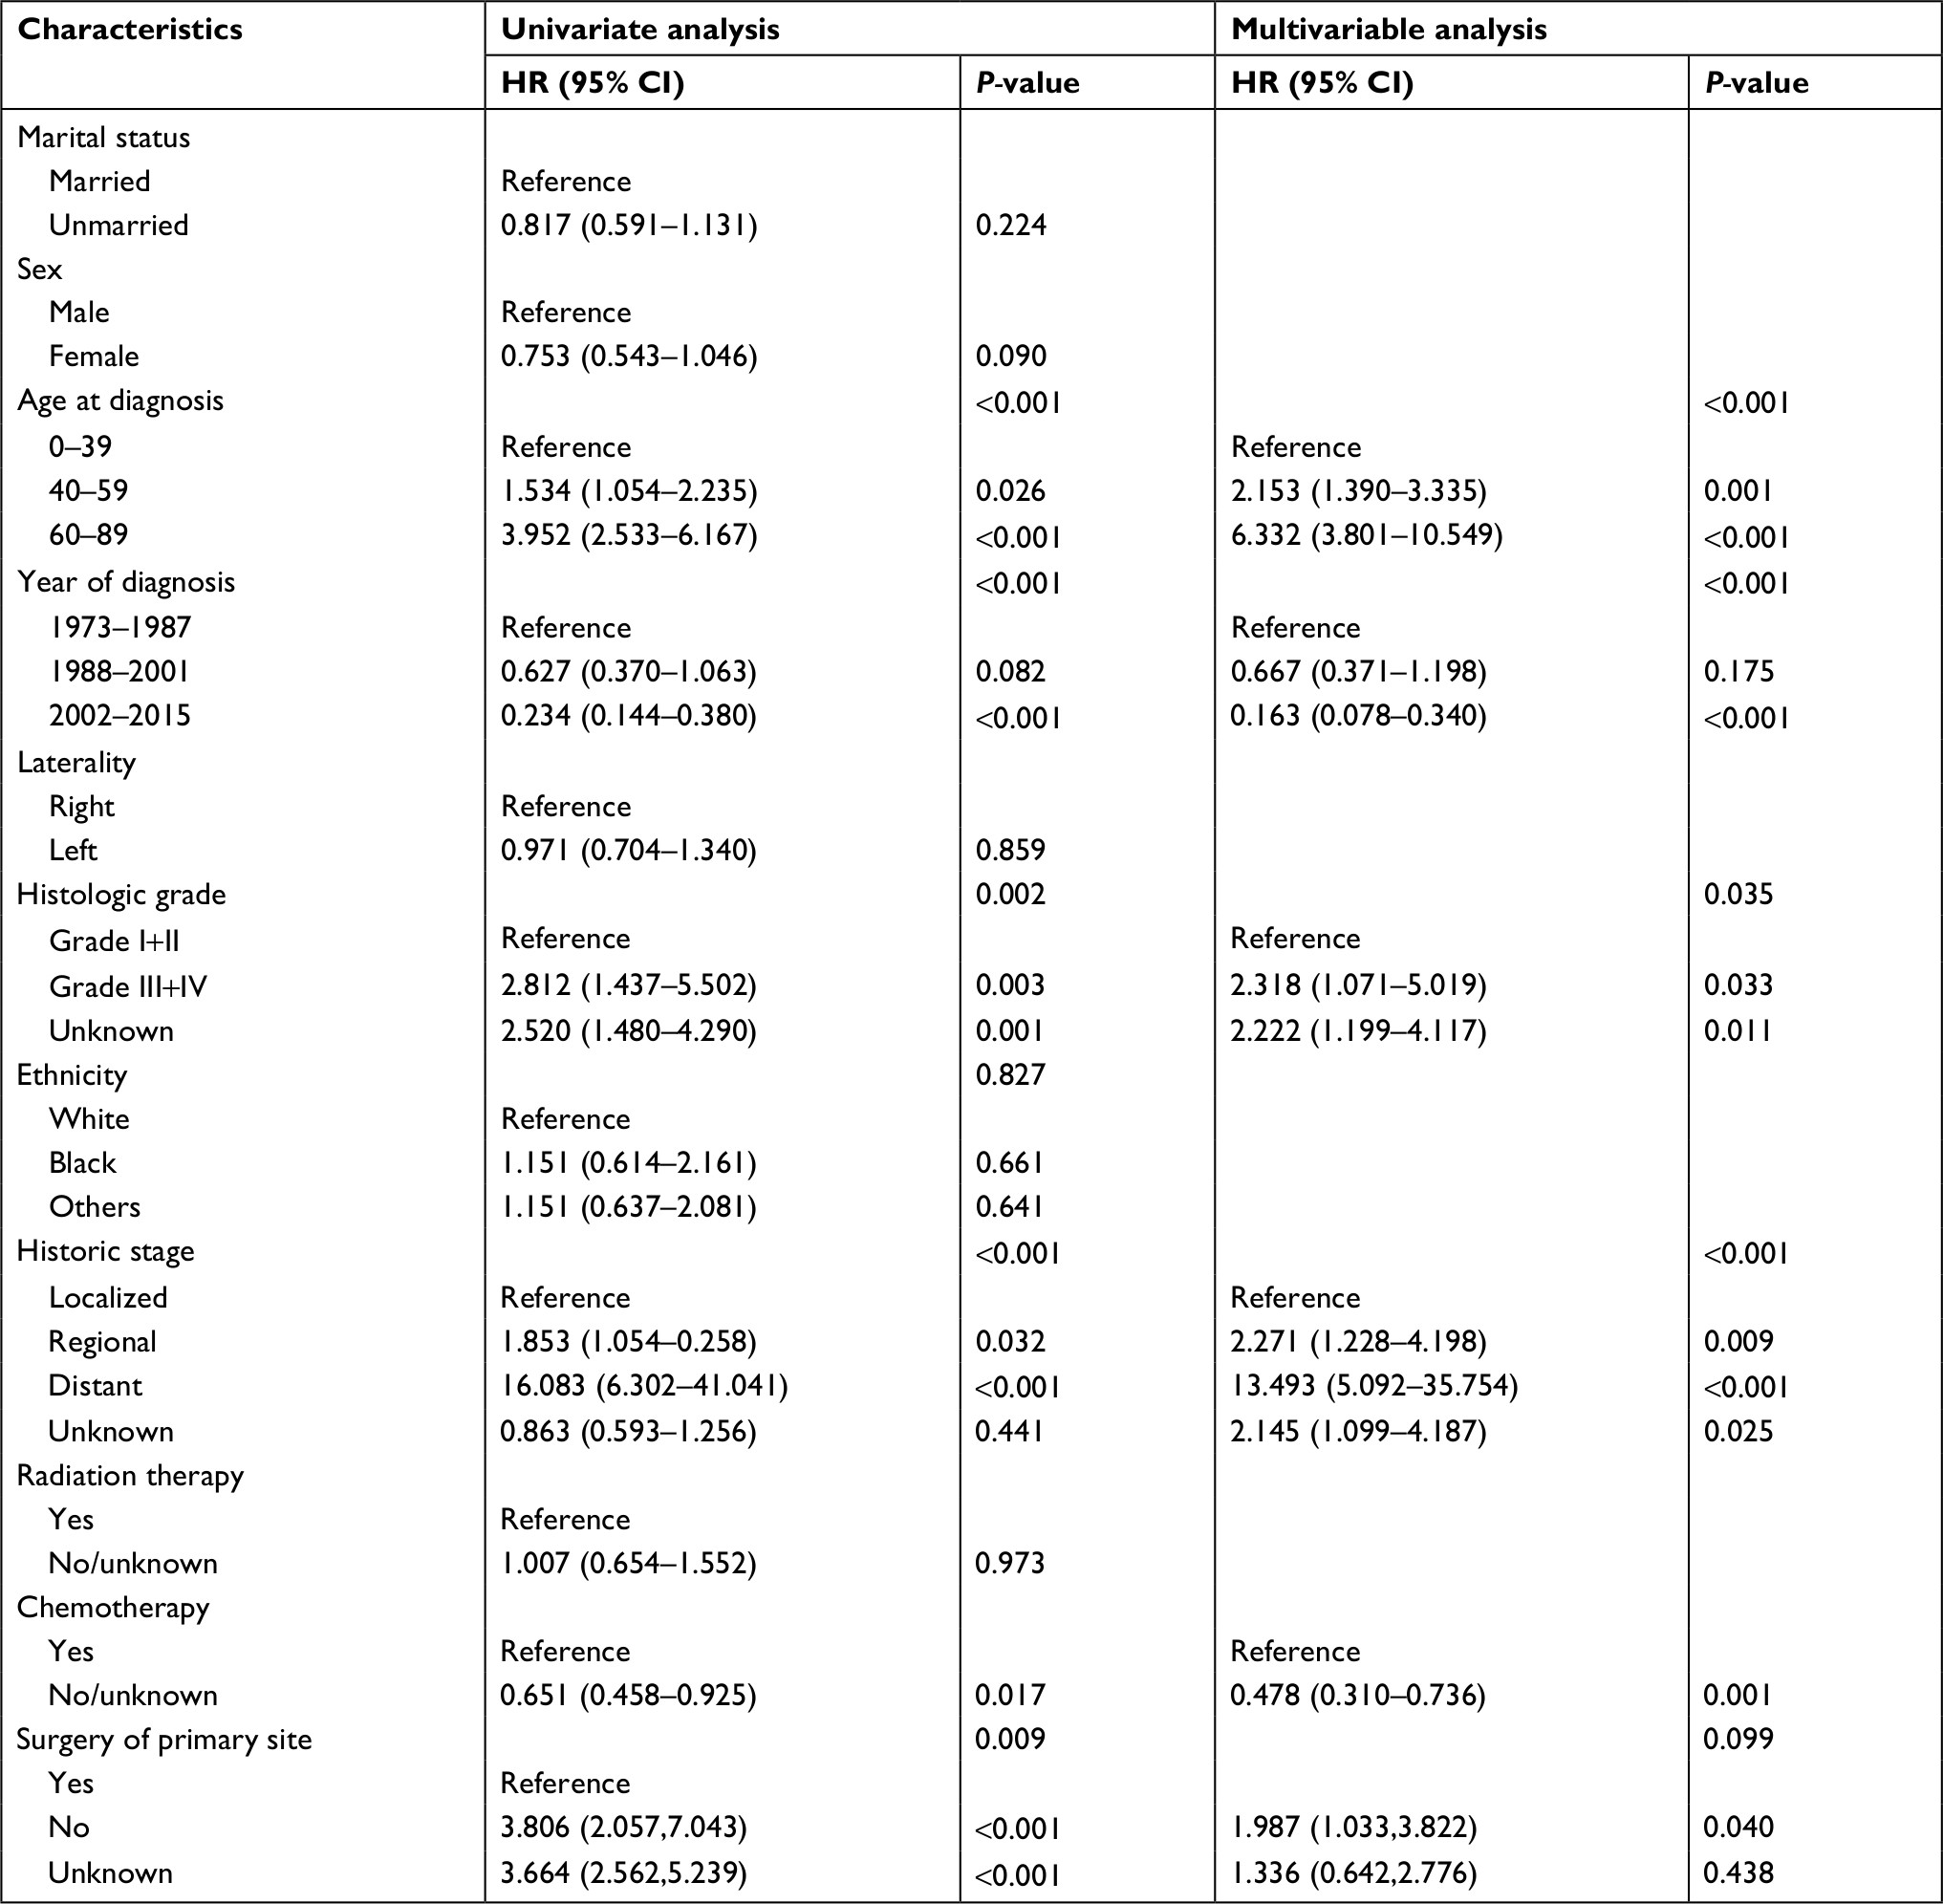 | Table 2 Univariate and multivariate analyses of variables associated with OS Abbreviations: HR, hazard ratio; OS, overall survival. |
As shown in Table 4, the 1-year, 3-year, and 5-year OS differed significantly in age at diagnosis (P<0.001), year of diagnosis (P=0.016), histologic grade (P=0.003), historic stage (P<0.001), chemotherapy (P<0.001), and surgery of primary site (P<0.001). On the contrary, it did not differ significantly across marital status, sex, laterality, ethnicity, and radiation therapy.
Factors associated with CSS
The univariate and multivariate analyses of CSS are listed in Table 3. Based on the univariate analysis, age at diagnosis (P=0.016), year of diagnosis (P<0.001), histologic grade (P=0.013), historic stage (P<0.001), chemotherapy (P<0.001), and surgery of primary site (P<0.001) were significantly associated with CSS. Additionally, marital status, sex, laterality, ethnicity, and radiation therapy were not significantly associated with CSS. In the multivariate analysis, age at diagnosis (P<0.001), year of diagnosis (P=0.006), historic stage (P<0.001), and chemotherapy (P=0.001) were the independent risk factors. In contrast, histologic grade (P=0.099) was not the independent risk factor with CSS.
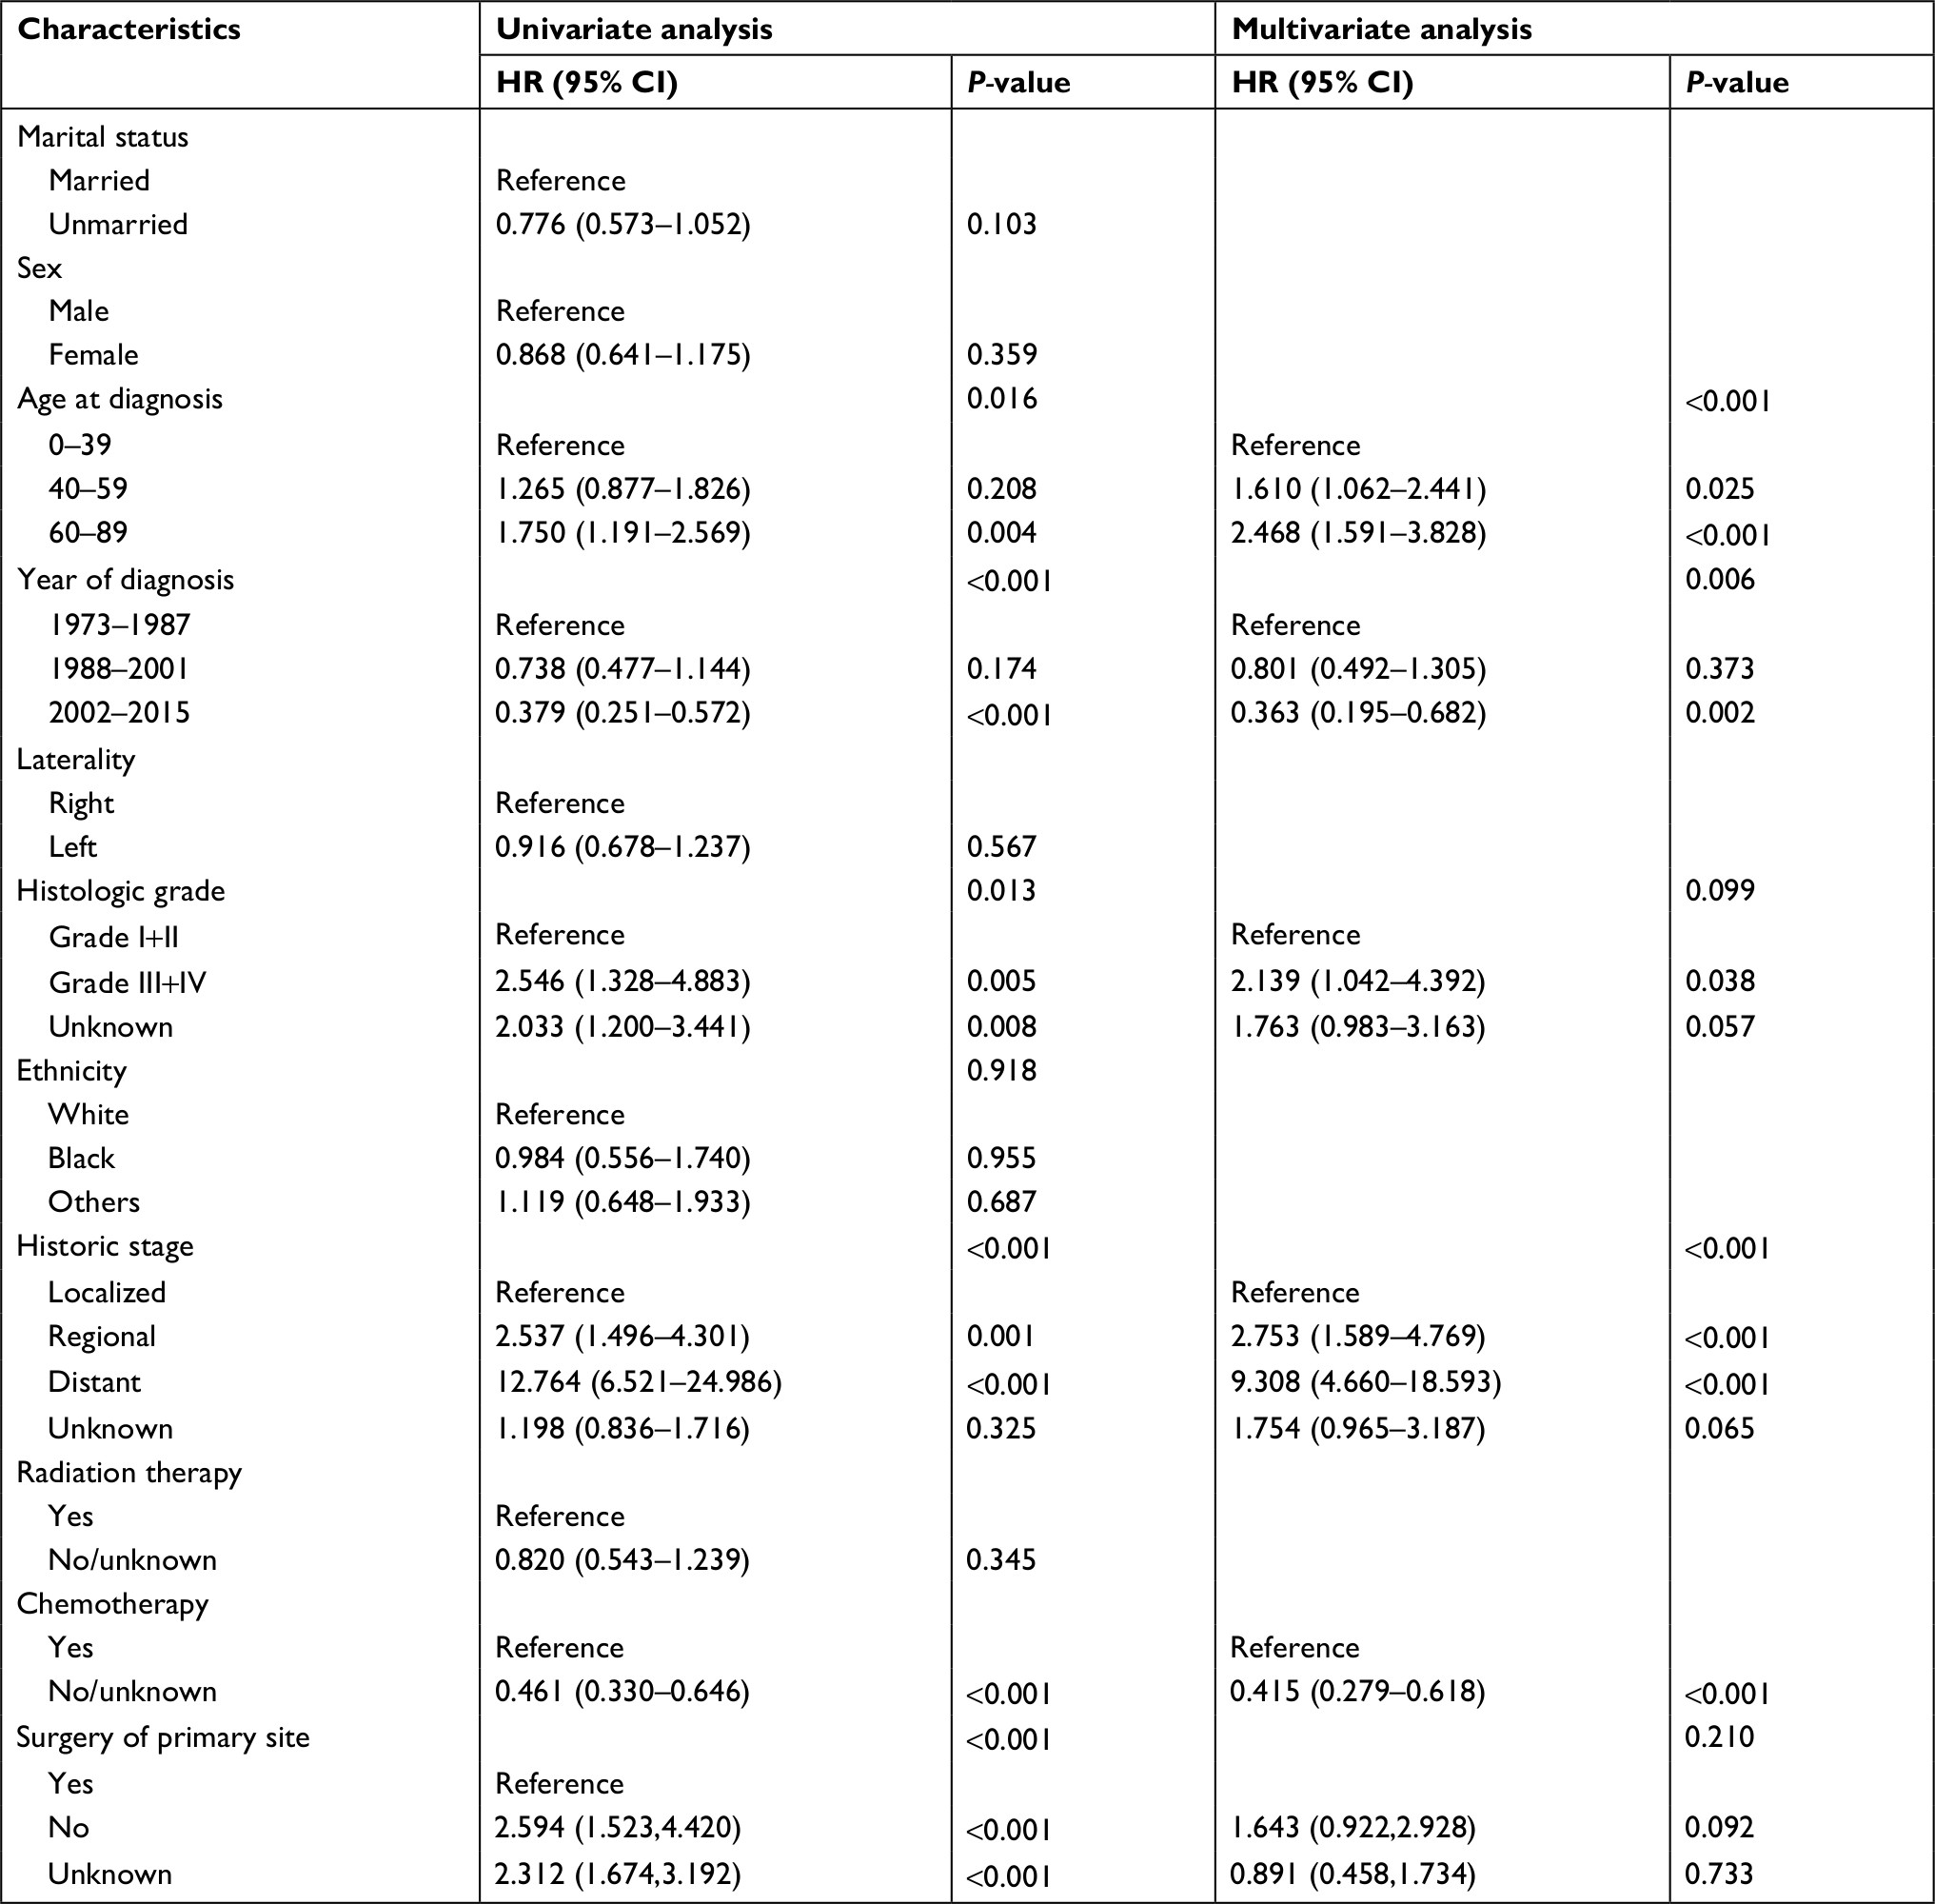 | Table 3 Univariate and multivariate analyses of variables associated with CSS Abbreviations: HR, hazard ratio; CSS, cancer-specific survival. |
As shown in Table 4, the 1-year, 3-year, and 5-year CSS were significantly affected by age at diagnosis (P<0.001), histologic grade (P=0.013), historic stage (P<0.001), chemotherapy (P<0.001), and surgery of primary site (P=0.001). But it did not differ in marital status, sex, year of diagnosis, laterality, ethnicity, and radiation therapy.
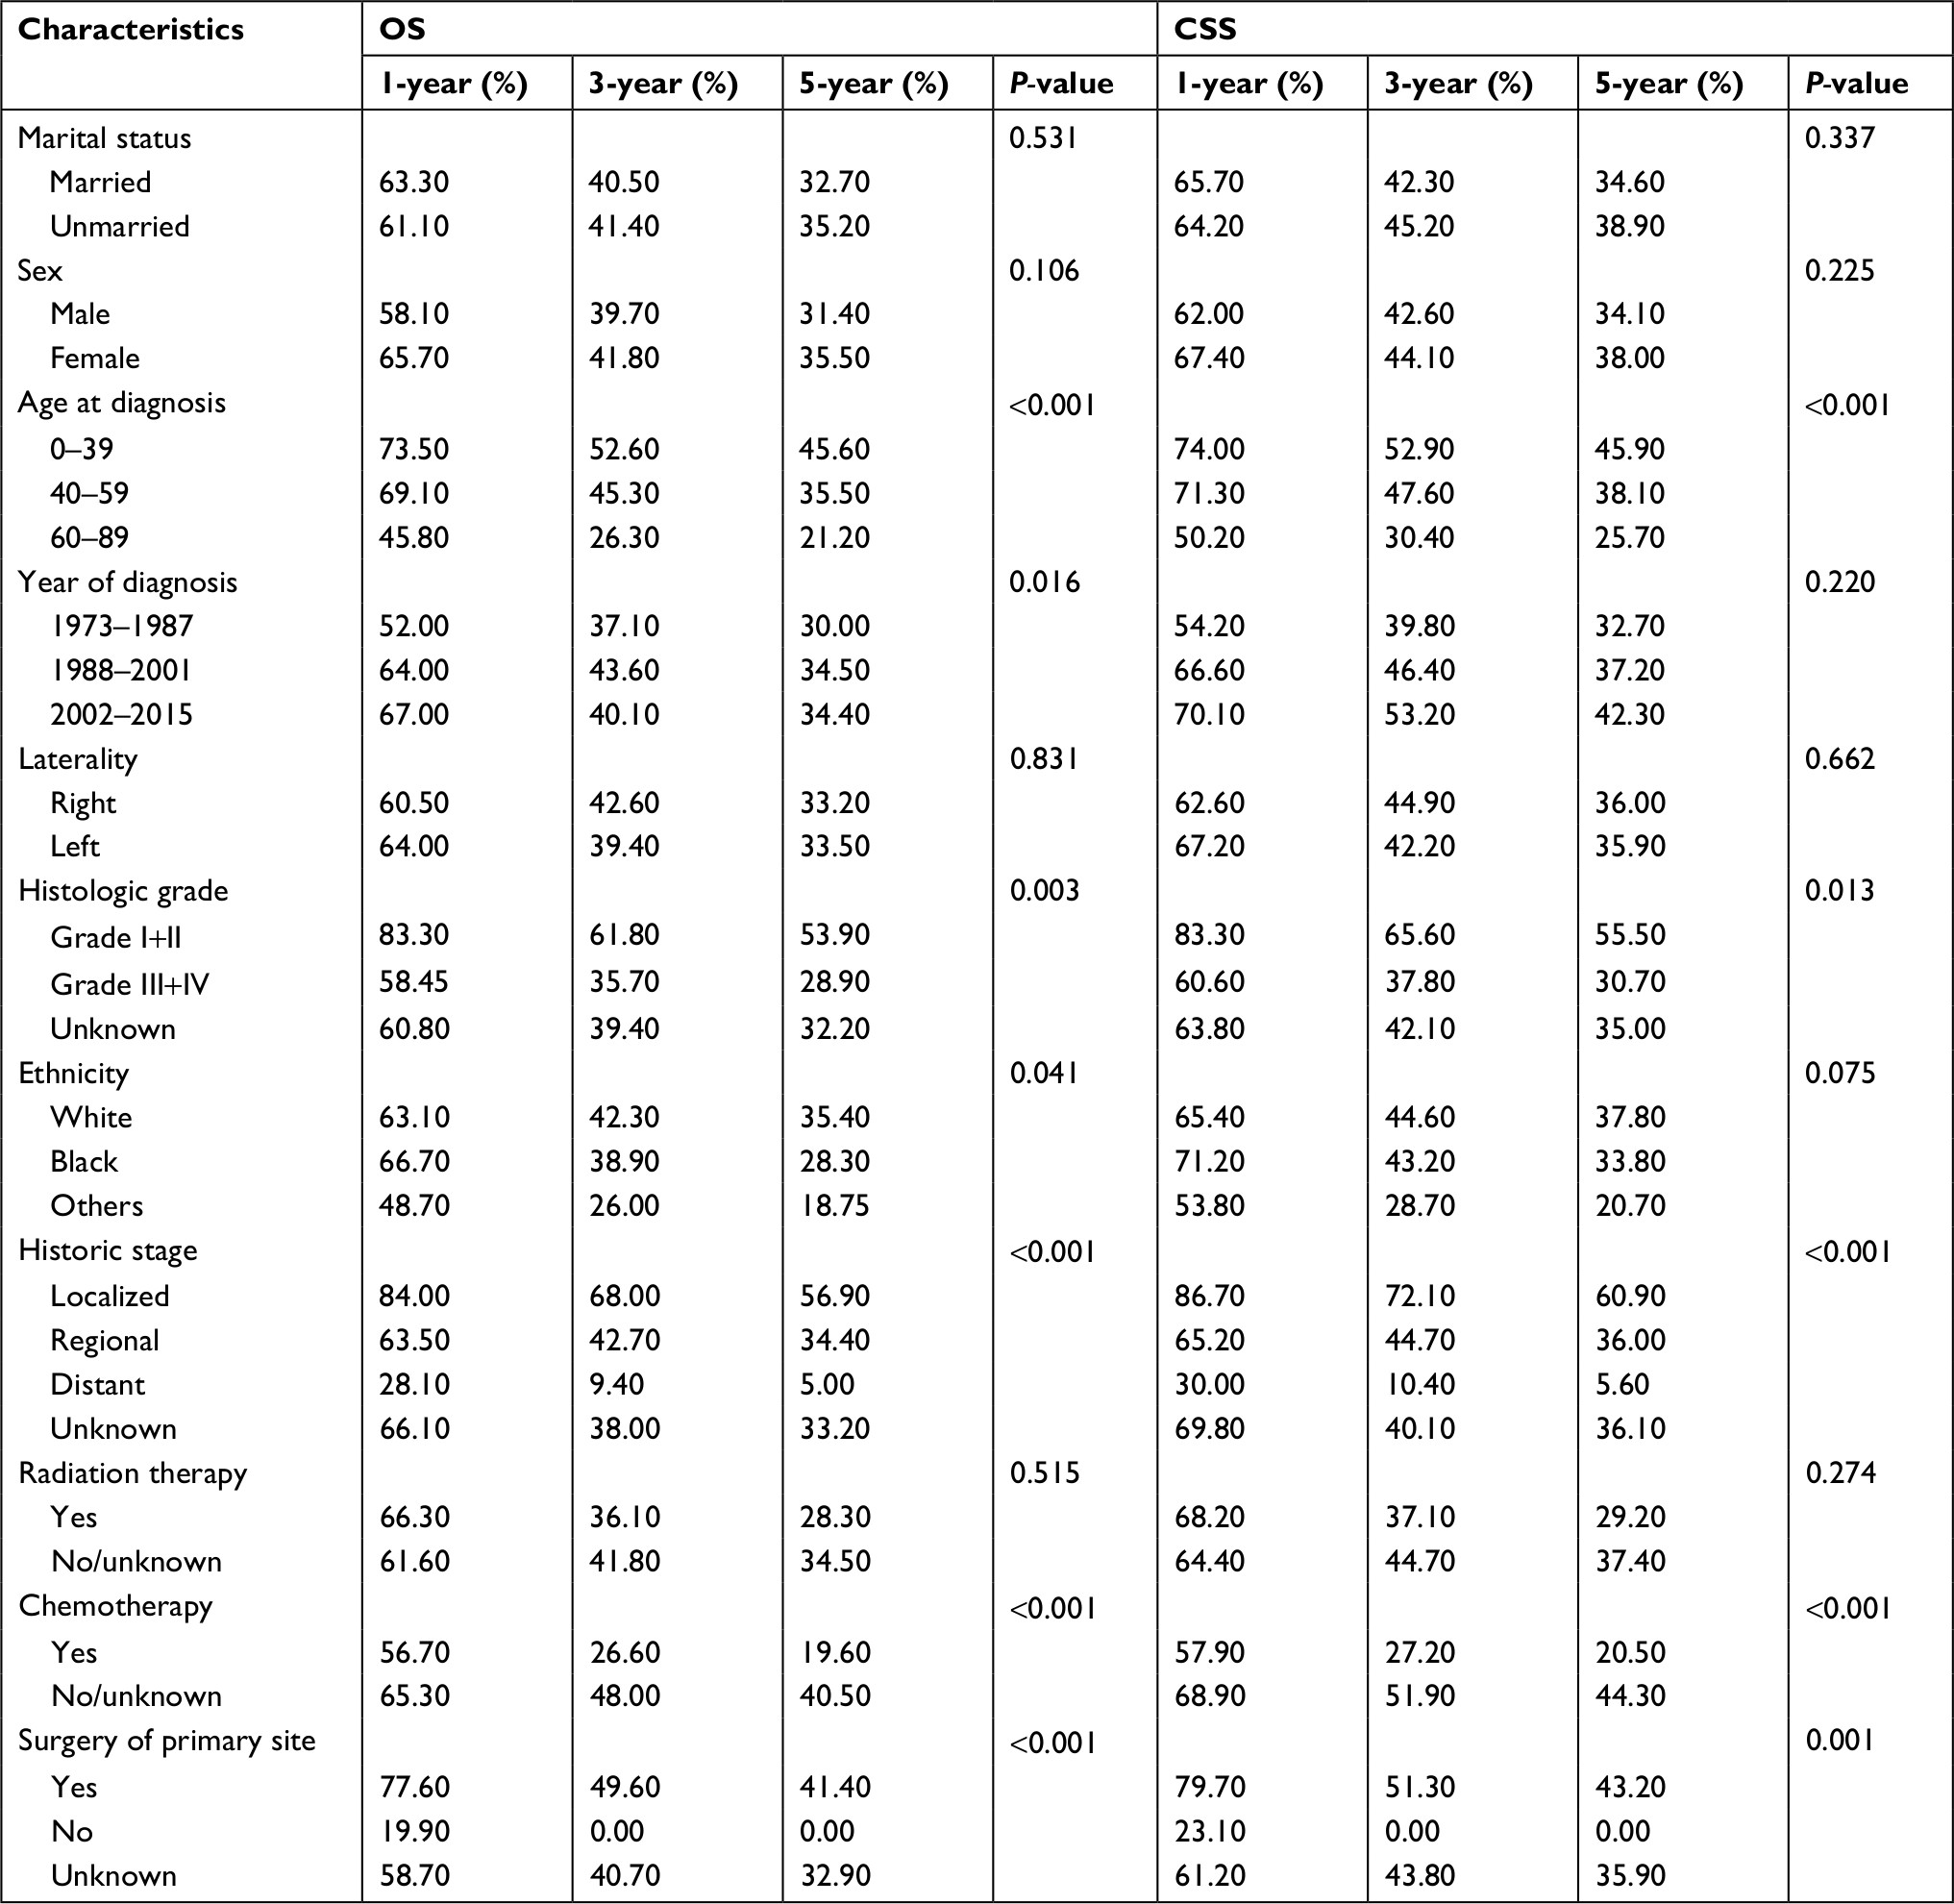 | Table 4 1-year, 3-year, and 5-year OS and CSS in patients with adrenocortical carcinoma Abbreviations: CSS, cancer-specific survival; OS, overall survival. |
Kaplan–Meier curves analyses
The OS and CSS Kaplan–Meier curves are shown in Figure 3. Patients with old age (60–89 years) had worse survival than those with young age. Instead, patients diagnosed in 1988–2001 and 2002–2015 had significantly better survival than in 1973–1987. What is more, patients who had distant metastatic disease and whose tumors were poorly differentiated or undifferentiated had worse survival. Survival was also worse for patients who underwent chemotherapy. Conversely, survival was much worse for patients who did not have surgery of primary site than patients who had surgery or unknown.
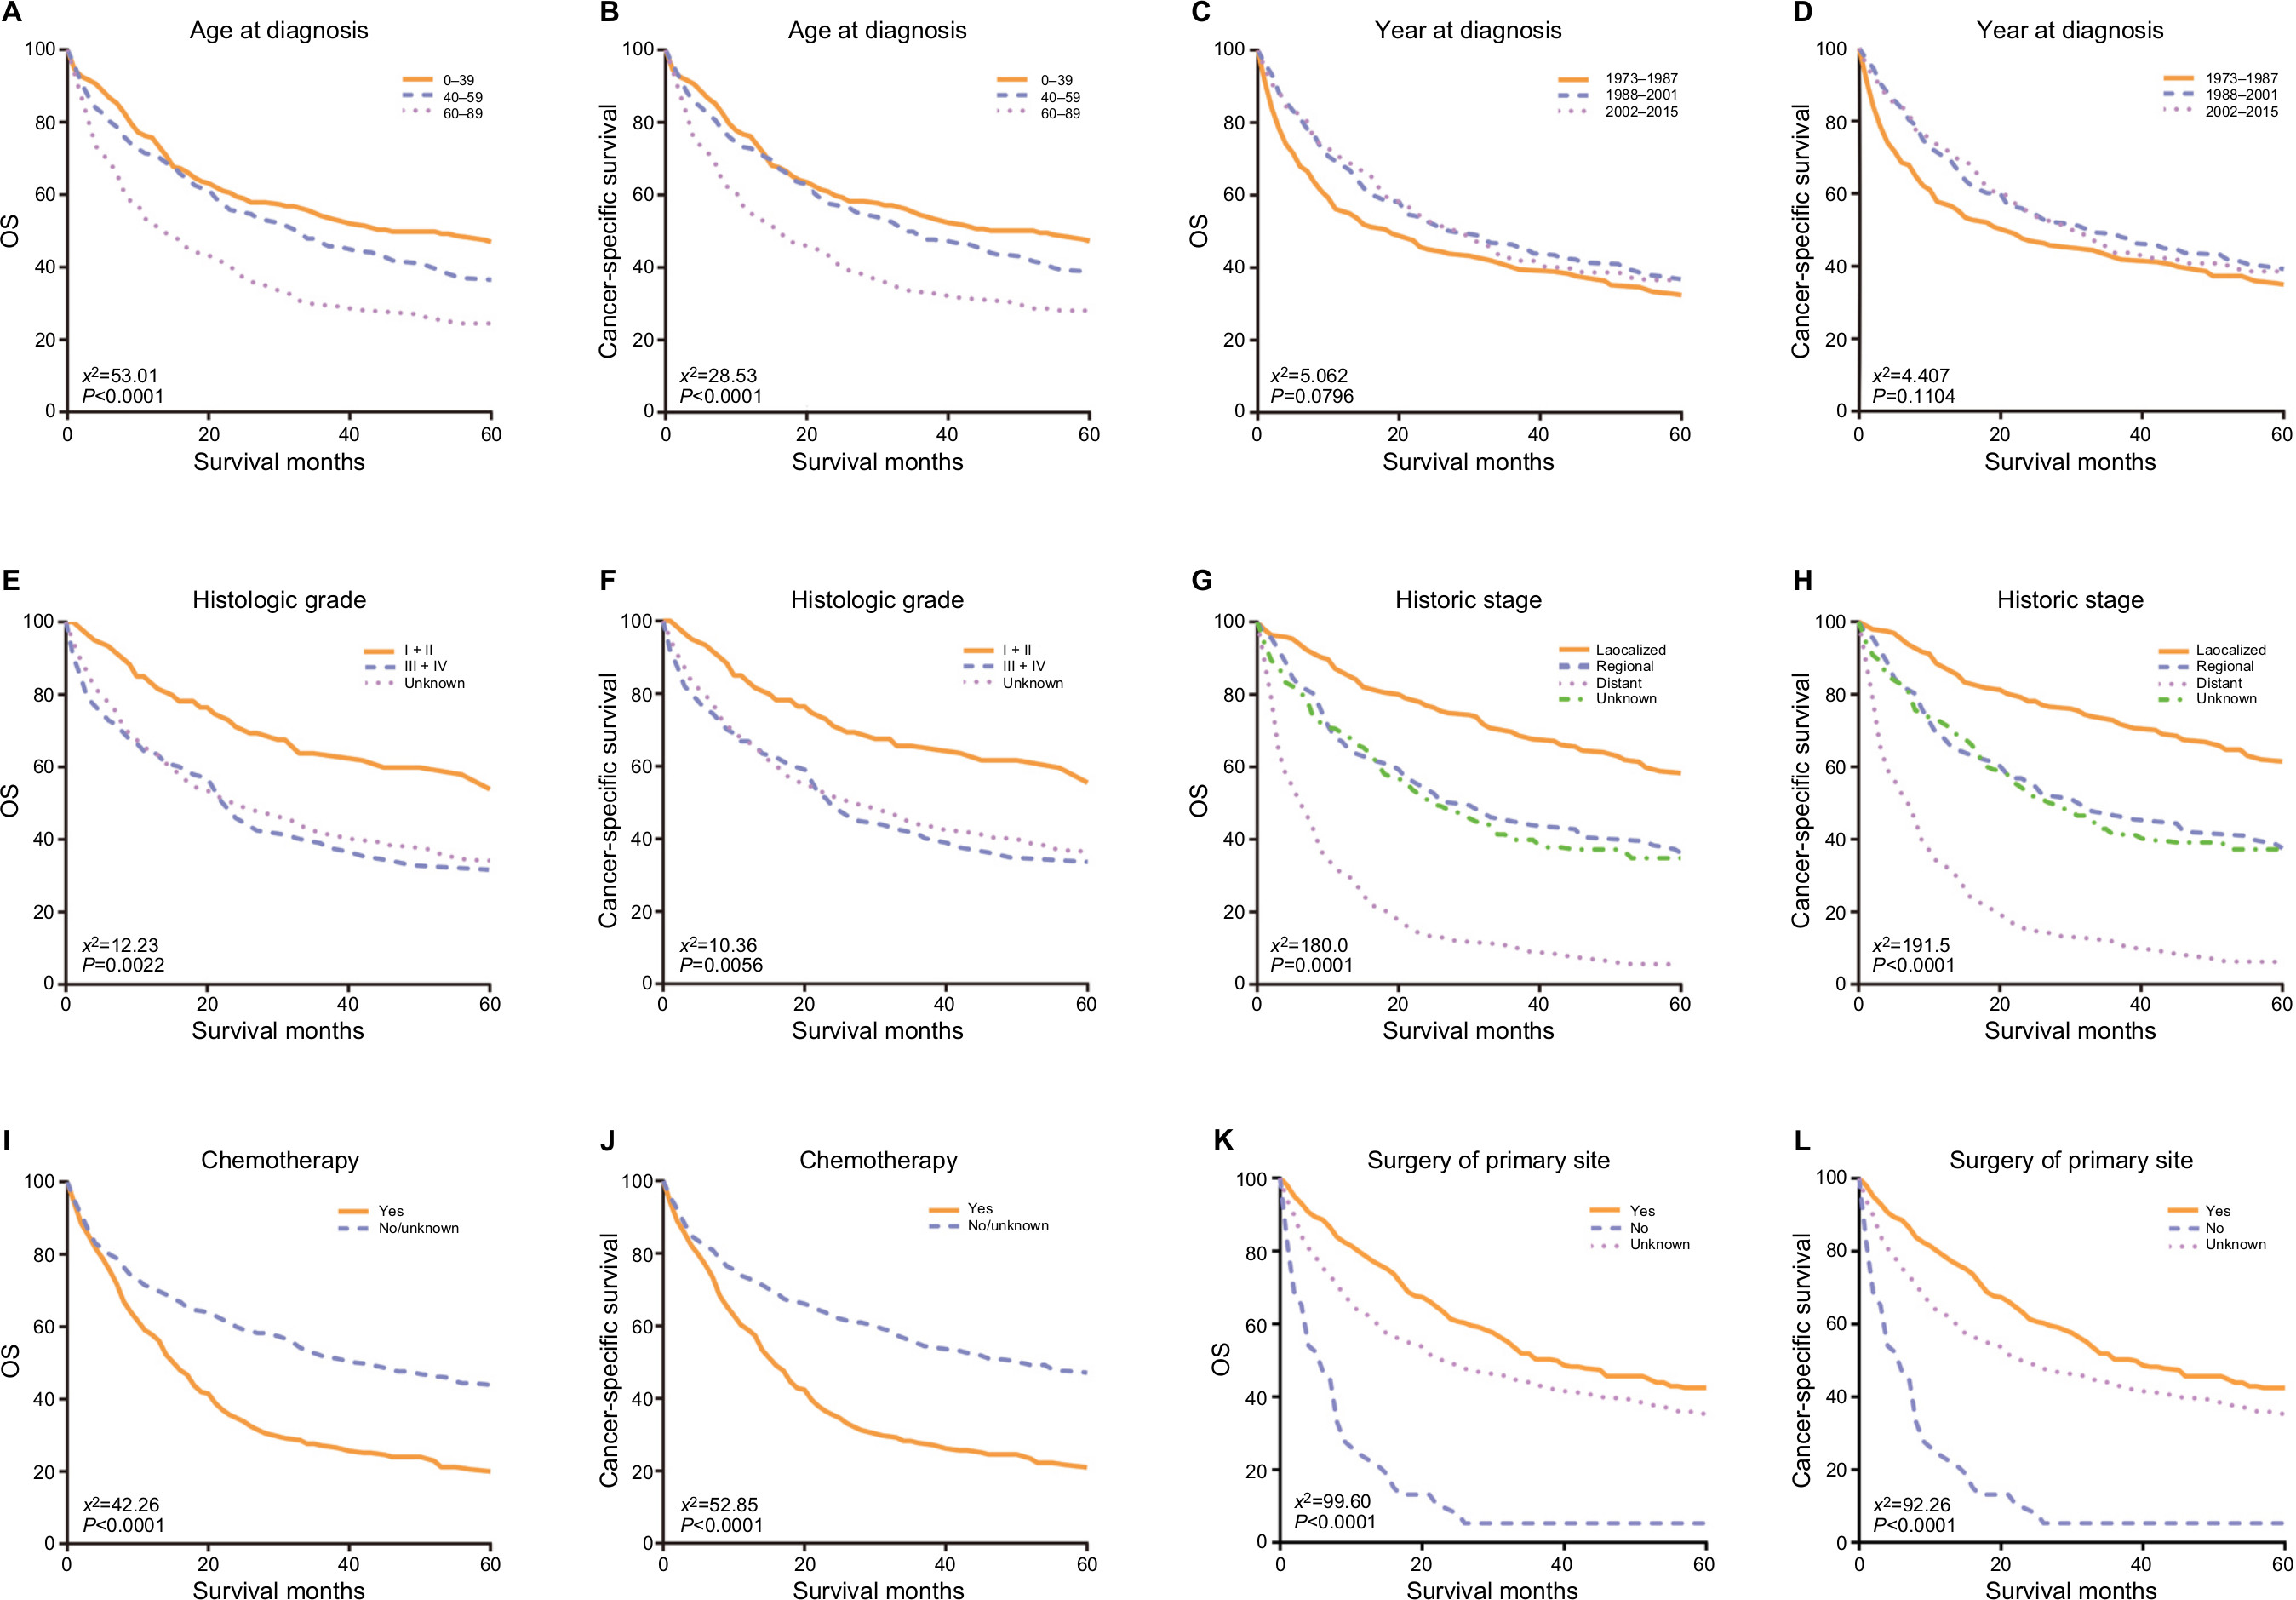 | Figure 3 Kaplan–Meier survival curves of overall survival (A, C, E, G, I, K) and cancer-specific survival (B, D, F, H, J, L). Notes: (A, B) Age at diagnosis, (C, D) year of diagnosis, (E, F) histologic grade, (G, H) historic stage, (I, J) chemotherapy, and (K, L) surgery of primary site. Abbreviation: OS, overall survival. |
Nomogram development
As shown in Figure 4, nomograms were developed to predict 1-year, 3-year, and 5-year OS and CSS, which was aimed to provide accurate and specific prediction of prognosis. Because age at diagnosis, year of diagnosis, histologic grade, historic stage, and chemotherapy were the independent prognostic factors with OS, while age at diagnosis, year of diagnosis, historic stage, and chemotherapy were the independent risk factors with CSS, these characteristics were included in the nomograms. The total points that were used to provide estimates of 1-year, 3-year, and 5-year OS and CSS were calculated from these factors. For example, a 40-year-old patient who was with a grade III and regional ACC, diagnosed in 2001 and underwent chemotherapy, would score a total of 199 points for OS and 180 points for CSS. Therefore, his/her predicted 1-year OS and 1-year CSS would be approximately 66% and 61%, respectively.
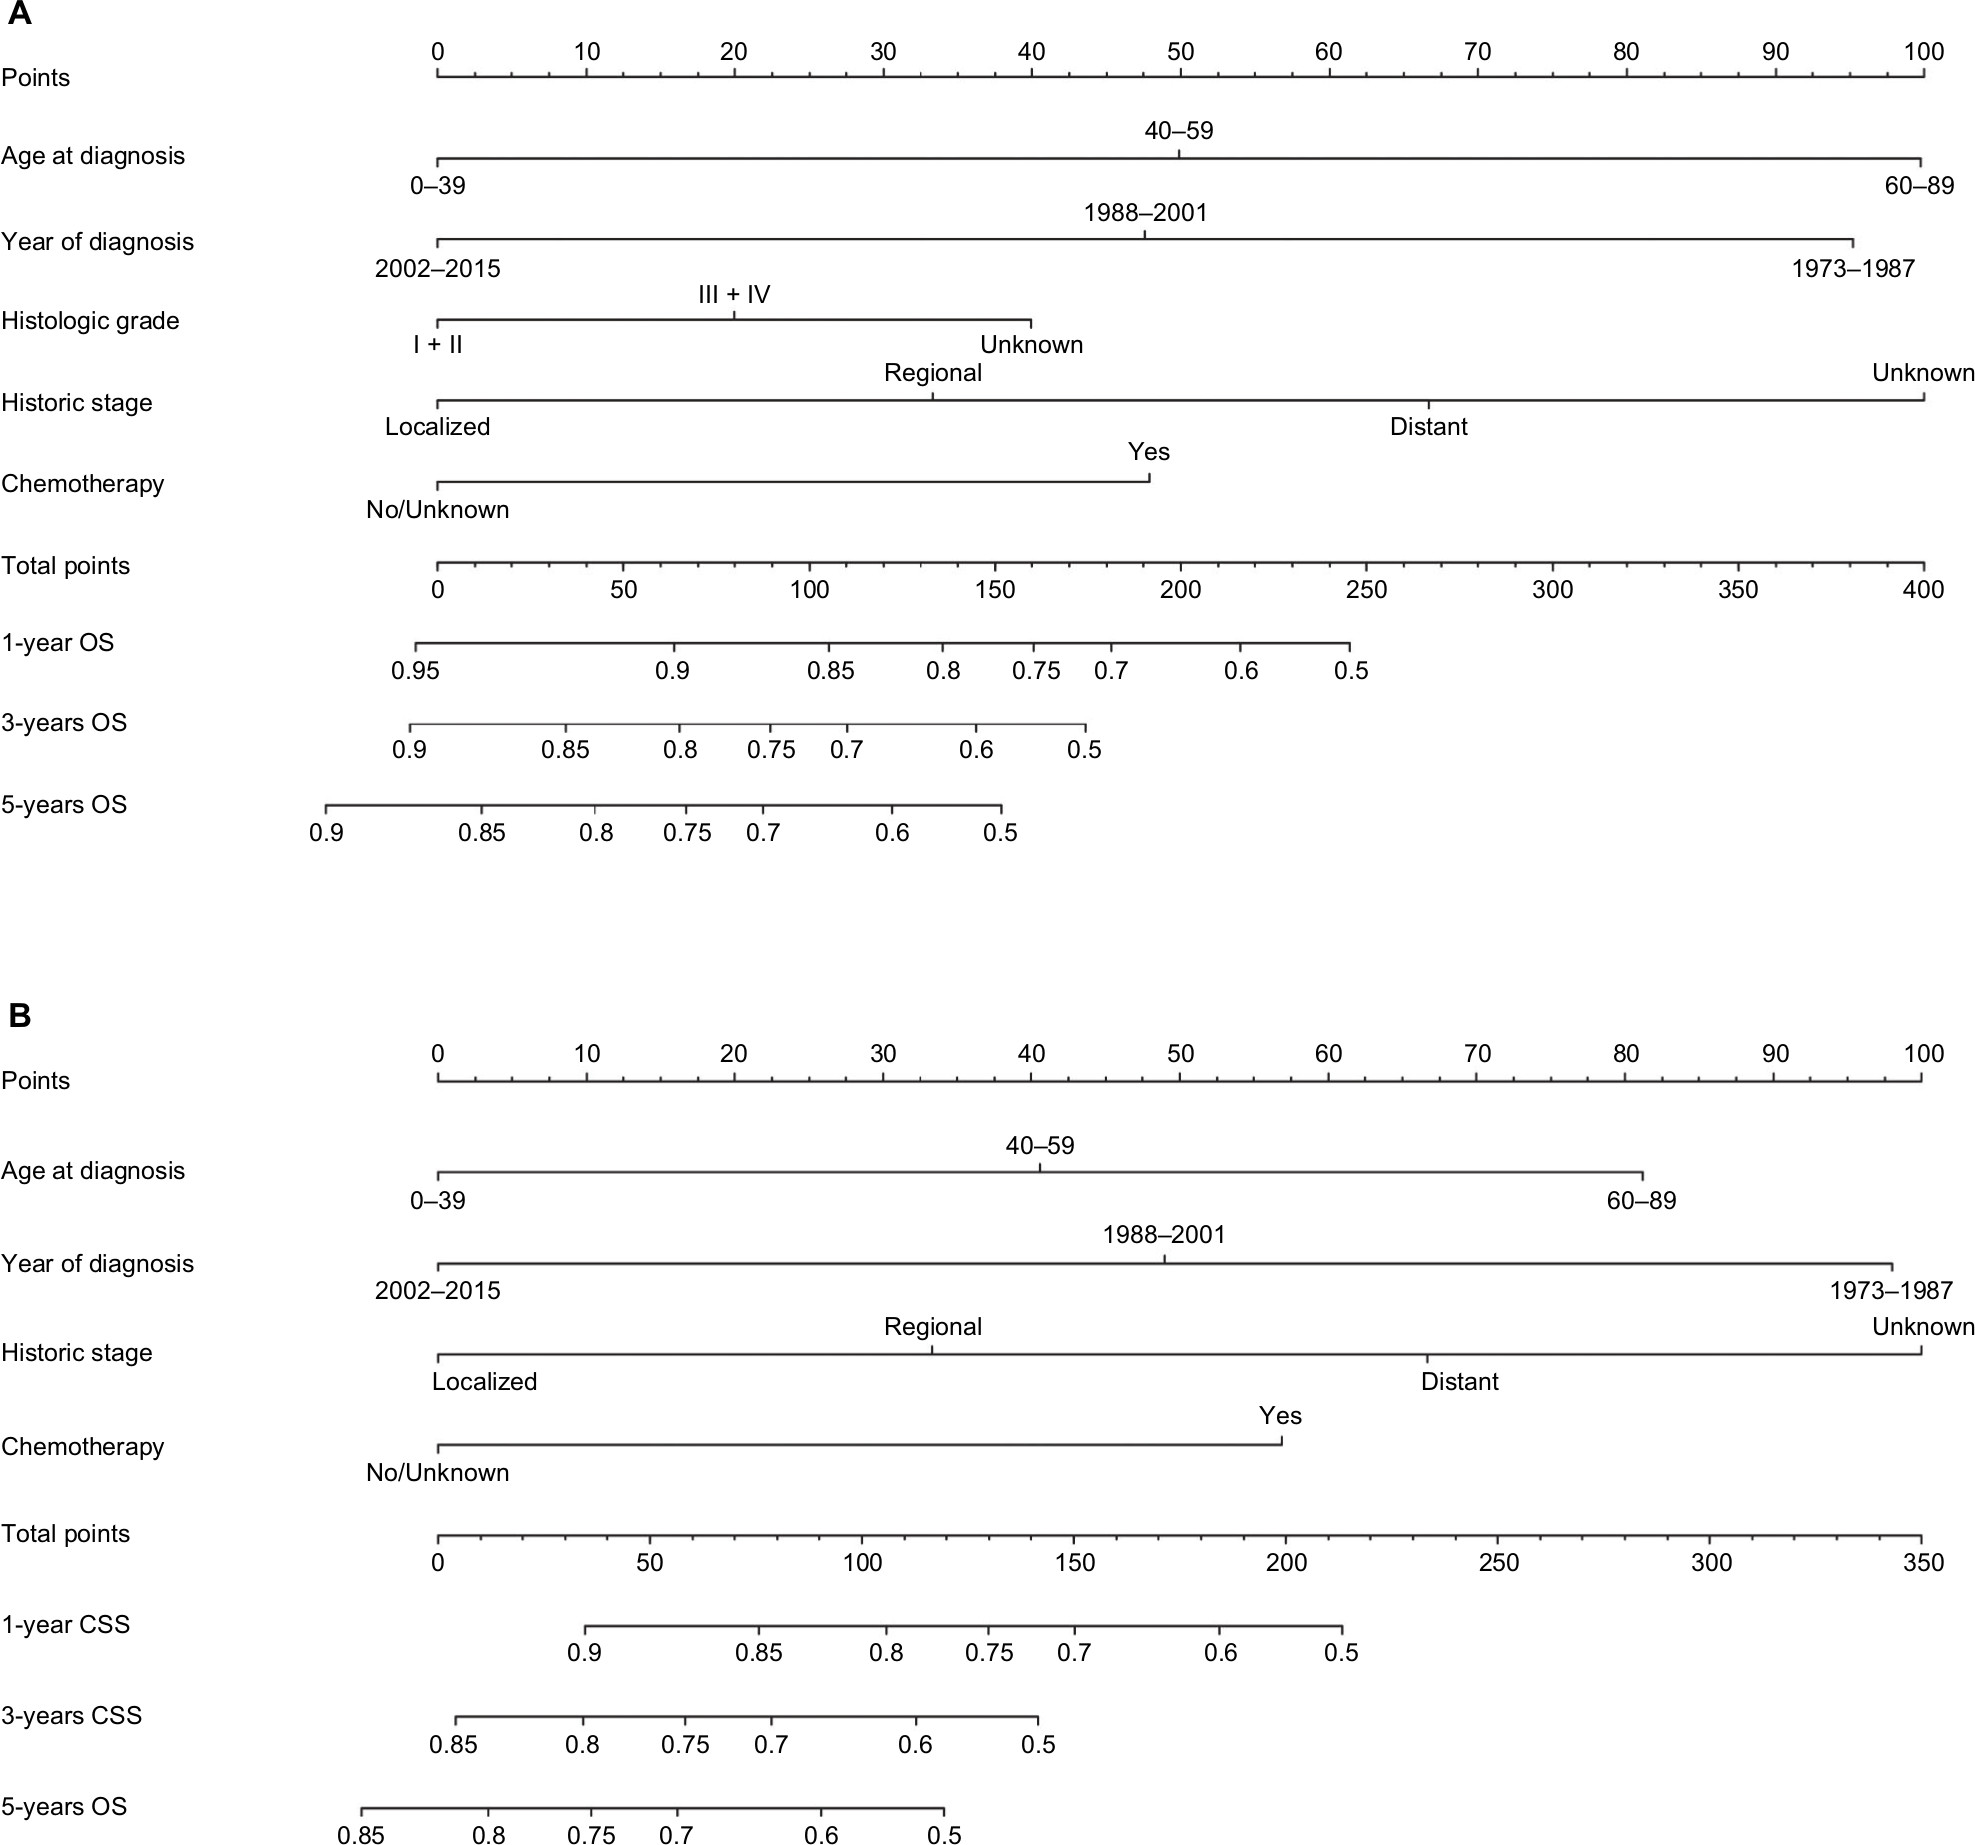 | Figure 4 Nomograms for predicting the OS and CSS rates at 1-year, 3-year, and 5-year in patients with adrenocortical carcinoma. Notes: (A) Predicting1-year, 3-year, and 5-year OS rates, (B) predicting 1-year, 3-year, and 5-year CSS rates. Abbreviations: CSS, cancer-specific survival; OS, overall survival. |
Internal validation of the models
The nomogram models were internally validated by evaluating both discrimination and calibration. Discrimination was measured using the C-index, which was 0.677 (95% CI, 0.654–0.700) for the model predicting OS and 0.672 (95% CI, 0.648–0.696) for CSS. The calibration curves for 3-year OS and CSS are shown in Figure 5. In the calibration curves, we could see that there was a good correlation between the 3-year OS and CSS estimated from the nomograms and those derived from Kaplan–Meier estimated.
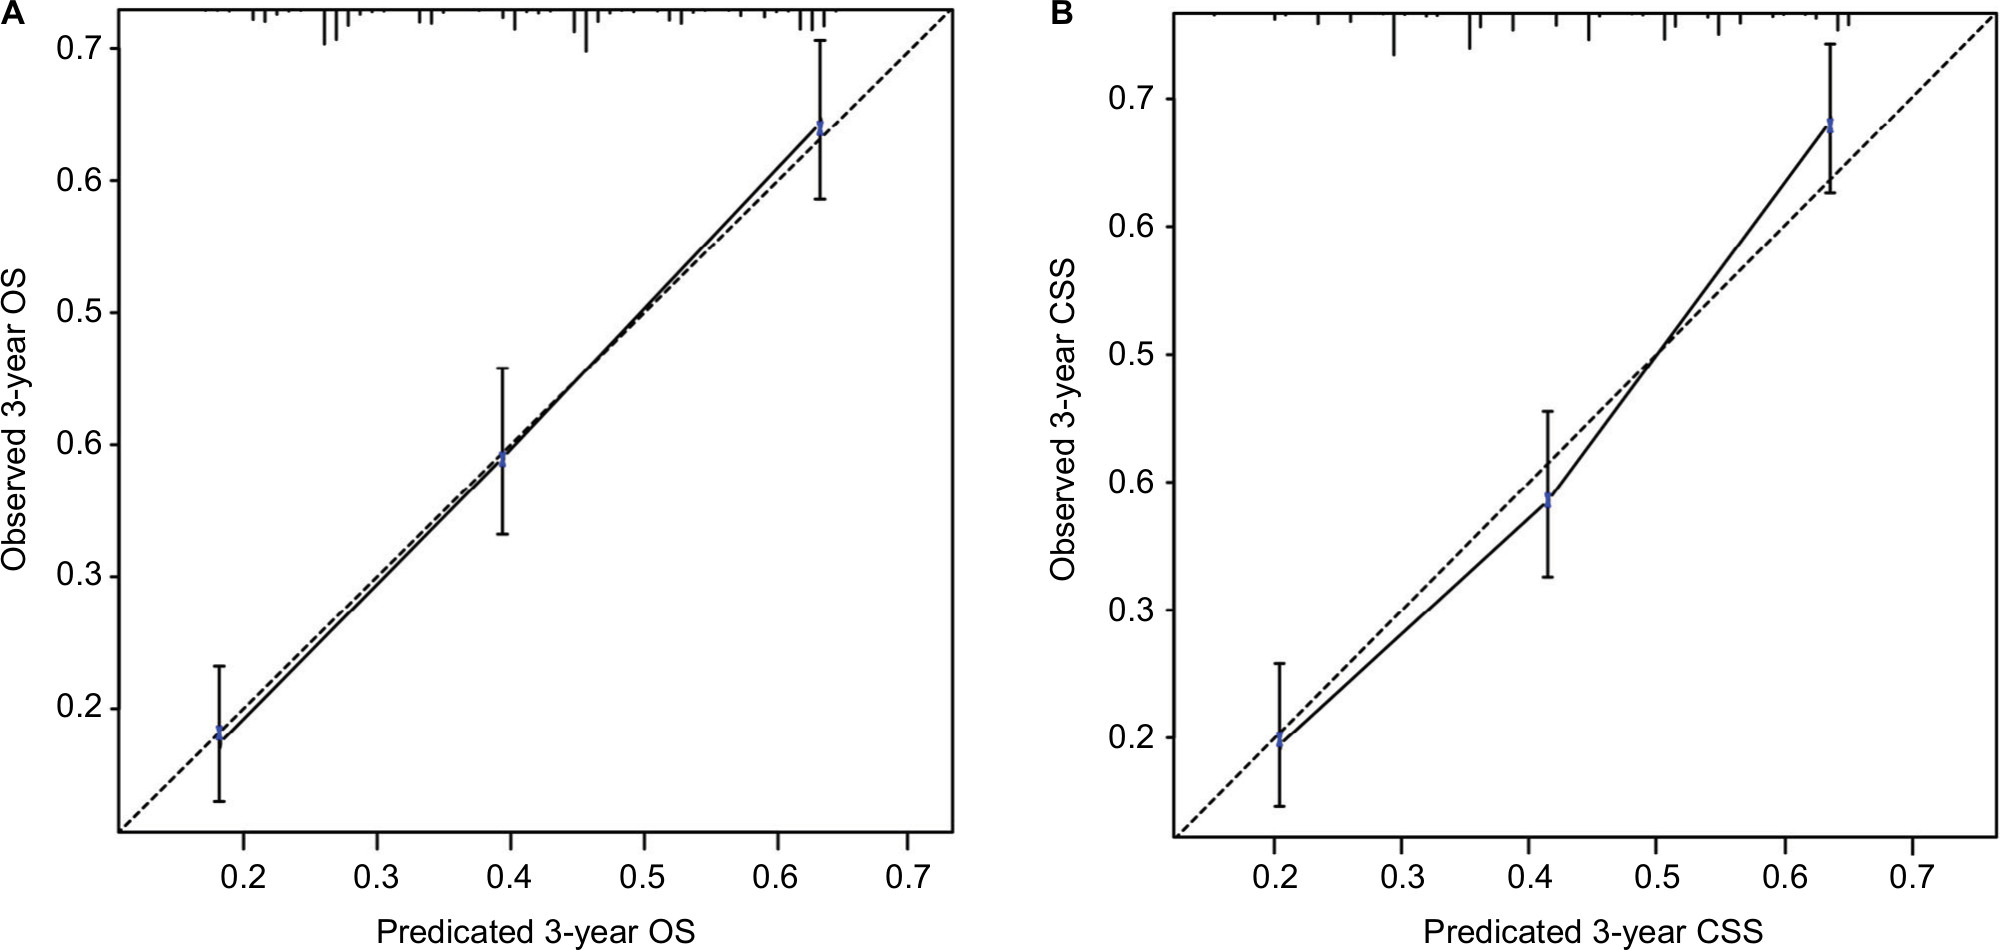 | Figure 5 Calibration curves of the nomograms for predicting 3-year OS (A) and 3-year CSS (B) in patients with adrenocortical carcinoma. Abbreviations: OS, overall survival; CSS, cancer-specific survival. |
Discussion
ACC is a rare and typically aggressive malignancy with a poor prognosis. Although ACC is a highly malignant cancer, some patients could also die from other causes. Consequently, our objective was to develop the OS and CSS nomograms to accurately predict the prognosis of patients with ACC.7 In our study, the nomogram models relied on age at diagnosis, year of diagnosis, histologic grade, historic stage, and chemotherapy.
In our study, there was a predominance of females and whites with a female to male ratio of 1.30:1 and Whites to non-Whites ratio of 5.26:1, which were similar to previous studies.8–10 Historically, there was a bimodal age distribution which had been described for ACC, with one peak in early childhood and another peak in fourth and fifth decades of life.11,12 However, we did not find such bimodal age distribution in our study. Instead, we only found a single peak that was seen in the fourth, fifth, and sixth decades of life. A similar absence of bimodal age distribution was reported in a few previous studies.8,13 As for the year of diagnosis, we could see more patients were diagnosed in 2002–2015, which may be due to the increased use of sensitive imaging studies and the increased awareness of physical examination in recent years.14 The left adrenal gland was slightly more affected than the right one, this peculiar difference in the laterality was also seen in previous studies.13,15,16 However, the mechanism behind this observation was unknown.14
The majority of the tumors were of high grade at diagnosis, which was the opposite of our inherent cognition because of the increased use of sensitive imaging studies in recent years. The contrary was seen in multiple studies.8,13,14 One possible explanation was that due to limitations in the specificity of current diagnostic tools, the lower grade tumors might be initially misclassified as benign and were only picked up later as ACC when they were in high grade. As for historic stage, the main disease was localized, which was parallel to previous studies.9,17,18 The likely reason for this was that imaging examinations were more likely to find tumors located in the adrenal gland, and ACC accounted for 0%–25% of adrenal cortical masses19 and up to 14% of adrenal incidentalomas.20
In our study, surgical resection of the primary site remained the mainstay of therapy. However, in our multivariate analyses of OS and CSS, surgery of primary site was not the independent prognostic factor with P<0.05. But we could see that in the survival analyses, both the 3-year and 5-year of OS and CSS were 0. That was to say, if patients with adrenal cortical cancer did not have surgery, they would live less than 3 years, which was similar to the previous study.18 The reason for this was that adrenal cortical cancer was an extremely malignant and rapidly progressing cancer. Therefore, surgery was virtually the only option to achieve cure for local disease. Besides, it might yield survival benefit in advanced diseases.1,14,21–24 Interestingly, we found that there were nearly twice as many people who received chemotherapy for those who received radiotherapy. This was because ACC was still considered radioresistant even though increasing evidence supported that ACC was not radiotherapy-resistant.25,26 Therefore, only a very small portion of patients would receive radiotherapy as a palliative treatment. Although radiotherapy could not change the OS, it could reduce the risk of local recurrence and ameliorate tumor-related symptoms.14,21,25,27 Patients who received radiotherapy did not benefit from recurrence control and ameliorate tumor-related symptoms, as ACC was an intrinsically high malignant tumor. Consequently, the mild benefits could not change the ultimate end. The advantages of adjuvant mitotane administration after surgery remained controversial. It was reported that mitotane could be effective for certain patients. What is more, predictors of response to mitotane therapy and other cytotoxic drugs could facilitate individualized treatment.1,14,21,24,28
The clinical implications of our nomograms were mainly the ability to provide individualized estimates of OS and CSS in patients with ACC. The nomogram models were derived and validated for that specific purpose. For example, a 30-year-old (0 points) woman with a grade III (20 points) and regional (33 points) ACC, diagnosed in 2015 (0 points) who underwent chemotherapy (48 points) had a total of 101 points for OS, yielding an estimated 1-year OS of 86%, 3-year OS of 72%, and 5-year OS of 66%. Additionally, CSS estimated by the nomogram-derived might be used for adjusting the frequency and intensity of follow-up.
There was only one prognostic model to compare with these nomogram models in the field of ACC.18 Compared with the prognostic model, our study had the following strength. First, our study included data of ACC in the SEER database between 1973 and 2015 and 2015 was the year of the latest data for the database. Second, the indicators were more comprehensive than others’ study. The indicators we used included marital status, sex, age at diagnosis, year at diagnosis, laterality, histologic grade, ethnicity, historic stage, and treatment modality (surgery, chemotherapy, radiotherapy). Besides, the most important point was that our study included the univariate and multivariate analyses, survival analyses, Kaplan–Meier curves analyses, nomogram models, C-index, and calibration curves, which was more complete than others’ study. Additionally, the accuracy of our models could also be assessed by bladder, kidney, and prostate-cancer nomograms, and the C-index of these models was generally 0.620–0.774 and the trend of the calibration curves of our models was almost the same as the calibration curves of these models.29–31
Apart from the prognostic nomogram model of defining the prognosis of patients with ACC, there were some large-scale studies that were performed to examine OS and CSS in patients with ACC. Wang et al examined a cohort of 749 patients with ACC within the SEER database between 1973 and 2014.32 Their studies showed that the prognostic factors for overall and cancer-specific mortality were age, treatment of primary site, chemotherapy, and tumor stage, and tumor stage had a dominant effect. Kebebew et al examined a cohort of 725 patients with ACC within the SEER database between 1973 and 2000.8 The authors found that the most important predictors of survival in patients with ACC were tumor grade, tumor stage, and surgical resection. Xiao et al also examined a cohort of 641 patients exposed to surgery with ACC, within the SEER database between 1988 and 2012.33 They found that age, tumor stage, tumor grade, and marital status affected OS and CSS. Paton et al assessed the OS in 602 patients with ACC within the SEER database between 1988 and 2002.9 The authors showed the relative effect of different stages on OS, and they found that if patients with ACC were not diagnosed at an earlier stage or with tumors smaller, survival would not improve. We corroborated these findings for age, tumor grade, tumor stage, and chemotherapy, and we found that in multivariate analyses, surgical resection did not affect OS and CSS in patients with ACC.
Our study had some limitations. First of all, our study was of a relatively small sample size (751). Our data also suffered from a lack of details. Comorbidity data were also not included in the SEER database. Therefore, we could not adjust for this important cofactor. What is more, massive missing data were the flaw for the SEER database. For example, it was interesting that the survival rates for patients who underwent chemotherapy were much lower than patients who did not undergo chemotherapy or unknown. A possible explanation was that these patients of unknown chemotherapy status had actually undergone chemotherapy and had a long survival time. However, lack of information made them classified as a class with patients who did not undergo chemotherapy. With any predictive model, the point estimates had an inherent range of uncertainty.34 Finally, there was the unavoidable selection bias of all retrospective studies. Although the SEER database had these inherent limitations which might have played a role in the selection of available patients for our study, we still considered the SEER database as a high-quality data to provide medical records at participating institutions of ACC.
In summary, although the nomogram models had some limitations, they were enough to be trusted to provide individualized estimates of OS and CSS in patients with ACC. Therefore, we strongly recommend using these models in patients with ACC to aid individualized clinical decision making. Meantime, future prospective studies should be done to search for a more accurate prognostic model.
Ethics
The SEER database is freely available and the data are anonymized so that there were no ethical issues.
Author contributions
YL and XHB designed the study. YL, XHB, JYOY, and SYW collected the data. YL, XHB, and JYOY analyzed the data. YL, XHB, and MZH organized the manuscript. ZLL reviewed the papers and revised the manuscript. All the authors have read and approved the final manuscript, contributed toward data analysis, drafted and revised the paper, and agreed to be accountable for all aspects of the work.
Disclosure
The authors report no conflicts of interest in this work.
References
Else T, Kim AC, Sabolch A, et al. Adrenocortical carcinoma. Endocr Rev. 2014;35(2):282–326. | ||
Sidhu S, Sywak M, Robinson B, Delbridge L. Adrenocortical cancer: recent clinical and molecular advances. Curr Opin Oncol. 2004;16(1):13–18. | ||
Hara I, Sakamoto Y, Kanomata N, et al. Long-term survival after bilateral adrenalectomy for metachronous adrenocortical cancer. Int J Urol. 2004;11(12):1127–1129. | ||
NCI [database on the Internet]. SEER Incidence Data, 1973–2015 (Including July-December 2005 Hurricane Katrina Impacted Louisiana Cases). Available from: http://seer.cancer.gov/index.html. Accessed November 12, 2018. | ||
Kaplan EL, Meier P. Nonparametric estimation from incomplete observations. J Am Stat Assoc. 1958;53(282):457–481. | ||
Mantel N. Evaluation of survival data and two new rank order statistics arising in its consideration. Cancer Chemother Rep. 1966;50(3):163–170. | ||
Capitanio U, Jeldres C, Shariat SF, Karakiewicz P. Clinicians are most familiar with nomograms and rate their clinical usefulness highest, look-up tables are second best. Eur Urol. 2008;54(4):958–959. | ||
Kebebew E, Reiff E, Duh QY, Clark OH, McMillan A. Extent of disease at presentation and outcome for adrenocortical carcinoma: have we made progress? World J Surg. 2006;30(5):872–878. | ||
Paton BL, Novitsky YW, Zerey M, et al. Outcomes of adrenal cortical carcinoma in the United States. Surgery. 2006;140(6):914–920. | ||
Sturgeon C, Shen WT, Clark OH, Duh QY, Kebebew E. Risk assessment in 457 adrenal cortical carcinomas: how much does tumor size predict the likelihood of malignancy? J Am Coll Surg. 2006;202(3):423–430. | ||
Berruti A, Baudin E, Gelderblom H, et al. Adrenal cancer: ESMO Clinical Practice Guidelines for diagnosis, treatment and follow-up. Ann Oncol. 2012;23(Suppl 7):vii131–vii138. | ||
Veytsman I, Nieman L, Fojo T. Management of endocrine manifestations and the use of mitotane as a chemotherapeutic agent for adrenocortical carcinoma. J Clin Oncol. 2009;27(27):4619–4629. | ||
Sharma E, Dahal S, Sharma P, et al. The characteristics and trends in adrenocortical carcinoma: a United States population based study. J Clin Med Res. 2018;10(8):636–640. | ||
Fassnacht M, Libé R, Kroiss M, Allolio B. Adrenocortical carcinoma: a clinician’s update. Nat Rev Endocrinol. 2011;7(6):323–335. | ||
Wang S, Gao WC, Chen SS, et al. Primary site surgery for metastatic adrenocortical carcinoma improves survival outcomes: an analysis of a population-based database. Onco Targets Ther. 2017;10:5311–5315. | ||
Luo Y, Chen SS, Zheng XG, Luo L, Wang S. The efficacy of radiation therapy in adrenocortical carcinoma: a propensity score analysis of a population-based study. Medicine. 2017;96(17):e6741. | ||
Nilubol N, Patel D, Kebebew E. Does lymphadenectomy improve survival in patients with adrenocortical carcinoma? A population-based study. World J Surg. 2016;40(3):697–705. | ||
Zini L, Capitanio U, Jeldres C, et al. External validation of a nomogram predicting mortality in patients with adrenocortical carcinoma. BJU Int. 2009;104(11):1661–1667. | ||
Kloos RT, Gross MD, Francis IR, Korobkin M, Shapiro B. Incidentally discovered adrenal masses. Endocr Rev. 1995;16(4):460–484. | ||
Mansmann G, Lau J, Balk E, Rothberg M, Miyachi Y, Bornstein SR. The clinically inapparent adrenal mass: update in diagnosis and management. Endocr Rev. 2004;25(2):309–340. | ||
Zini L, Porpiglia F, Fassnacht M. Contemporary management of adrenocortical carcinoma. Eur Urol. 2011;60(5):1055–1065. | ||
Fassnacht M, Kreissl MC, Weismann D, Allolio B. New targets and therapeutic approaches for endocrine malignancies. Pharmacol Ther. 2009;123(1):117–141. | ||
Miller BS, Doherty GM. Surgical management of adrenocortical tumours. Nat Rev Endocrinol. 2014;10(5):282–292. | ||
Kirschner LS. The next generation of therapies for adrenocortical cancers. Trends Endocrinol Metab. 2012;23(7):343–350. | ||
Polat B, Fassnacht M, Pfreundner L, et al. Radiotherapy in adrenocortical carcinoma. Cancer. 2009;115(13):2816–2823. | ||
Hermsen IG, Groenen YE, Dercksen MW, Theuws J, Haak HR. Response to radiation therapy in adrenocortical carcinoma. J Endocrinol Invest. 2010;33(10):712–714. | ||
Sabolch A, Feng M, Griffith K, Hammer G, Doherty G, Ben-Josef E. Adjuvant and definitive radiotherapy for adrenocortical carcinoma. Int J Radiat Oncol Biol Phys. 2011;80(5):1477–1484. | ||
Terzolo M, Angeli A, Fassnacht M, et al. Adjuvant mitotane treatment for adrenocortical carcinoma. N Engl J Med. 2007;356(23):2372–2380. | ||
Kutikov A, Egleston BL, Wong YN, Uzzo RG. Evaluating overall survival and competing risks of death in patients with localized renal cell carcinoma using a comprehensive nomogram. J Clin Oncol. 2010;28(2):311–317. | ||
Brockman JA, Alanee S, Vickers AJ, et al. Nomogram predicting prostate cancer-specific mortality for men with biochemical recurrence after radical prostatectomy. Eur Urol. 2015;67(6):1160–1167. | ||
International Bladder Cancer Nomogram Consortium, Bochner BH, Kattan MW, Vora KC. Postoperative nomogram predicting risk of recurrence after radical cystectomy for bladder cancer. J Clin Oncol. 2006;24(24):3967–3972. | ||
Wang S, Chen SS, Gao WC, et al. Prognostic factors of adrenocortical carcinoma: an analysis of the surveillance epidemiology and end results (SEER) database. Asian Pac J Cancer Prev. 2017;18(10):2817–2824. | ||
Xiao WJ, Zhu Y, Dai B, et al. Conditional survival among patients with adrenal cortical carcinoma determined using a national population-based surveillance, epidemiology, and end results registry. Oncotarget. 2015;6(42):44955–44962. | ||
Iasonos A, Schrag D, Raj GV, Panageas KS. How to build and interpret a nomogram for cancer prognosis. J Clin Oncol. 2008;26(8):1364–1370. |
 © 2018 The Author(s). This work is published and licensed by Dove Medical Press Limited. The
full terms of this license are available at https://www.dovepress.com/terms
and incorporate the Creative Commons Attribution
- Non Commercial (unported, 3.0) License.
By accessing the work you hereby accept the Terms. Non-commercial uses of the work are permitted
without any further permission from Dove Medical Press Limited, provided the work is properly
attributed. For permission for commercial use of this work, please see paragraphs 4.2 and 5 of our Terms.
© 2018 The Author(s). This work is published and licensed by Dove Medical Press Limited. The
full terms of this license are available at https://www.dovepress.com/terms
and incorporate the Creative Commons Attribution
- Non Commercial (unported, 3.0) License.
By accessing the work you hereby accept the Terms. Non-commercial uses of the work are permitted
without any further permission from Dove Medical Press Limited, provided the work is properly
attributed. For permission for commercial use of this work, please see paragraphs 4.2 and 5 of our Terms.