Back to Journals » Research and Reports in Urology » Volume 13
Neural Network Analysis of Crystalluria Content to Predict Urinary Stone Type
Authors Almannie RM, Alsufyani AK, Alturki AU, Almuhaideb M ![]() , Binsaleh S
, Binsaleh S ![]() , Althunayan AM, Alomar MA, Albarraq KM, Alyami FA
, Althunayan AM, Alomar MA, Albarraq KM, Alyami FA
Received 30 May 2021
Accepted for publication 8 December 2021
Published 29 December 2021 Volume 2021:13 Pages 867—876
DOI https://doi.org/10.2147/RRU.S322580
Checked for plagiarism Yes
Review by Single anonymous peer review
Peer reviewer comments 2
Editor who approved publication: Dr Panagiotis J Vlachostergios
Raed M Almannie, Abdullah K Alsufyani, Abdullah U Alturki, Mana Almuhaideb, Saleh Binsaleh, Abdulaziz M Althunayan, Mohammed A Alomar, Khalid M Albarraq, Fahad A Alyami
Division of Urology, Department of Surgery, College of Medicine and King Saud University Medical City, King Saud University, Riyadh, Saudi Arabia
Correspondence: Abdullah K Alsufyani
Division of Urology, Department of Surgery, King Saud University Medical City, King Saud University, Saudi Arabia, King Saud University, Riyadh, 11451, Saudi Arabia
Tel +966114692731
Fax +966114679493
Email [email protected]
Purpose: To investigate the relationship between urinary stone type and the type of crystals in the urine.
Patients and Methods: This retrospective study involved 485 patients with urinary stones treated at King Saud University Medical City from May 2015 to June 2017. Clinical data were obtained from medical records. Different statistical analysis methods were applied, including basic contingency analysis, analysis of variance, logistic regression, discriminant analysis, partition modeling, and neural network evaluations.
Results: Of 485 patients, 47 had crystals detected by urinalysis. The most common type of crystal was calcium oxalate (n = 31), which had the highest association with calcium oxalate stones. Uric acid crystals (n = 8) were associated with uric acid stones. The neural network model used for determining the sensitivity and specificity showed an R-square value of 0.88, with an area under the curve of 0.94 for calcium oxalate, 0.94 for carbonate apatite, and 1.0 for uric acid.
Conclusion: The predictive algorithm developed in the present study may be used with a patient’s clinical parameters to predict the stone type. This approach predicts the stone types associated with certain patient characteristics with a high sensitivity and specificity, indicating that the models may be a valuable clinical tool in the diagnosis, management, and monitoring of stone diseases.
Keywords: crystalluria, urinary sediment, neural network, urolithiasis, stone disease, urinary crystals
Introduction
Urolithiasis, also known as urinary tract stones, is one of the most common urological diseases and affects all people, regardless of age, race, or sex.1 The global prevalence of urolithiasis is estimated to be 1% to 20%.2 Within the last few decades, the incidence has noticeably increased, with data from the United States reporting an increase of 37%.3 Urolithiasis is associated with many burdens on individuals and on society, which result in major health and economical effects. For example, the treatment of urolithiasis costs more than USD 2 billion per year in the United States.4 At the patient level, stone diseases carry many health impacts and may be the direct or indirect cause of many complications, such as renal failure and congestive heart disease.5,6 A recurrence rate of 20% over 2 years was observed in patients with untreated stones, which emphasizes the importance of accurate diagnosis, monitoring, and treatment of urolithiasis.7
Urolithiasis is usually classified according to stone composition into the following groups: non-infection stones (calcium oxalate, calcium phosphate, and uric acid), infection stones (magnesium ammonium phosphate, carbonate apatite, and ammonium urate), genetic (cystine, xanthine, and 2,8-dihydroxyadenine), and drug-induced stones.8 Stone composition and mineral content are usually identified when the stone is provided physically. The preferred methods for analyzing stones include Fourier transform infrared (FTIR) spectroscopy and X-ray diffraction. Typically, when reporting stone analysis results, the dominant mineral of the stone is considered.9 Stones can also be classified according to their X-ray appearance into radio-opaque (calcium oxalate and calcium phosphate), poorly opaque (magnesium ammonium phosphate, apatite, and cystine), and radiolucent (uric acid, ammonium urate, xanthine, and drug-induced).8 For the radiolucent and poorly opaque stones, the diagnosis is made based on computed tomography (CT). However, the classification of stones by CT is not always accurate and its use is not appropriate for all clinical scenarios (eg, children, pregnant women, or patients with small asymptomatic renal stones).8 These limitations, combined with the importance of identifying the type of stone for treatment, have led researchers to examine other diagnostic tools, including crystalluria (the presence of crystals in urine) analysis.
When planning the best treatment modality for urolithiasis, different clinical variables play a role in the decision-making process. Treatment modalities range from oral medications and shock wave lithotripsy to intra-corporeal or extracorporeal surgeries. As recognized by the European Association of Urology, the stone composition is an essential clinical variable that guides the choice of treatment. For example, in cases with an identified uric acid stone, oral chemolysis is recommended as the first-line therapy. Shock wave lithotripsy is another modality that can be considered for some types of stones but is not recommended for others, such as brushite, calcium oxalate monohydrate, or cystine stones. More invasive procedures can also be considered when treating patients with urolithiasis based on the stone type alone or in combination with the clinical features of the patient.
Crystalluria is considered a marker of urine supersaturation, which may be the result of certain metabolic disorders, drug use, or other physiological changes in the urine.10 It can also be the result of disproportional urinary inhibitors and promoters due to physiological or pathological changes, which may ultimately lead to stone disease. Thus, the analysis of crystalluria can be an important tool for the early diagnosis and treatment of renal disease. Due to its significant correlation with stone types, crystalluria has been a long-standing subject of interest and many researchers have supported its clinical use in stone disease monitoring and metabolic disease progression, thereby providing an additional mean of forecasting the formation of stones in the absence of clinical symptoms.11–15 In fact, a model has been proposed by Kazemi and Mirroshandel based on data from 936 patients and 42 variables/parameters that were eventually refined to contain only significant factors with the greatest effect for predicting the formation of stones. Notably, the model did not include crystalluria among the 42 variables investigated.11 In this study, we aimed to determine if crystalluria can be used to predict the stone type, as such information could assist in managing patients with urinary stones.
Materials and Methods
Data Acquisition
This was a retrospective study of data from patients treated at the King Saud University Medical City between May 2015 and June 2017. All data were extracted from patients’ medical records. We included all patients who had undergone stone analysis. Data retrieved included stone composition; serum uric acid level; serum calcium level; urinalysis results (including urine pH, urine red blood cell count [RBC], and urine white blood cell count [WBC]); and demographic data including age, body mass index (BMI), and sex.
Urine and Stone Analysis
We collected the sample for urinalysis at the time of surgical intervention or clinical presentation. To detect urine crystals, samples were taken at random times and were analyzed using microscopy. None of the urine analyses were delayed, due to the 24-hour working policy for the lab at our institute. Stone analysis was performed using FTIR spectroscopy. Stones were named based on the major minerals contributing to them. Urine crystals and stone analysis were documented in the same nomenclature that is reported by the lab.
Neural Network Model
In this study, input variables were age, gender, BMI, grouped urinalysis crystals, urine osmolality, urinalysis pH, urine RBC and urine WBC. A schematic diagram of the 4-node network is shown in Figure 2. Using this diagram as a guide, one can think of a neural network as a function of a set of derived inputs, called hidden nodes, and shown as the green circles in Figure 1. The hidden nodes are nonlinear functions of the original inputs. The activation function at the nodes is a hyperbolic tangent. To begin, the model feeds a set of randomly selected assumptions regarding the input variables to the hidden nodes and compares its response to the output. It will discard the bad assumptions, keep the good ones, and go back and make new assumptions and try again (in this sense, it is learning). It will repeat this until the model is optimized.
 |
Figure 1 Schematic diagram of the 4-node neural network model used to predict the stone type from several predictor variables including urinalysis results, crystal type, body mass index, red blood cell count, and white blood cell count. |
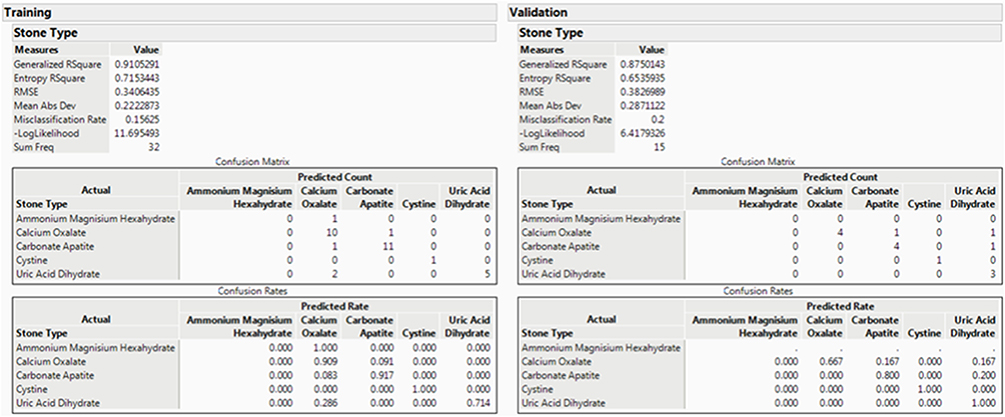 |
Figure 2 Typical output from a neural network model, model statistics, including R-squared values and confusion matrices, are shown on the left side, and the equivalent summary for the validation tests are shown on the right side. Abbreviation: RMSE, root mean square error. |
Model Training and Validation
However, because of the tendency to overfit, the model must be validated. This is done typically by holding back data from the original model construction phase. If the data set is large, one can simply holdback a certain random percentage of the dataset (25–30% typically) and use it for validation. What we would like to observe is a high value for R-square from the model, and an equally high value of R-square for the validation test. If the R-square for the validation test is significantly lower, it suggests that the neural network model is only applicable to the data from which it was built and hence not very useful. However, as the data in this case is not particularly large, we use a different methodology – k-folding. In k-folding, we hold back 1/kth of the data for validation and an R-square value for both the model and the validation test are generated. That kth portion is then reinserted into the data set for model construction and a second, different kth proportion is held back for validation. Another pair of R-square values is generated. This process continues k-times and the model giving the best validation statistic is selected as the final model.
The typical output from the network is presented in Figure 2. The output is divided into two sections: Training and Validation. The training results are those for training the data only, and an R-square value of 0.91 is observed. When this model was applied to data that was not used during the training procedure, a very respectable R-square value of 0.88 was observed. This type of model quality was quite reproducible upon several attempts. The confusion matrix and confusion rates indicate how well the model did at predicting the correct stone type in both the training data, and more importantly, in the validation data.
These results are shown graphically in the receiver operating characteristic curves (1-Specificity vs Sensitivity) shown in Figure 3, where specificity refers to the probability that the test correctly predicts that a condition does not exist, and sensitivity refers to the probability that a given x value (eg crystal type) correctly predicts an existing or probable future condition (eg stone type). The ROC curve is a graphical representation of the relationship between false-positive and true-positive rates. A standard way to evaluate the relationship is with the area under the curve. In the plot, a line is drawn at a 45-degree angle. This marks a somewhat arbitrary cutoff point under the assumption that false negatives and false positives have similar costs, which in medical diagnostics is not always the case. This 45-degree diagonal line is sometimes referred to as the “flip a coin line” as that process would yield the same predictive result. We wish to observe the curves for the data to be lifted significantly beyond this line, and that is what we have observed. Obviously, the model would benefit from more data and the curves would smoothen out, and the predictability of the less common stone types could be more clearly observed. Finally a prediction profiler based on the fed data was developed to extract the probability of each stone type based on the patient’s profile as shown in Figure 4.
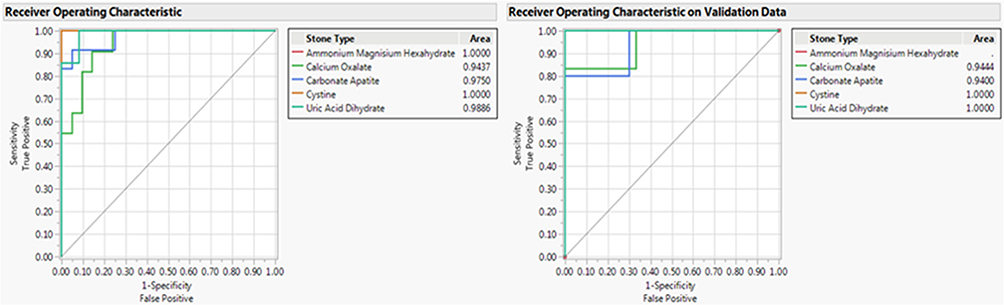 |
Figure 3 Receiver-operating characteristic curves for training (left) and validation data (right). |
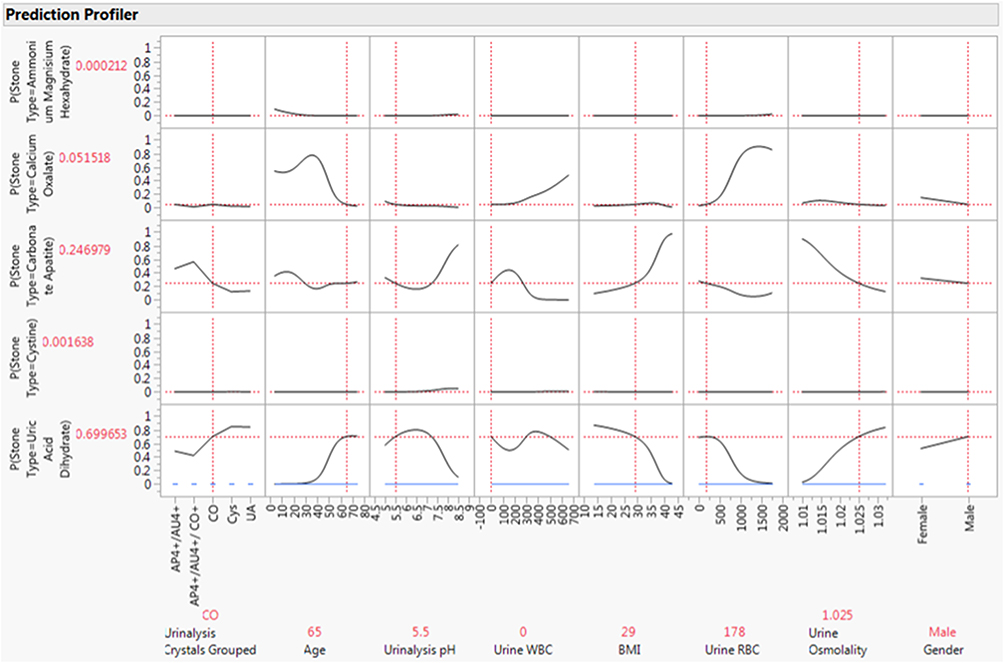 |
Figure 4 Snapshot of the prediction profile curves generated from the neural network model. The curves show the relative effect of the various predictor variables on the probability of generating a particular stone type. |
Data Analysis
Statistical analysis was performed using JMP software (JMP®, SAS Institute Inc., Cary, NC, 1989–2021, www.jmp.com) and included basic contingency analysis, analysis of variance, logistic regression, discriminant analysis (limited to continuous numeric data so that crystalluria composition could not be used as a variable, but was evaluated out of interest), partition modeling, and neural network evaluations.
Ethical Considerations
Institutional review board approval was granted from the research ethics committee at the College of Medicine at King Saud University to conduct this study according to relevant guidelines/regulations. Given that the study was a retrospective analysis reviewing patients’ charts, patient consent was waived. Confidentiality of all data was ensured. This study was performed in accordance with the Declaration of Helsinki.
Results
A total of 485 patients (mean age: 43 years, 72% men, mean BMI: 29.1 kg/m2) had their stones analyzed at our center during the study period. Most of the stones were composed of calcium oxalate (n=261), followed by carbonate apatite (n=153), uric acid dihydrate (n=35), and cystine (n=19) (Table 1).
 |
Table 1 Distribution of Different Stone Types |
In total, 47 individuals had crystals detected by urinalysis (9.5%). A summary of crystal and associated stone types through contingency analysis is shown in Table 2. Most of the urine crystals were calcium oxalate (n=31), followed by uric acid (n=8), amorphous phosphate/urate (n=6), cystine (n=1), and amorphous phosphate/urate/calcium oxalate (n=1).
 |
Table 2 Contingency Table Showing Crystal Type with Associated Stone Type |
The highest association was found between calcium oxalate crystals and calcium oxalate stones (n=16), while a second association was found between calcium oxalate crystals and carbonate apatite stones (n=10). As for the uric acid crystals, an association with uric acid dihydrate stones (n=6) was observed. The amorphous phosphate crystals were associated mainly with carbonate apatite stones (Table 2).
The environment in which the crystals were formed and their association with the mean urinary pH are summarized in Table 3. The associations between the mean urine pH and the correspondent stone type are presented in Table 4. In order from the most basic to the most acidic pH value, cystine stones were associated with a mean pH of 8.0, carbonate apatite stones with a pH of 6.2, calcium oxalate stones with a pH of 5.4, and uric acid dihydrate stones with a pH of 5.3. The pH of calcium oxalate stones was found to be significantly different than that of carbonate apatite stones (p=0.017). Cystine stones had a significantly higher pH than both calcium oxalate (p<0.001) and carbonate apatite (p=0.007) stones (Table 4).
 |
Table 3 Crystal Type and Associated Urinary pH |
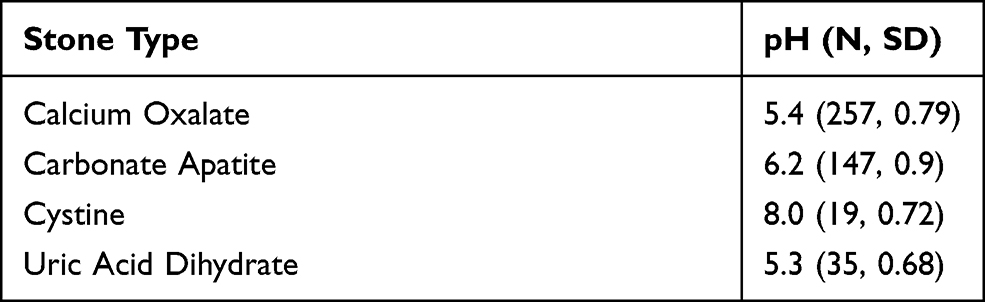 |
Table 4 Stone Type and Associated pH |
The mean blood serum level of serum uric acid found in individuals with stones containing mainly uric acid was 339.8 μmol/L. No significant association between uric acid content and stone type was found, nor was there any statistical difference in uric acid content according to the stone type. There was also no statistical difference in terms of serum calcium, according to the different types of stones.
The logistic regression analysis led to instabilities in many parameter estimates. Care was taken to ensure there were no collinearities between variables that could lead to this problem, but ultimately the data set’s limited size was the biggest obstacle. This also held during partition modeling and discriminant analysis. However, neural network analysis showed a great deal of promise. Neural networks are extremely useful as predictive models where non-linear relationships may be present and when there is no real need to describe the exact relationship between the predictor and the response. They are also extremely flexible and can use both numerical and categorical types of data. The disadvantages are that there is no direct path between the output and input variables, and they tend to overfit, which is why model cross-validation testing is necessary. In this study, input variables were age, sex, BMI, crystal content, urine osmolality, pH, RBC, and WBC.
The ROC curves (1-specificity vs sensitivity) for training and validation data are shown graphically in Figure 3, where specificity refers to the probability that the test correctly predicts that a condition does not exist and sensitivity refers to the probability that a given x value (eg, crystal type) correctly predicts an existing or probable future condition (eg, stone type). The ROC curve is a graphical representation of the relationship between false-positive and true-positive rates. A standard way to evaluate the relationship is with the area under the curve. In the plot, a line was drawn at a 45-degree angle. This marks a somewhat arbitrary cutoff point under the assumption that false negatives and false positives have similar costs, which in medical diagnostics is not always the case. This 45-degree diagonal line is sometimes referred to as the “flip a coin line” as that process would yield the same predictive result. We aimed to observe the curves for the data to be lifted significantly beyond this line, and that is what we observed.
Finally, a snapshot of an interactive set of prediction profile curves is illustrated in Figure 4. These curves indicate the relative effect of each variable on the probability of which type of kidney stone will result. The data input along the bottom for each of the variables came from a random location in the data table The model predicted a probability of 0.699 (Figure 4) that a uric acid dihydrate stone would be produced by a 65-year-old man presenting with calcium oxalate urinalysis crystals, a urinalysis pH of 5.5, a BMI of 29 kg/m2, a urine WBC of 0/hpf, a urine RBC of 178/hpf, and a urine osmolality of 1.025 mOsm/kg. This was followed by a probability of 0.52 that a calcium oxalate stone would result. Interestingly, the stone from this patient was a uric acid dihydrate stone. The curves show the effect of changing the predictor variables. For example, decreasing patient age would correspond to a rapidly decreasing probability of a uric acid dihydrate stone and an increasing probability of a calcium oxalate stone.
Discussion
This retrospective review of stone disease cases revealed that out of 492 patients, 47 were found to have crystalluria (9.5%) in randomly collected urine samples. When looking at the calcium oxalate crystals, which were the most encountered crystals in the dataset, 51.6% were associated with calcium oxalate monohydrate stones. This finding of a relationship between the crystal and the stone was consistent with previous studies.16,17 In this study, it was further observed that calcium oxalate crystals were formed in acidic pH with a mean of 5.6, supporting previously reported pH values of 5.4 and 5.9 for crystal formation.17,18 Another association was found between calcium oxalate crystals and carbonate apatite stones, representing 32.3% of the total number of calcium oxalate crystals. As previously reported in the literature, carbonate apatite stones are usually observed with hypercalciuria and urinary pH anomalies, which may be because most carbonate apatite stones include a calcium oxalate element.19
The second most common type of crystal found in this study was uric acid crystals, with 75% associated with uric acid dihydrate stones. The mean pH of the crystals associated with uric acid stones was 5.2, which is in agreement with the previously reported pH value of 5.4 in the literature.17,18 Interestingly, the two most common crystals in our data were similar to those found by Verdesca et al in two studies conducted years apart; however, it is important to note the difference in patient populations.18 In another study, Fazil et al found that the most frequent crystals encountered were calcium oxalate and phosphate, with uric acid ones being the least common.11
Crystalluria is known to be associated with urinary stone disease,20 and its detection is used as a tool for monitoring the treatment and prevention of different types of stones and metabolic disorders,13 with a higher predictive value than that of other modalities of surveillance for calcium oxalate stones. Additionally, in a cohort of patients with idiopathic calcium oxalate stones, crystalluria was present in early morning urine samples in a significantly higher proportion of individuals with recurrent stones than in those with non-recurrent stones.21 Daudon et al reported that crystalluria may not always accompany the presence of active stone disease. Most studies utilize methods that are not easily applied in daily clinical practice; for example, serial testing for crystalluria in early morning urine samples. Thus, we chose a method that is both non-invasive and practical in the clinical setting, namely a random collection of urine samples from patients with the active stone disease for crystalluria analysis.
Due to the sample size in this study, we elected to use neural network analysis as a predictive model for the type of kidney stone as this type of analysis has shown promising prediction potential, suggesting a relationship between the recognized parameters and the type of stone formed. Using this model, we were able to determine an association between urine parameters including the type of urine crystal and urine pH and patient characteristics including age, sex, and BMI with the type of stone analyzed postoperatively in patients who presented with active cases of urolithiasis. From the example provided in Figure 4, we conclude that the model correctly predicts the stone type, showing a higher probability of uric acid than of calcium oxalate, despite the presence of calcium oxalate crystals. The neural network model considered other variables, giving its predictability more strength and more clinical relevance. In the present example, the age and BMI of the patient played a role in the prediction, as supported by previous literature.22–24
To address the main objective of our study, the model was able to predict the stone type in both the learning and validation phases, indicating that it is reproducible and of important clinical value in determining the sensitivity and specificity of crystalluria for predicting stone type when additional clinical variables are included. Therefore, the use of the model may guide clinical decision-making by determining the best treatment modality for each patient. Additionally, the analysis showed an overall cumulative predictability of 0.88, being comparable with the work of Minnes et al who found “absolute” and “partial” correlation between urine crystals and stone types.25 Advantages of this method of analysis include easy application in a clinical setting, which will improve the diagnosis and follow-up of patients. Other important advantages are the applicability of this method as it does not require the use of an early morning urine sample, its non-invasive nature, and its cost-effectiveness.
Further comparison between the results of Minnes et al25 and our results can be made in terms of predicting calcium oxalate stones from the crystal type. In our study, the predictive value of calcium oxalate stones from the crystal type was 0.94, which is considered excellent accuracy (between 0.90 and 1), compared to 0.97 by Minnes et al. For the urate component, we have shown similar results for predictability (1.00). It is noteworthy to mention the major difference in the methodology, whereby they used FTIR spectroscopy for both urine crystal and stone analyses, while we used light microscopy to analyze the crystals based on their physical appearance. Another study by Tamošaitytė et al26 aimed to find the correlation between crystalluria and kidney stones using infrared microscopy, resulting in calcium oxalate showing a correlation of 73% and urate showing a correlation of 83%. One major observation in the previously mentioned studies was that other variables, such as age, urine pH, and BMI, were not considered in the statistical analysis.
The application of non-linear methods such as neural networks to our data led to a promising prediction algorithm and suggested that a strongly non-linear relationship seems to exist between the parameters and the type of stone formed. Specifically, this approach identified parameters including patient age, sex, BMI, and crystal urinalysis results. Our model could be useful for clinical purposes to guide clinical decision-making in terms of the best treatment for each patient. Furthermore, it may be of great value in identifying the potential type of stone that might form in a particular patient based on the clinical factors as they change over time. Notably, due to the rare occurrence of some type of stones, there were not enough samples and additional measurements should be performed on those patients.
Regarding the neural network model developed in the present study, it is essential to mention that it gives no clear information about the biological role of any single parameter, which suggests the need for further studies to have a better understanding of the underlying reasons why and how each type of stone forms in relation to different parameters. The model would benefit from more data where the curves would smoothen out and the predictability of the less common stone types could be more clearly observed. Crystalluria was potentially useful in 10% of the total number of patients included. However, with potential advances in detecting crystalluria, the use of crystalluria in stone prediction may increase.
Conclusion
Our study shows that crystalluria is an important component in the investigation of kidney stones and that there is a correlation between the crystal type and the stone formed. Therefore, investigating the crystal components found in urine samples of patients could be used as a diagnostic and treatment tool, leading to better management of stone diseases. Furthermore, neural network analysis of crystal types that includes other patient clinical data may be a very effective method for predicting urinary tract stone type. Finally, due to the small sample size and retrospective study design, further studies need to be conducted to validate our results and to identify other predictive markers using larger databases together with the use of different nonlinear mathematical tools.
Acknowledgments
The authors would like to thank the College of Medicine Research Center (CMRC) Deanship for Scientific Research, King Saud University, for supporting this work; we also would like to extend our gratitude to Dr. Greg McMahon for his remarkable work with the statistical analysis.
Disclosure
The authors report no conflicts of interest in this work.
References
1. Shoag J, Tasian GE, Goldfarb DS, Eisner BH. The new epidemiology of nephrolithiasis. Adv Chronic Kidney Dis. 2015;22:273–278.
2. Trinchieri A. Epidemiology of urolithiasis. Clin Calcium. 2011;21:1442–1447.
3. Straub M, Strohmaier WL, Berg W, et al. Diagnosis and metaphylaxis of stone disease: consensus concept of the National Working Committee on Stone disease for the upcoming German Urolithiasis Guideline. World J Urol. 2005;23:309–323. doi:10.1007/s00345-005-0029-z
4. Litwin MS, Saigal CS, Yano EM, et al. Urologic diseases in America project: analytical methods and principal findings. J Urol. 2015;173:933–937. doi:10.1097/01.ju.0000152365.43125.3b
5. Zhe M, Hang Z. Nephrolithiasis as a risk factor of chronic kidney disease: a meta-analysis of cohort studies with 4,770,691 participants. Urolithiasis. 2017;45:441–448. doi:10.1007/s00240-016-0938-x
6. Cheungpasitporn W, Thongprayoon C, Mao MA, et al. The risk of coronary heart disease in patients with kidney stones: a systematic review and meta-analysis. N Am J Med Sci. 2014;6:580–585. doi:10.4103/1947-2714.145477
7. Zisman AL. Effectiveness of treatment modalities on kidney stone recurrence. Clin J Am Soc Nephrol. 2017;12:1699–1708. doi:10.2215/CJN.11201016
8. European Association of Urology. 2019 Guidelines; 2019:996.
9. Lieske JC, Rule AD, Krambeck AE, et al. Stone composition as a function of age and sex. Clin J Am Soc Nephrol. 2014;9:2141–2146. doi:10.2215/CJN.05660614
10. Frochot V, Daudon M. Clinical value of crystalluria and quantitative morphoconstitutional analysis of urinary calculi. Int J Surg. 2016;36:624–632. doi:10.1016/j.ijsu.2016.11.023
11. Marickar YF, Salim A, Vijay A. Stone symptoms and urinary deposits. Urol Res. 2010;38:65–69. doi:10.1007/s00240-009-0227-z
12. Robertson WG, Peacock M, Nordin BE. Calcium crystalluria in recurrent renal-stone formers. Lancet. 1969;294:21–24. doi:10.1016/S0140-6736(69)92598-7
13. Daudon M, Jungers P, Lacour B. Clinical value of crystalluria study. Ann Biol Clin. 2004;62:379–393.
14. Robertson WG, Peacock M. Calcium oxalate crystalluria and inhibitors of crystallization in recurrent renal stone-formers. Clin Sci. 1972;43:499–506. doi:10.1042/cs0430499
15. Fogazzi GB. Crystalluria: a neglected aspect of urinary sediment analysis. Nephrol Dial Transplant. 1996;11:379–387. doi:10.1093/oxfordjournals.ndt.a027276
16. Jungers P, Daudon M, Le Duc A. Urinary lithiasis. Flammarion Medicine-Sciences; 1989.
17. Daudon M, Frochot V. Crystalluria. Clin Chem Lab Med. 2015;53:S1479–S1487. doi:10.1515/cclm-2015-0860
18. Verdesca S, Fogazzi GB, Garigali G, et al. Crystalluria: prevalence, different types of crystals and the role of infrared spectroscopy. Clin Chem Lab Med. 2011;49:515–520. doi:10.1515/CCLM.2011.078
19. Carpentier X, Daudon M, Traxer O, et al. Relationships between carbonation rate of carbapatite and morphologic characteristics of calcium phosphate stones and etiology. Urology. 2009;73:968–975. doi:10.1016/j.urology.2008.12.049
20. Dyer R, Nordin BE. Urinary crystals and their relation to stone formation. Nature. 1967;215:751–752. doi:10.1038/215751a0
21. Daudon M, Hennequin C, Boujelben G, et al. Serial crystalluria determination and the risk of recurrence in calcium stone formers. Kidney Int. 2005;67:1934–1943. doi:10.1111/j.1523-1755.2005.00292.x
22. Yang X, Zhang C, Qi S, et al. Multivariate analyses of urinary calculi composition: a 13-year single-center study. J Clin Lab Anal. 2016;30:873–879. doi:10.1002/jcla.21950
23. Carvalho M. Urinary pH in calcium oxalate stone formers: does it matter? J Bras Nefrol. 2018;40:6–7. doi:10.1590/1678-4685-jbn-2018-00010002
24. Inci M, Demirtas A, Sarli B, et al. Association between body mass index, lipid profiles, and types of urinary stones. Ren Fail. 2012;34:1140–1143. doi:10.3109/0886022X.2012.713298
25. Minnes R, Brider T, Goryachev A, et al. Fiber-optic evanescent wave spectroscopy (FEWS) of crystals from a urine sample as a tool for evaluating the chemical composition of kidney stones. Anal Methods. 2019;11:2404–2409. doi:10.1039/C8AY02663G
26. Tamosaityte S, Hendrixson V, Zelvys A, et al. Combined studies of chemical composition of urine sediments and kidney stones by means of infrared microspectroscopy. J Biomed Opt. 2013;18:027011. doi:10.1117/1.JBO.18.2.027011
 © 2021 The Author(s). This work is published and licensed by Dove Medical Press Limited. The
full terms of this license are available at https://www.dovepress.com/terms
and incorporate the Creative Commons Attribution
- Non Commercial (unported, 3.0) License.
By accessing the work you hereby accept the Terms. Non-commercial uses of the work are permitted
without any further permission from Dove Medical Press Limited, provided the work is properly
attributed. For permission for commercial use of this work, please see paragraphs 4.2 and 5 of our Terms.
© 2021 The Author(s). This work is published and licensed by Dove Medical Press Limited. The
full terms of this license are available at https://www.dovepress.com/terms
and incorporate the Creative Commons Attribution
- Non Commercial (unported, 3.0) License.
By accessing the work you hereby accept the Terms. Non-commercial uses of the work are permitted
without any further permission from Dove Medical Press Limited, provided the work is properly
attributed. For permission for commercial use of this work, please see paragraphs 4.2 and 5 of our Terms.