Back to Journals » International Journal of Nanomedicine » Volume 11
Near-infrared fluorescence imaging platform for quantifying in vivo nanoparticle diffusion from drug loaded implants
Authors Markovic S, Belz J, Kumar R, Cormack R, Sridhar S, Niedre M
Received 29 July 2015
Accepted for publication 5 November 2015
Published 24 March 2016 Volume 2016:11 Pages 1213—1223
DOI https://doi.org/10.2147/IJN.S93324
Checked for plagiarism Yes
Review by Single anonymous peer review
Peer reviewer comments 2
Editor who approved publication: Dr Thomas Webster
Stacey Markovic,1,* Jodi Belz,2,* Rajiv Kumar,3,4 Robert A Cormack,4 Srinivas Sridhar,3,4 Mark Niedre1
1Department of Electrical and Computer Engineering, 2Department of Bioengineering, 3Department of Physics, Northeastern University, Boston, MA, USA; 4Department of Radiation Oncology, Brigham and Women’s Hospital, Dana-Farber Cancer Institute and Harvard Medical School, Boston, MA, USA
*These authors contributed equally to this work
Abstract: Drug loaded implants are a new, versatile technology platform to deliver a localized payload of drugs for various disease models. One example is the implantable nanoplatform for chemo-radiation therapy where inert brachytherapy spacers are replaced by spacers doped with nanoparticles (NPs) loaded with chemotherapeutics and placed directly at the disease site for long-term localized drug delivery. However, it is difficult to directly validate and optimize the diffusion of these doped NPs in in vivo systems. To better study this drug release and diffusion, we developed a custom macroscopic fluorescence imaging system to visualize and quantify fluorescent NP diffusion from spacers in vivo. To validate the platform, we studied the release of free fluorophores, and 30 nm and 200 nm NPs conjugated with the same fluorophores as a model drug, in agar gel phantoms in vitro and in mice in vivo. Our data verified that the diffusion volume was NP size-dependent in all cases. Our near-infrared imaging system provides a method by which NP diffusion from implantable nanoplatform for chemo-radiation therapy spacers can be systematically optimized (eg, particle size or charge) thereby improving treatment efficacy of the platform.
Keywords: optical imaging, fluorescence, drug delivery, brachytherapy, treatment monitoring
Introduction
Implantable drug delivery systems placed at the site of disease represents an appealing approach to delivering a number of different classes of drugs that cannot be effectively delivered via more common routes such as intravenous, oral, or topical administration. An implantable drug reservoir can increase the bioavailability of the drug without the need for multiple injections.1 To prevent a secondary intervention for drug reservoir removal, many implantable devices have been made biodegradable. The degradation rate of the implant combined with the diffusivity of the drug makes understanding and predicting the release profile in vivo a challenge. For example, polymer-dexamethasone implants are used for intravital dosing for persistent macular edema, showing significant dexamethasone levels up to 6 months post-implantation. However, detection of drug levels was performed using common techniques, such as liquid chromatography-tandem mass spectrometry in sacrificed animals, which greatly limits the amount of data collected to a single time point.2 Similar post-sacrifice analysis techniques or complex biopsies were used in determining diffusion profiles of clinically used biodegradable implants in delivering insulin, steroids, chemotherapeutics, antibiotics, or analgesics.1 In this manuscript, we aim to develop an imaging platform that can be used to understand the mechanism and quantification of drug diffusion from these implants. We also aim to evaluate the size-dependent diffusion properties using real-time diffusion in live animals by studying different sized fluorescent silica nanoparticles (NPs) incorporated in these implants.
We have fabricated a modified brachytherapy spacer for application in localized drug delivery during the brachytherapy procedure. During brachytherapy, clinicians use identical but inert spacers to achieve spatial and temporal distribution of radioactive brachytherapy seeds for highly controlled radiation dosing of the tumor. However, these spacers themselves do not currently have any therapeutic function.3–5 Since these spacers are frequently used as internal radiation therapy guides in clinics, this offers an opportunity for in situ delivery of drugs by fabricating spacers which are doped with chemotherapeutic drugs or radiosensitizers, without additional discomfort to the patient. Our group leveraged this opportunity and fabricated “implantable nanoplatform for chemo-radiation therapy” (INCeRT) spacers for localized delivery of therapeutics.6
While systemic chemotherapy administered intravenously is routinely used, both with and without radiation therapy in the management of cancer, poor tumor accumulation and systemic toxicity due to intravenous delivery are major limitations when creating a personalized treatment plan.7–9 Localized delivery of a chemotherapy agent would eliminate the high systemic toxicities while allowing for an effective and concentrated dose directly at the tumor site. The robust INCeRT platform can be tailored for a controlled and continuous release of the drug/radiosensitizer from the spacer for sustained local delivery of a high therapeutic dose optimal for long-term brachytherapy treatments. The size, shape, and delivery procedure for INCeRT spacers are identical to spacers used in current clinical settings, with the added benefit of local chemotherapy. This will act as a slow-release drug reservoir for simultaneous combinatorial chemo and radiation therapy. However, to prove our concept of slow and sustained drug release from INCeRT implants, it is imperative to study the release of the drug and diffusion properties in real time using a non-invasive method. Thus, to demonstrate this, we have used near-infrared (NIR) fluorophore, Cyanine 7.5 (Cy7.5) as a model drug to incorporate in the INCeRT spacers and study the diffusion in real time using optical imaging methods. We have further incorporated Cy7.5 in the NPs to evaluate the size-dependent release and diffusion from the spacers. This release is conceptually illustrated in Figure 1A, demonstrating the NP release from the spacer and the subsequent release of the therapeutic agent from the NP. The use of Cy7.5 conjugated NPs in the spacer allows for studying the diffusion properties of materials with different molecular weights or sizes when embedded in the implants or spacers.
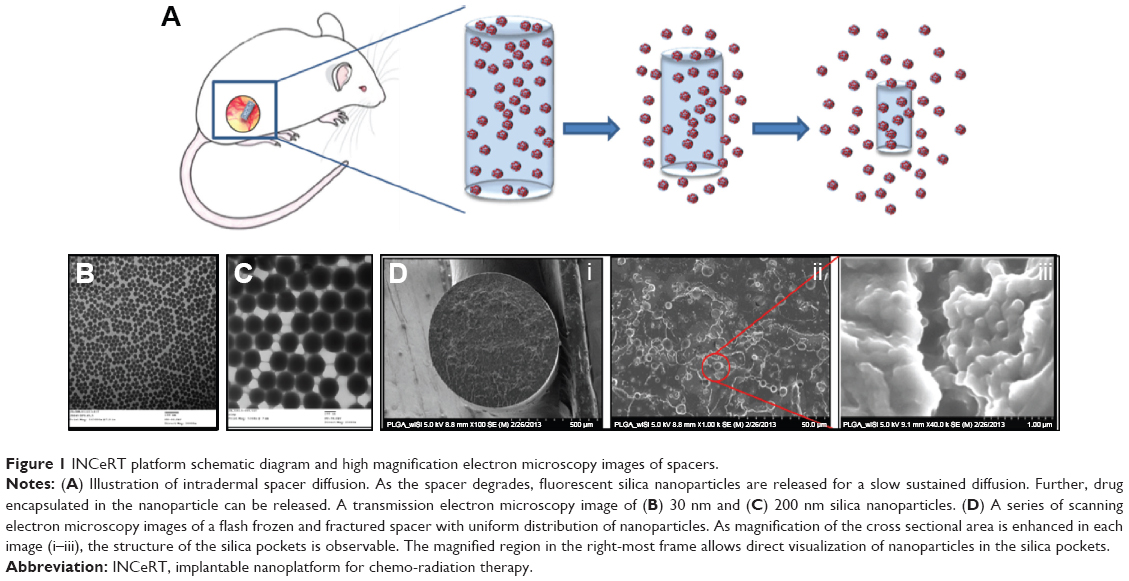 | Figure 1 INCeRT platform schematic diagram and high magnification electron microscopy images of spacers. |
Fluorescence imaging has a number of advantages for this application, including the ability to perform non-invasive serial imaging over time on the same animal(s), the broad availability of biocompatible cell labeling techniques (red fluorescent proteins, Alexa Fluor [AF] dyes, and Cyanine dyes), the lack of ionizing radiation, and the relatively low cost of the instrumentation involved.10–12 To achieve this, we developed and validated a new broad-field fluorescence imaging system to observe NP diffusion in bulk biological tissue. This allowed us to systematically quantify diffusion both in phantoms in vitro and in mice in vivo. Moreover, we chose to perform imaging in the NIR “diagnostic window” wavelength region (corresponding to approximately 650–850 nm), where light absorption and scatter is minimal compared to the visible range.10 We performed in vitro studies with free AF 750 dye and NPs of different sizes (30 and 200 nm) in agar gel phantoms in vitro and analyzed the diffusion over time. We also performed studies for 2 weeks in mice tracking and analyzing the diffusion in vivo. As will be shown, we were able to quantify size-based diffusion in both models. As such, this technology represents a new platform by which we can optimize INCeRT NP characteristics – for example with respect to size and surface chemistry – to achieve sustained chemotherapy release from the spacers over weeks or months in vivo.
Methods and materials
Fabrication of NPs and spacers
Synthesis of NIR fluorescent silica NPs
The synthesis of conjugated Cy7.5 silica NPs (conCy7.5-NPs) was carried out using a slightly modified oil-in-water microemulsion method previously reported by Kumar et al.13,14 To conjugate the Cy7.5-N-hydroxysuccinimide (NHS) ester fluorophore into the NPs, Cy7.5-silane was prepared by conjugating Cy7.5-NHS ester (Lumiprobe Corporation, Hallandale, FL, USA) to a silane precursor using (3-aminopropyl) triethoxysilane (Sigma-Aldrich Co., St Louis, MO, USA) under argon atmosphere. The NPs were prepared at room temperature with 2.2% dioctyl sulfosuccinate sodium salt 96% (AOT) (Sigma-Aldrich Co.) (wt/v) in 10 mL high performance liquid chromatography water, followed by the addition of 1-butanol and Cy7.5-silane at 1,200 rpm stirring. After 15 minutes, vinyltrimethoxysilane (Sigma-Aldrich Co.) was added and the mixture was continuously stirred for 45 minutes, at which point, ammonium hydroxide (Sigma-Aldrich Co.) was added and the reaction was covered and left to stir overnight. The NPs’ suspension was then dialyzed against distilled water for 48 hours at room temperature, using a cellulose membrane (Thermo Fisher Scientific, Waltham, MA, USA) with a cutoff size of 12–14 kDa. Following dialysis, the NPs were sterile filtered (0.45 μm) and stored at 4°C for future use.
Fabrication of poly(lactic-co-glycolic) acid (PLGA) spacers doped with NPs
The fabrication of spacers was carried out by previously optimized protocols from our group in two steps that involve: a) extraction of NPs from the aqueous media and b) polymer extrusion along with NPs.6 Briefly, the dialyzed NPs were frozen and left in the dark under vacuum to dry overnight. The dried NP pellet was re-dispersed in minimum amount of dimethyl sulfoxide (Sigma-Aldrich Co.) via sonication. Following that, 250 mg of PLGA (molecular weight [MW] 54–69 kDa, Sigma-Aldrich Co.) was dissolved in minimum amount of chloroform. The NP slurry was then added to the polymer slurry and the entire mixture was mixed thoroughly and left in 4°C for 30 minutes or until the mixture became a viscous paste. The paste was then transferred to a 1 mL syringe. All air bubbles were carefully removed from the syringe and the mixture was then extruded into Tygon silicone tubing (inner diameter 0.8 mm, Thermo Fisher Scientific) using an infusion pump (Harvard Apparatus, Holliston, MA, USA). After infusion, the ends were clipped with binder clips, cylinders were dried overnight then cooled to room temperature and cut into 5 mm length for storage. For fabricating the free Cy7.5 dye doped PLGA spacers, a similar process was used, substituting the NP slurry with Cy7.5 in dimethyl sulfoxide solution.
Characterization of NPs and spacers
Transmission electron microscopy images of 30 nm and 200 nm NPs are shown in Figure 1B and 1C, respectively (JEM-100CX microscope; JEOL, Tokyo, Japan) were obtained using an acceleration voltage of 80 kV. The specimens were prepared by drop casting the sample dispersion onto an amorphous carbon coated 300 mesh copper grid. Dynamic light scattering (90Plus zeta sizer, Brookhaven Inc., Holtsville, NY, USA) was used to measure the hydrodynamic diameter of the conCy7.5-NPs. To prepare samples for scanning electron microscopy, spacers were flash frozen in liquid nitrogen then fractured with a cooled razor. Fractured and non-fractured spacers were attached to a specimen mount using a conductive carbon adhesive tab and then coated with 10–15 nm of carbon using a vacuum evaporator (DV502; Denton Vacuum, Moorestown, NJ, USA). Samples were imaged in both secondary electrons and back-scattered electrons mode (S-4800 field emission SEM; Hitachi Ltd., Tokyo, Japan) at 5 kV and are shown in Figure 1D. Energy-dispersive X-ray spectroscopy analysis was carried out by selecting several regions of interest from the spacers and evaluating the elemental composition of the region of interest.
Fluorescence imaging system
A schematic diagram and photograph of our custom designed fluorescence imaging system is shown in Figure 2A and B, respectively. Samples (mice or agar phantoms) were placed on a platform and trans-illuminated with the output of a tunable Titanium:Sapphire laser (Mai Tai, XF-1; Spectra-Physics, Inc., Santa Clara, CA, USA). Although the laser has an 80 MHz repetition rate, in these studies we used it in quasi-continuous wave mode. We chose to use an NIR fluorophore and laser combination because attenuation and autofluorescence of biological tissue is well-known to be significantly reduced versus blue or green wavelength ranges.15 The output wavelength of the laser was set to 740 nm (which matched the absorption spectra of the AF 750 and Cy7.5 dyes). The output of the beam was filtered with a 730 nm “clean up” filter with 30 nm bandpass (z730/30 nm; Chroma Technology, Rockingham, VT, USA) to remove any out-of-band NIR laser output. The 1 mm diameter beam was expanded to approximately 150 cm in diameter using a lens pair in simple telescope configuration (f=50 mm and 200 mm; Edmund Optics, Barrington, NJ, USA) followed by a third expanding plano-concave lens (f=−25 mm; Edmund Optics). The power at the sample was adjusted using a set of neutral density filters and was approximately 15 mW (equivalent to 0.015 mW/cm2) for these experiments. A ground glass diffuser plate was placed under the samples to create a relatively homogeneous illumination profile and remove any speckle or interference pattern from the illumination light.
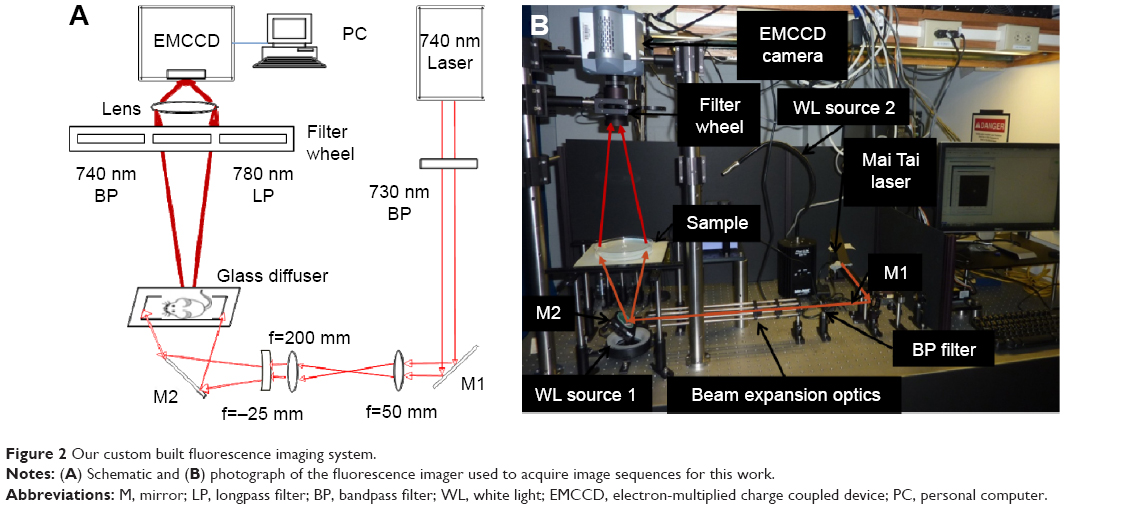 | Figure 2 Our custom built fluorescence imaging system. |
Samples were imaged with a high-sensitivity electron-multiplied charge coupled device camera (iXonEM +855; Andor Technology, Belfast, Northern Ireland) fitted with a 35 mm lens (NT54-689, Edmund Optics). The imaging field of view was 105×105 mm at a working distance of 47 cm. Each image was 1,004×1,006 pixels. Camera exposure time and image acquisition were controlled using a personal computer running Andor control software. Although the camera could be operated with intensifier gain, this was turned off for the experiments described later. The camera was fitted with either a 740 nm filter (to record “intrinsic” images at the laser wavelength), with a 40 nm bandpass (et740/40m, Chroma Technology) or a 780 nm longpass filter (et780lp, Chroma) to collect fluorescent light from the sample. The filters were mounted in a five-position filter wheel (LCFW5; Thorlabs, Newton, NJ, USA). White light images of the sample were acquired by moving the filter wheel to an open position so that all wavelengths were detected by the camera. Mice were top-illuminated with a white light source (Fiber Optic Illuminator Model 190; Dolan-Jenner Industries, Lawrence, MA, USA), whereas clear agar phantoms were back-illuminated with a light emitting diode ring (Digi-Slave L-Ring 3200; Edmund Optics).
Agar phantom preparation and imaging
Agar phantoms were placed on the imaging platform and trans-illuminated as described earlier. The movement of free AF 750 dye (Molecular Probes, Thermo Fisher Scientific), 30 nm NPs, and 200 nm NPs were tested in separate experiments to observe the effect of particle size on diffusion. Free dye and NPs were injected directly into the clear phantom with an insulin syringe from the top of the phantom to create a ~1 mm diameter vertical reservoir in the center of the dish. We note that the thickness of the phantom (10 mm) was very small relative to the total diameter of the phantom (240 mm). The phantoms were made in 250 mm diameter by 25 mm deep cell culture dishes (Corning Incorporated, Corning, NY, USA). The phantom material was made with 1.5 g of agarose (Acros Organics, Geel, Belgium) and 250 mL of distilled water resulting in 0.6% agar gel. The mixture was boiled for 10 minutes until the powdered agar was dissolved and then poured into the cell culture dish to cool and harden. We used 0.6% agarose phantoms because this model has been shown previously to mimic flow properties of a number of biological tissues including the brain.16–18 For experiments involving free dye, AF 750 was injected into the agar phantom and images were acquired at 15-minute intervals for a total of 3 hours (N=3). In this case, it was possible to continuously take measurements without removal of the phantom from the glass diffuser. Exposure times were 1 millisecond for intrinsic images (ie, at the wavelength of the laser) and were between 0.5 and 4 seconds for fluorescence images, depending on the acquisition time point (later times required longer exposures due to dye diffusion and dilution). For experiments involving NPs (30 and 200 nm diameter), the phantoms were imaged daily for 15 days after the injection of the NPs (N=3). To prevent drying of the agar, these phantoms were refrigerated between experiments. A wire marker was placed in the upper left hand corner to allow image co-registration between imaging sessions. For NP formulations, fluorescence images required between 0.5 and 30 seconds exposures (as aforementioned, longer exposures were required for later time points). White light images were taken of the phantoms by back-illumination with the light emitting diode ring during each imaging session.
In vivo experiments
Animal experiments were conducted in agreement with all relevant guidelines and regulations set by Northeastern University – Institutional Animal Care and Use Committee, and with approved institutional protocols by the American Association of Laboratory Animal Care. Six 6-week-old male athymic nude mice (Hsd:Athymic Nude-Foxn1nu) were procured from Charles River lab, and were housed in a group of six in standard cages with free access to food and water and a 12-hours light/dark cycle. All animals acclimated to the animal facility for at least 48 hours before experimentation. All possible parameters that may cause social stress, such as group size, type (treated and non-treated), among the experimental animals were carefully monitored and avoided. Animals were observed daily for any behavioral abnormalities and weighed weekly.
INCeRT spacers were implanted subcutaneously in mice using a sterile clinical brachytherapy applicator needle. Two NP or free-dye coated spacers were implanted in the left and right rear flanks of nude mice (N=4 spacers per case). Three groups of spacers were studied: 1) PLGA spacer doped with Cy7.5 free dye, 2) PLGA spacer doped with conCy7.5-NPs with average diameter 30 nm, 3) PLGA spacer doped with conCy7.5-NPs with average diameter 200 nm. Each mouse was imaged once per day for 15 days following implantation. It is important to note that the mice were imaged in trans-illumination mode (as opposed to reflection mode). As we discussed, trans-illumination imaging (combined with image normalization) is significantly more quantitatively accurate when imaging in deep tissue with significant optical inhomogeneities. During imaging, mice were placed on a custom mask to avoid saturation of the camera by direct laser illumination. Three sets of images were acquired during each imaging session as follows: first, white light images were acquired with a 1 second exposure time. Second, intrinsic images (at the wavelength of the laser) were acquired with the 740 nm filter in front of the camera and 5 milliseconds exposure times. This “intrinsic” image was used for normalization of the fluorescence images to improve quantitative accuracy.19 Third, fluorescence images were acquired with the 780 nm filter in front of the camera and exposure times were between 7.5 and 100 seconds, depending on the imaging time point.
Image processing and data analysis
We first performed basic pre-processing and normalization as follows. First, a dark field image was acquired (by capping the lens) and then subtracted from each image. All images were normalized to exposure time and laser intensity (which was measured on each day) so that the units were in photon counts/s/mW. Next, fluorescence images were normalized by pixel-by-pixel division by the corresponding intrinsic image. Other authors have shown previously that this normalization operation improves the accuracy of fluorescence images – particularly when imaged in trans-illumination geometry – since it accounts for the laser illumination profile and minor differences in illumination intensity. Normalization also improves quantitative accuracy in the presence of tissue optical property heterogeneities and improves imaging depth.19
Phantoms
Each of the data sets for agar phantoms injected with either free AF 750 dye, 30 nm, or 200 nm NPs was analyzed by first finding the center of the injection site using a custom written MATLAB (MathWorks, Natick, MA, USA) routine. Here, we have assumed that the physical diffusion of the free dye and NPs was isotropic in the agar. Images were then averaged radially from this center point for each time point. These intensity curves were then fit to a simple one dimensional diffusion equation with a point source:
|
|
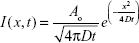
where I(x,t) was the intensity at each time and position, A0 was the total amount of diffusing substance, D was the diffusion coefficient, t was the time following injection, and x was the radial distance from the source.20 Equation 1 was fit to the averaged experimental data for each injection type to yield the diffusion coefficient D. The complete spatial and temporal profiles were used in each fit for each case.
In vivo data
The diffusion process in vivo is significantly more complex than in agar phantoms – for example, due to active transport of NPs away from the site of injection, tissue boundaries and inhomogeneities, and light diffusion – which prevented fitting of the simple diffusion equation as earlier. Therefore, diffusion of NPs and AF 750 dye from the implanted spaces was quantified using three additional metrics: i) diffusion area, ii) diffusion profile, and iii) spacer intensity. For the first (diffusion area), we considered the maximum fluorescent intensity for each time point and then computed the fluorescence area for pixels exceeding 50% of this value on each day (ie, the “full width at half maximum area”). Pixel numbers were converted to area (in mm2) using the calibrated image pixel size of 0.011 mm2. This area was calculated for each spacer and for each time point (N=4 for each). Second, we computed intensity (diffusion) profiles for the spacers at each time point. Since spacer orientation differed between mice, we first applied a thresholding routine to automatically identify the long and short axes of the cylindrically shaped spacer in the in vivo fluorescence images. Next, the fluorescence profiles were computed by averaging eleven lines orthogonal to the long axis of each spacer. Third, the mean fluorescence intensity of each spacer was computed as a function of time.
Results
In vitro characterization of NPs and spacers
Dynamic light scattering was used to determine the hydrodynamic diameter of the conCy7.5-NP. Two batches were prepared: one with an average diameter of 30 nm and the other with an average diameter of 200 nm particles. These sizes were confirmed using transmission electron microscopy as shown in Figure 1B and C, respectively. Spacers were flash frozen then fractured and mounted for scanning electron microscopy imaging. The cross-sectional image in Figure 1D shows an overall uniform distribution of the silica across the face of the spacer with additional panels showing the magnified distribution. Chemical analysis confirmed the pockets in the region of interest to be silica NPs.
Phantom results
The fluorescence images measured from agar phantoms injected with AF 750, 30 nm NPs, and 200 nm particles are shown in Figure 3A–D, E–H, and I–L, respectively. As is evident from these image sequences, the free dye diffused significantly more rapidly than the NPs (ie, on the order of minutes versus days) due to their larger size. As described earlier, normalized corrected fluorescent profiles were computed and are shown in Figure 4A–C for the three sets of injections. By inspection of these figures, diffusion of the NPs was small but significant over the 15-day period, whereas the diffusion of the free dye occurred rapidly over the span of a few hours. In all cases, the measured fluorescence intensity steadily decreased over time. This is shown explicitly in Figure 4D, where the maximum intensity is shown as a function of measurement time (intensity data for the free dye is shown in Figure 4D inset). In combination, Figure 4A–D indicates the anticipated size-dependent diffusion behavior, ie, that the larger NPs diffused less than either the smaller NPs or the free dye. Likewise, the one-dimensional diffusion equation (Equation 1) was then fit to the data from Figure 4A–C. The resulting diffusion coefficients (D) for each of the three sets of phantoms are shown in Figure 4E. As shown, the diffusion coefficient for the free dye was 24.92 mm2/day, 0.02 mm2/day for 30 nm NPs, and 0.01 mm2/day for 200 nm NPs. This agrees well with visual inspection of the diffusion behavior in Figure 4A–D and the anticipated size-dependency.
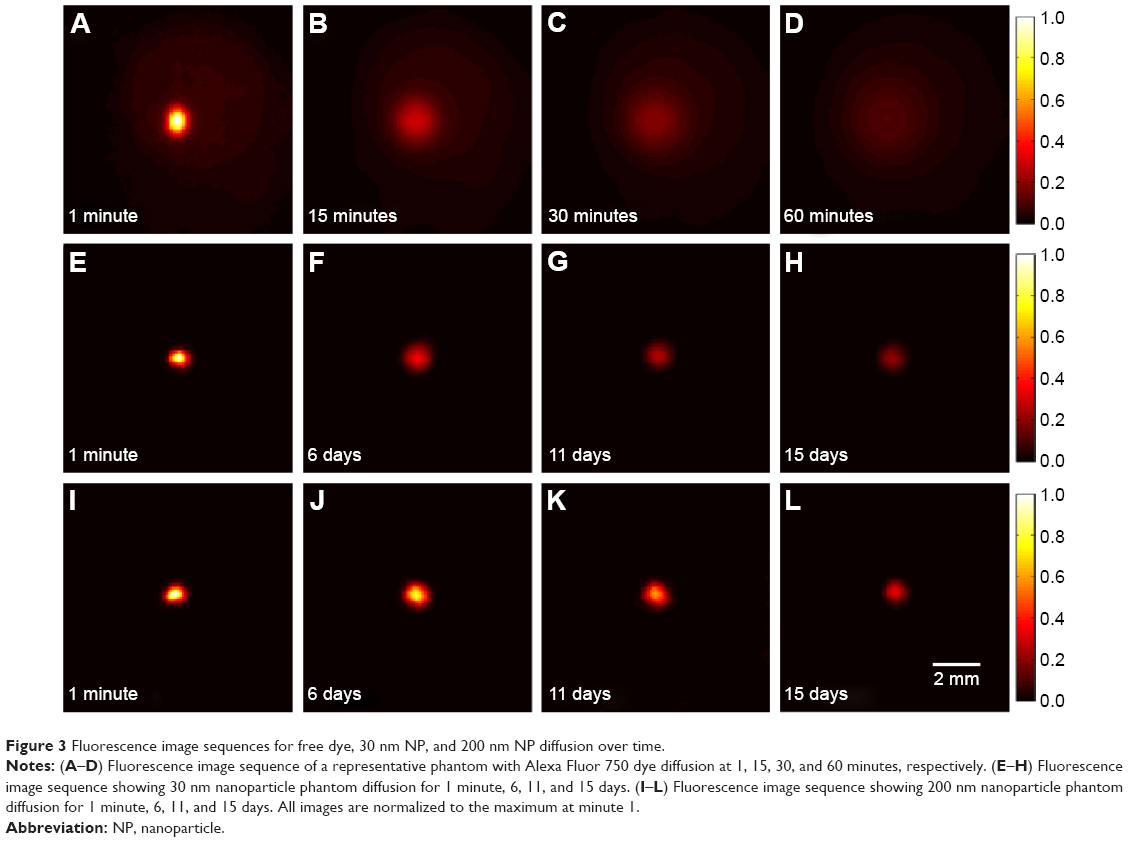 | Figure 3 Fluorescence image sequences for free dye, 30 nm NP, and 200 nm NP diffusion over time. |
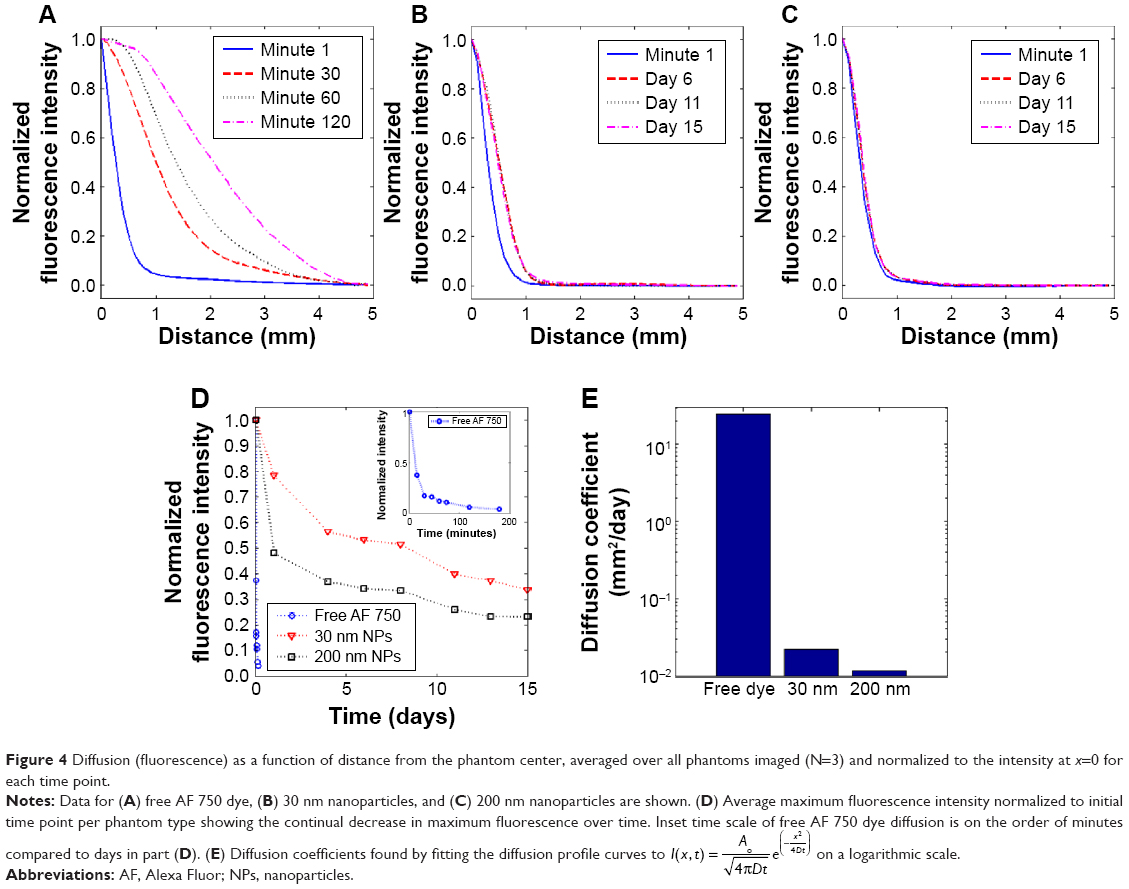 | Figure 4 Diffusion (fluorescence) as a function of distance from the phantom center, averaged over all phantoms imaged (N=3) and normalized to the intensity at x=0 for each time point. |
 on a logarithmic scale.
In vivo results
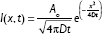
Spacers coated with either free dye (Cy7.5), 30 nm, or 200 nm NPs were implanted in the rear flanks of nude mice (N=4 for each) and then imaged daily for 15 days. Example representative image sets obtained for implanted spacers at a single time point in vivo are shown in Figure 5. A white light image of the mouse is shown in Figure 5A, with the position of the implanted spacers indicated by the red arrows. The normalized fluorescence image is shown in Figure 5B. For anatomical reference, an overlay of the normalized fluorescence image over the white light image of the animal is shown in Figure 5C. After the animals were euthanized, we also removed the skin layer and the spacers to image the residual fluorophores and NPs without light scatter due to the skin tissue. As shown in Figure 5D (in this case for Cy7.5 coated spacer), the residual fluorescence was still clearly visible and demonstrates the continuous diffusion from the spacer over time.
 | Figure 5 Example in vivo fluorescence image sequence of Cy7.5 spacers. |
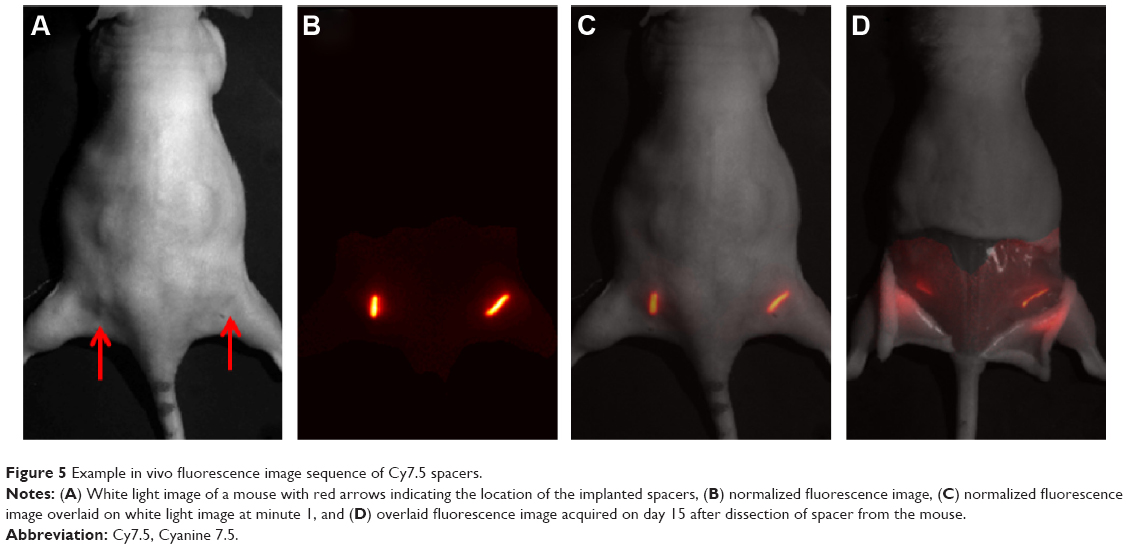
Time-series images for each of the three-spacer types (representative images) are shown in Figure 6. As is indicated, all of the spacers decreased in intensity over time due to continuous diffusion of the fluorescence from the spacers, and larger decrease was observed for spacers coated with NPs compared to free dye. Likewise, the fluorescence area appeared to increase over time due to this diffusion process. This is shown explicitly in Figure 7. The diffusion profiles for the free dye, 30 nm, and 200 nm NPs as a function of distance from the spacer over time are shown in Figure 7A–C, respectively. A small amount of diffusion (~1 mm) beyond the profile measured on day 1 is evident in all cases (we note that the diffusion profile observed on day 1 is principally due to light diffusion in scattering biological tissue, as opposed to fluorophores or NP diffusion from the spacer). The normalized fluorescence intensity for each case is shown in Figure 7D, indicating continuous diffusion of the fluorophores and NPs over time. Likewise, the full width at half-maximum fluorescence area is shown in Figure 7E. As shown, the area of diffusion reached its maximum on day 4 for the 30 nm NPs and day 6 for the 200 nm particles, indicating a size-dependence of the process (ie, diffusion was slower with the larger NPs). The fluorescence area decreased after this maxima, presumably due to active transport of the NPs away from the site of the spacer, for example, by blood vessels.
 | Figure 6 Example in vivo image sequence of Cy7.5 spacers in row 1 (top row), 30 nm NP spacers in row 2, and 200 nm NP spacers in row 3. |
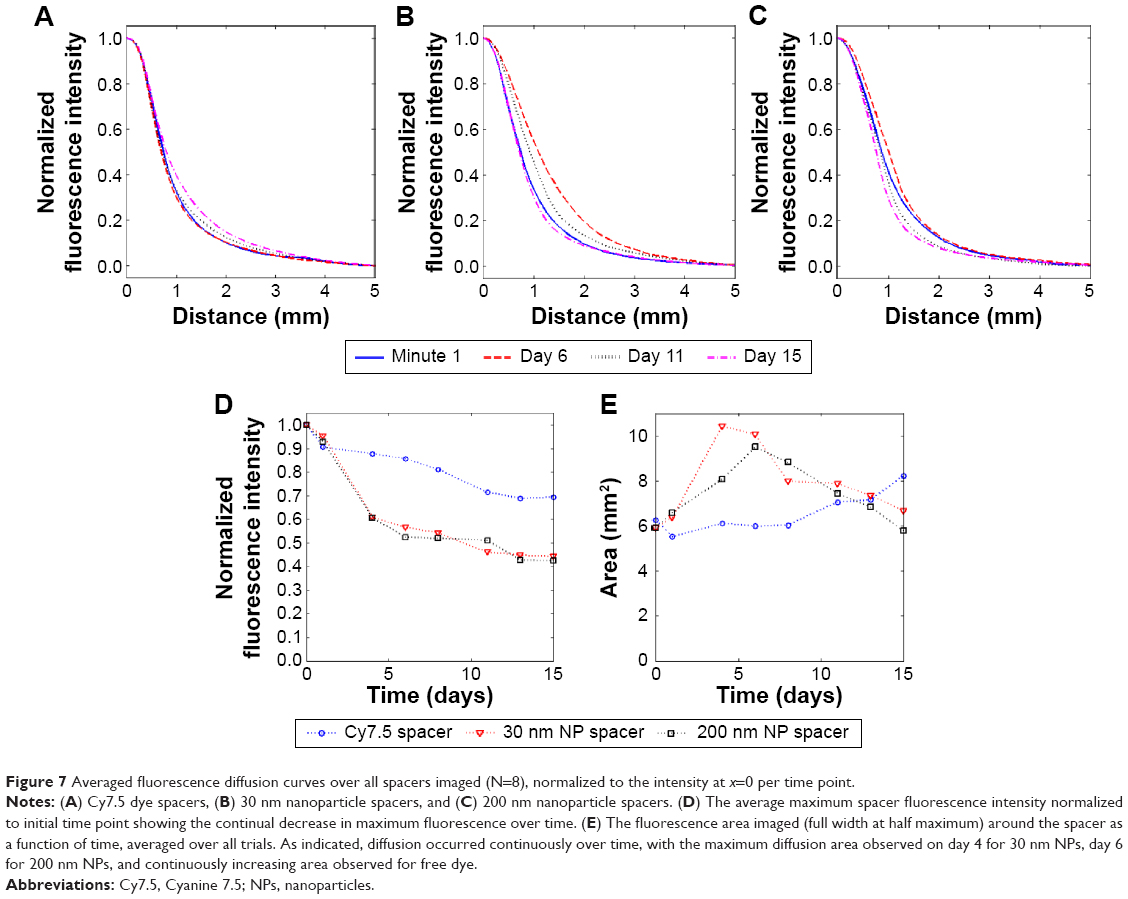 | Figure 7 Averaged fluorescence diffusion curves over all spacers imaged (N=8), normalized to the intensity at x=0 per time point. |
Discussion and conclusion
INCeRT represents a new strategy for local tumor control by which previously inert spacers are doped with drug-delivering NPs that diffuse from the biodegradable implant continuously over time. Ideally, NPs will be optimized so that they diffuse several mm from the implant site and are retained in the tissue for weeks, ie, to treat a large tumor volume for an extended time period. Optimization of these diffusion properties is difficult to measure in vivo. Therefore, in this work, we developed and validated a new custom fluorescence imaging platform to directly visualize and quantify diffusion of NPs in gel phantoms in vitro and in mice in vivo. In both cases, we observed size-dependent diffusion profiles as expected. In phantoms, this was a straightforward relationship that was well modeled by a one dimensional diffusion equation. In vivo, size-dependent diffusion was also observed, but was significantly more complex as we have noted earlier, due to both light propagation effects in biological tissue and active transport mechanisms that carry away NPs in tissue. However, in this proof-of-concept study we were able to confirm that NPs are indeed observed in tissue for weeks after implanting INCeRT spacers and are therefore not rapidly removed from the site.
This work provides an imaging platform by which the NPs can be further optimized for diffusion characteristics both in vitro and in vivo. The focus of future studies will be to characterize the influence of size, charge, pH, and tumor microenvironment on NP diffusion. Ongoing work involves use of our platform for optical measurement of NP diffusion from INCeRT spacers in alternate anatomical locations and tumor models, for example in prostate cancer where brachytherapy is often used as a salvage therapy in patients clinically.6,21 Understanding the release intratumorally will help optimize the spacer parameters to deliver the chemotherapeutic/radiosensitizer at sufficient doses for therapeutic efficacy for the entirety of the brachytherapy dose regimen. Our research interests lie in treating early stage, slow progressing, non-metastatic prostate cancer, and in salvage cases such as recurrence, where brachytherapy or internal radiation therapy is a common mode of treatment. During brachytherapy, clinicians space brachytherapy seeds with inert biocompatible spacers for highly controlled dosing of the prostate.21–23 Recurring tumor treatment is limited by previously given treatments due to the toxicity to the patient.24,25 Adding an implant to brachytherapy can reduce the toxicity seen to healthy tissue while radiosensitizing the local prostate tumor for a greater chance of therapeutic effect, acting as a slow release drug depot for simultaneous combinatorial chemo and radiation therapy. The robust platform can be tailored for a controlled and continuous release of the drug/radiosensitizer from the spacer for a sustained local delivery of high therapeutic dose optimal for long-term brachytherapy treatments.
As we have demonstrated, NIR imaging has distinct advantages in that it allows us to image the same animal serially over the course of weeks, non-invasively, and at a relatively low cost. We developed and used a custom imaging system because it allowed us to flexibly select the excitation and emission wavelengths specific to the fluorochrome of interest (which could be altered in the future if needed), and since it allows us to image mice in trans-illumination geometry and perform the image normalization procedure described herein. Moreover, the system’s spatial resolution and field of view allowed us to observe and quantify the NP diffusion both in vitro and in vivo. In the future, we could potentially also incorporate higher-resolution structural imaging data (for example, from magnetic resonance imaging, X-ray-computed tomography, or opto-acoustic imaging) to improve quantification of NP diffusion in complex tissues. The imaging platform demonstrated in this work can be used to determine the release profile of these spacers to alter the parameters of the implant for an optimized release profile to mimic that of what is seen in brachytherapy for sustained combinatorial treatment.
Disclosure
This work was supported by Integrative Graduate Education and Research Traineeship Nanomedicine Science and Technology NSF-DGE-0965843 (principal investigator S Sridhar), fellowships to J Belz and S Markovic, and a Massachusetts Life Sciences Center New Investigator Award to M Niedre. The authors report no other conflicts of interest in this work.
References
Implants in Drug Delivery. In: Ranade VV, Cannon JB, editors. Drug Delivery Systems. 3rd ed. Boca Raton, Florida: CRC Press; 2011. | ||
Chang-Lin JE, Attar M, Acheampong AA, et al. Pharmacokinetics and pharmacodynamics of a sustained-release dexamethasone intravitreal implant. Invest Ophthalmol Vis Sci. 2011;52(1):80–86. | ||
Cormack RA, Sridhar S, Suh WW, D’Amico AV, Makrigiorgos GM. Biological in situ dose painting for image-guided radiation therapy using drug-loaded implantable devices. Int J Radiat Oncol Biol Phys. 2010;76(2):615–623. | ||
Friedland JL, Freeman DE, Masterson-McGary ME, Spellberg DM. Stereotactic body radiotherapy: an emerging treatment approach for localized prostate cancer. Technol Cancer Res Treat. 2009;8(5): 387–392. | ||
Sylvester JE, Grimm PD, Eulau SM, Takamiya RK, Naidoo D. Permanent prostate brachytherapy preplanned technique: the modern Seattle method step-by-step and dosimetric outcomes. Brachytherapy. 2009;8(2):197–206. | ||
Kumar R, Belz J, Markovic S, et al. Nanoparticle-based brachytherapy spacers for delivery of localized combined chemoradiation therapy. Int J Radiat Oncol Biol Phys. 2015;91(2):393–400. | ||
National Cancer Institute [homepage on the Internet]. Prostate Cancer Treatment (PDQ®). NIH National Cancer Institute; 2014. Available from: http://www.cancer.gov/cancertopics/pdq/treatment/prostate/Patient. Accessed December 6, 2015. | ||
Tishler RB, Geard CR, Hall EJ, Schiff PB. Taxol sensitizes human astrocytoma cells to radiation. Cancer Res. 1992;52(12): 3495–3497. | ||
Castro Kreder N, Van Bree C, Franken NA, Haveman J. Effects of gemcitabine on cell survival and chromosome aberrations after pulsed low dose-rate irradiation. J Radiat Res. 2004;45(1):111–118. | ||
Frangioni JV. In vivo near-infrared fluorescence imaging. Curr Opin Chem Biol. 2003;7(5):626–634. | ||
Lin Y, Weissleder R, Tung CH. Novel near-infrared cyanine fluorochromes: synthesis, properties, and bioconjugation. Bioconjug Chem. 2002;13(3):605–610. | ||
Ghoroghchian PP, Therien MJ, Hammer DA. In vivo fluorescence imaging: a personal perspective. Wiley Interdiscip Rev Nanomed Nanobiotechnol. 2009;1(2):156–167. | ||
Kumar R, Roy I, Ohulchanskyy TY, et al. Covalently dye-linked, surface-controlled, and bioconjugated organically modified silica nanoparticles as targeted probes for optical imaging. ACS Nano. 2008;2(3): 449–456. | ||
Kumar R, Roy I, Ohulchanskky TY, et al. In vivo biodistribution and clearance studies using multimodal organically modified silica nanoparticles. ACS Nano. 2010;4(2):699–708. | ||
Wang L, Wu H, Biomedical Optics: Principles and Imaging. 1st ed. Hoboken (NJ): Wiley-Interscience; 2007. | ||
Chen ZJ, Gillies GT, Broaddus WC, et al. A realistic brain tissue phantom for intraparenchymal infusion studies. J Neurosurg. 2004;101(2):314–322. | ||
Cubeddu R, Pifferi A, Taroni P, Torricelli A, Valentini G. A solid tissue phantom for photon migration studies. Phys Med Biol. 1997;42(10):1971–1979. | ||
Pomfret R, Miranpuri G, Sillay K. The substitute brain and the potential of the gel model. Ann Neurosci. 2013;20(3):118–122. | ||
Ntziachristos V, Turner G, Dunham J, et al. Planar fluorescence imaging using normalized data. J Biomed Opt. 2005;10(6):064007. | ||
Crank J. The Mathematics of Diffusion. 2nd ed. New York: Oxford University Press; 1979. | ||
Martin JM, Handorf EA, Kutikov A, et al. The rise and fall of prostate brachytherapy: use of brachytherapy for the treatment of localized prostate cancer in the National Cancer Data Base. Cancer. 2014;120(14):2114–2121. | ||
American Cancer Society [homepage on the Internet]. Prostate Cancer That Remains or Recurs after Treatment. American Cancer Society; 2015. Available from: http://www.cancer.org/cancer/prostatecancer/detailedguide/prostate-cancer-treating-recurrence. Accessed December 6, 2015. | ||
Frank SJ, Pisters LL, Davis J, Lee AK, Bassett R, Kuban DA. An assessment of quality of life following radical prostatectomy, high dose external beam radiation therapy and brachytherapy iodine implantation as monotherapies for localized prostate cancer. J Urol. 2007;177(6):2151–2156. | ||
Zietman AL, Bae K, Slater JD, et al. Randomized trial comparing conventional-dose with high-dose conformal radiation therapy in early-stage adenocarcinoma of the prostate: long-term results from proton radiation oncology group/american college of radiology 95-09. J Clin Oncol. 2010;28(7):1106–1111. | ||
Kuban DA, Tucker SL, Dong L, et al. A long-term results of the M. D. Anderson randomized dose-escalation trial for prostate cancer. Int J Radiat Oncol Biol Phys. 2008;70(1):67–74. |
 © 2016 The Author(s). This work is published and licensed by Dove Medical Press Limited. The
full terms of this license are available at https://www.dovepress.com/terms
and incorporate the Creative Commons Attribution
- Non Commercial (unported, 3.0) License.
By accessing the work you hereby accept the Terms. Non-commercial uses of the work are permitted
without any further permission from Dove Medical Press Limited, provided the work is properly
attributed. For permission for commercial use of this work, please see paragraphs 4.2 and 5 of our Terms.
© 2016 The Author(s). This work is published and licensed by Dove Medical Press Limited. The
full terms of this license are available at https://www.dovepress.com/terms
and incorporate the Creative Commons Attribution
- Non Commercial (unported, 3.0) License.
By accessing the work you hereby accept the Terms. Non-commercial uses of the work are permitted
without any further permission from Dove Medical Press Limited, provided the work is properly
attributed. For permission for commercial use of this work, please see paragraphs 4.2 and 5 of our Terms.