Back to Journals » International Journal of Nanomedicine » Volume 13
Nanostructured titanium regulates osseointegration via influencing macrophage polarization in the osteogenic environment
Authors Wang J, Meng F, Song W ![]() , Jin J, Ma Q, Fei D
, Jin J, Ma Q, Fei D ![]() , Fang L, Chen L, Wang Q, Zhang Y
, Fang L, Chen L, Wang Q, Zhang Y
Received 28 January 2018
Accepted for publication 24 April 2018
Published 10 July 2018 Volume 2018:13 Pages 4029—4043
DOI https://doi.org/10.2147/IJN.S163956
Checked for plagiarism Yes
Review by Single anonymous peer review
Peer reviewer comments 2
Editor who approved publication: Dr Linlin Sun
Jinjin Wang,1,2,* Fanhui Meng,3,* Wen Song,3,* Jingyi Jin,2 Qianli Ma,2 Dongdong Fei,1 Liang Fang,2 Lihua Chen,2 Qintao Wang,1 Yumei Zhang3
1State Key Laboratory of Military Stomatology & National Clinical Research Center for Oral Diseases & Shaanxi Engineering Research Center for Dental Materials and Advanced Manufacture, Department of Periodontology, School of Stomatology, The Fourth Military Medical University, Xi’an, Shannxi Province, China; 2Department of Immunology, School of Basic Medicine, The Fourth Military Medical University, Xi’an, Shannxi Province, China; 3State Key Laboratory of Military Stomatology & National Clinical Research Center for Oral Diseases & Shaanxi Key Laboratory of Stomatology, Department of Prosthodontics, School of Stomatology, The Fourth Military Medical University, Xi’an, Shannxi Province, China
*These authors contributed equally to this work
Introduction: Fabricating nanostructured surface topography represents the mainstream approach to induce osteogenesis for the next-generation bone implant. In the past, the bone implant was designed to minimize host repulsive reactions in order to acquire biocompatibility. However, increasing reports indicate that the absence of an appropriate immune response cannot acquire adequate osseointegration after implantation in vivo.
Materials and methods: We prepared different topographies on the surface of titanium (Ti) specimens by grinding, etching and anodizing, and they were marked as polished specimen (P), specimen with nanotubes (NTs) in small diameters (NT-30) and specimen with NTs in large diameters (NT-100). We evaluated the ability of different topographies of the specimen to induce osteogenic differentiation of mice bone marrow mesenchymal stem cells (BMSCs) in vitro and to induce osseointegration in vivo. Furthermore, we investigated the effect of different topographies on the polarization and secretion of macrophages, and the effect of macrophage polarization on topography-induced osteogenic differentiation of mice BMSCs. Finally, we verified the effect of macrophage polarization on topography-induced osseointegration in vivo by using Cre*RBP-Jfl/fl mice in which classically activated macrophage was restrained.
Results: The osteogenic differentiation of mice BMSCs induced by specimen with different topographies was NT-100>NT-30>P, while the osseointegration induced by specimen with different topographies in vivo was NT-30>NT-100>P. In addition, specimen of NT-30 could induce more macrophages to M2 polarization, while specimen of P and NT-100 could induce more macrophages to M1 polarization. When co-culture mice BMSCs and macrophages on specimen with different topographies , the osteogenic differentiation of mice BMSCs was NT-30>NT-100≥P. The osseointegration induced by NT-100 in Cre*RBP-Jfl/fl mice was much better than that of wild type mice.
Conclusion: It is suggested that the intrinsic immunomodulatory effects of nanomaterials are not only crucial to evaluate the in vivo biocompatibility but also required to determine the final osseointegration. To clarify the immune response and osseointegration may be beneficial for the designation and optimization of the bone implant.
Keywords: nanomaterials, topography, immunomodulatory effects, macrophage polarization, osseointegration
Introduction
With the development of nanotechnology, the application of nanomaterials in the biological area is considered a promising strategy.1 A number of nanomaterials have been produced to induce various biological functions in vivo.2,3 However, the majority of the work only focuses on the biological effects of nanomaterials while their intrinsic immunomodulatory effects are often neglected.4–6 Take the bone implant materials: for example, titanium (Ti) metal is extensively used in clinical practice due to its outstanding osseointegration ability. Recently, the influence of Ti implant on macrophage adhesion and the effects of macrophage activation on osseointegration have been noticed.7–10
In fact, the immune response is a primary reaction after exogenous pathogen invasion and the category of immune cells arriving at implantation sites determines the development of inflammation and the consequent healing process.11–13 Hence, to take the immunomodulatory effects of biomaterials into consideration is of great importance.14–16 Specifically, macrophages are implicated in almost all parts of the natural process of wound healing,17 and the polarization states of macrophages have vital effects on wound healing and the biological performances of biomaterials.18–20 The M1 phenotype of macrophages manifested increased production of pro-inflammatory cytokines such as interleukin (IL)-6, tumor necrosis factor alpha (TNF-α), interferon gamma (IFN-γ), and inducible nitric oxide synthase (iNOS) to promote inflammation. By contrast, the M2 phenotype of macrophages could contribute to the resolution of inflammation and wound healing by producing various anti-inflammatory cytokines such as IL-10 and arginase-1 (Arg-1).21 To comprehensively address the osseointegration capability of inserted implants, both osteogenic cells and macrophages are required to be evaluated.
Previously, our group has devoted tremendous efforts to developing controllable nanotopographies on the Ti implant surface for enhanced osteoinduction capacity. We have found that the different nanotopographies on the Ti surface could make differences in osteogenic differentiation of human osteoblasts and bone marrow mesenchymal stem cells (BMSCs) simply in vitro.22–26 Given the important roles macrophages may play in the healing process of Ti implants, it is urgent to figure out whether the macrophages can be influenced by different nanotopographies and whether the osseointegration can be influenced by nanotopography-induced macrophage activation. In our previous studies, we have found that the different nanotopographies can induce distinct macrophage responses both in vitro and in vivo, which might be closely related to the osseointegration outcomes.27 Unfortunately, detailed information such as the mutual interaction between macrophages and BMSCs and the association between macrophage activation and osseointegration has not yet been elucidated. Therefore, the aim of the present study is to systematically investigate the immunomodulatory effects of the nanotopographies and their influences on BMSC osteogenic differentiation and osseointegration.
Materials and methods
Fabrication of Ti specimen
The pure Ti rods (1 mm in diameter and 2 mm in length) and circular Ti plates (15 mm in diameter and 1 mm in thickness) were sequentially wet-polished with SiC sandpaper from 400 to 7,000 meshes to obtain the polished specimen (P). The different nanotopographies were fabricated by acid etching and anodization after polishing according to our previous reports.22–26 TiO2 nanotubes (NTs) were prepared by anodic oxidation for 1 h in the electrolyte comprised of 372 mL deionized water, 23 mL of 85% phosphate, 5 mL hydrofluoric acid under different voltages of 5 V (NT-30) and 20 V (NT-100), respectively. The fabricated topography was observed by field emission scanning electron microscope (FE-SEM; Hitachi Ltd, Tokyo, Japan) and atomic force microscope (AFM; Shimadzu, Kyoto, Japan). The fabricated specimens were ultrasonically cleaned in acetone, absolute ethanol, and deionized water sequentially and then sterilized by soaking in 75% ethanol for 6–8 h and ultraviolet radiation for at least 30 min.
Cell culture
The separation and culture of mice BMSCs
The BMSCs were isolated from femurs and tibias of 6–8-week-old C57BL/6 mice. In general, the whole bone marrow contents were flushed out of the bone cavity using phosphate-buffered saline (PBS; HyClone, South Logan, UT, USA) with 1% fetal bovine serum (HyClone). Red blood cells were lysed in the flushing liquid with the lysing buffer (Tiangen, Beijing, China). After centrifugation at 1,200 rpm/min for 5 min, cells were cultured in α-minimal Eagle’s medium (HyClone) supplemented with 20% fetal bovine serum (FBS; HyClone) and 50 U/mL penicillin–50 μg/mL streptomycin (HyClone) at 37°C in a 100% humidity atmosphere of 5% CO2. After 9–12 days, the clustered adherent cells were considered BMSCs and they were passaged and seeded onto blank culture plates (negative control, NC) and Ti surface with different topographies in the culture of osteoinductive medium (Cyagen Biosciences, Santa Clara, CA, USA).
The separation and culture of mice bone marrow-derived macrophages (BMDMs)
BMDMs were isolated in the same way as BMSCs. Cells were cultured as described by previous studies.28 The flushing cells from bone marrow were seeded on the 10-cm culture plate and induced to BMDMs in 15 mL Iscove’s Modified Dubecco’s Medium (HyClone), supplemented with 10 ng/mL macrophage colony-stimulating factor (Peprotech, Inc., Rocky Hill, NJ, USA), 10% FBS and 50 U/mL penicillin–50 μg/mL streptomycin at 37°C in a 100% humidity atmosphere of 5% CO2. After 7 days, BMDMs were scraped off and seeded onto blank culture plates and Ti surface with different topographies.
The collection, preparation, and application of macrophage conditioned medium (MCM)
BMDMs were seeded onto blank culture plates and Ti surface with different topographies. After 3-day culture, the supernatants in NC, P, NT-30, and NT-100 were harvested, centrifuged at 12,000 rpm/min for 10 min respectively, and stored at −80°C. The supernatants were then diluted 1:1 in the complete culture medium of BMSCs and denoted as MCM of NC, P, NT-30, and NT-100, respectively.
BMSCs were seeded onto blank culture plates and Ti surface with different topographies. After culturing for 24 h, the osteoinductive medium of BMSCs in each group was replaced by the corresponding topography-mediated MCM.
Animal surgery
The animal procedures were in accordance with guidelines for the management and use of laboratory animals and approved by the University Research Ethics Committee of The Fourth Military Medical University. Twenty-four male wild-type (WT) mice and 8 male Cre*RBP-Jfl/fl (knockout [KO]) mice, aged 6–8 weeks and weighing approximately 20 g, were included. The 24 WT mice were randomly distributed into 3 groups (n=8 per group). After intraperitoneal anesthesia with 1% sodium pentobarbital (0.1 mL/10 g body weight), a hole of 1 mm in diameter was prepared in the distal end of metaphysis of the femurs of mice by a fissure bur for the implantation. Then, Ti specimens with different topographies (P, NT-30, and NT-100) were implanted into the holes in bilateral femurs of mice respectively, and the bilateral femurs of each mouse were implanted with a Ti specimen with the same topography. A Ti specimen of NT-100 was inserted into the femurs of KO mice following the procedures above. After implantation, muscles and skins were sutured severally and carefully. After 3 weeks, the mice were sacrificed and femur samples were obtained.
Micro-computed tomography (CT) scanning
After fixation in 4% paraformaldehyde for 24 h, femur samples (n=8 per group) were scanned by a micro-CT scanner (YXLON International GmbH, Hamburg, Germany). The region of interest (ROI) was defined as 2 mm around the implant, and the images were analyzed via VGStudio Max 2.2 (Volume Graphic, Heidelberg, Germany). Samples of each group were measured for calculation of the new bone volume ratio (bone volume to total volume, BV/TV), trabecular thickness (TbTh), trabecular numbers (TbN), and trabecular separation (TbSp).
Push-in tests
Femur samples (n=8 per group) containing an implant were embedded into autopolymerizing resin with the top surface at the implant level. The osseointegration intensity of the implants was evaluated by an AGTA electronic universal testing machine (Shimadzu). The implant was loaded vertically downward by a pushing rod of 0.7 mm in diameter at a crosshead speed of 1 mm/min. The value of the push-in test was determined by measuring the peak of the load-displacement curve.
Immunohistochemical (IHC) staining
After micro-CT scanning, samples (n=8 per group) were decalcified in 10% EDTA (Sigma-Aldrich Co., St Louis, MO, USA) for 3 weeks. After decalcification, Ti rods were easily removed from femurs. After dehydrating sequentially by serial ethanol, samples were embedded in paraffin and sectioned (4 μm thickness), followed by IHC staining of iNOS (Abcam, Cambridge, UK) and CD163 (Santa Cruz Biotechnology Inc., Dallas, TX, USA) using the streptavidin–peroxidase method. The detailed procedure for IHC followed the manufacturer’s protocols (ZSGB-BIO, Beijing, China). Target molecules were then visualized using diaminobenzidine (ZSGB-BIO). The histological images were photographed by optical microscope (Olympus Corporation, Tokyo, Japan) and analyzed by ImageJ software (National Institutes of Health, Bethesda, MD, USA).
Quantitative reverse transcription polymerase chain reaction (RT-qPCR)
The total RNA of mice BMDMs and mice BMSCs was extracted using Trizol reagent (Takara, Tokyo, Japan) and quantified using a Nanodrop 2000 (Thermo Fisher Scientific, Waltham, MA, USA). Then, 500 ng total RNA was reverse transcribed for the first-strand cDNA (Takara) which was used to perform RT-qPCR. The detailed procedure for RT-qPCR followed the manufacturer’s protocols (Takara). The primers used in this study are presented in Table 1.
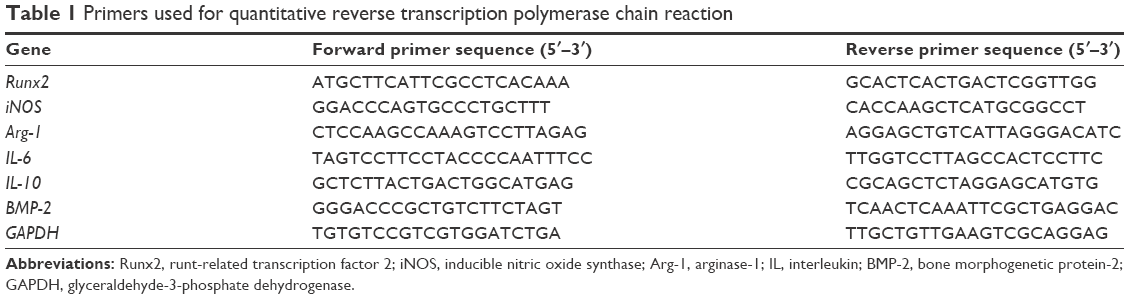 | Table 1 Primers used for quantitative reverse transcription polymerase chain reaction |
Cytoimmunofluorescence staining
BMDMs were seeded onto blank culture plates and Ti surface with different topographies in 24-well plates (1.5×10⁵ cells/well). After 3-day incubation, cells were rinsed twice with PBS and fixed in 4% paraformaldehyde for 20 min at ambient temperature. Permeabilization with 0.1% Triton X-100 for 10 min was followed by washing twice with PBS. Then, cells were blocked by 1% bovine serum albumin (BSA) in PBS for 20 min at ambient temperature. After that, cells were incubated with the anti-iNOS antibody (Abcam) or the anti-CD163 antibody (Santa Cruz) after 1% BSA incubation overnight at 4°C. Target molecules were then visualized using Cy3-conjugated secondary antibodies (CW-BIO, Beijing, China). Cells were counterstained with 4′,6-diamidino-2-phenylindole (Hoffman-La Roche Ltd., Basel, Switzerland) and photographed using a confocal laser scanning microscope (Olympus). All samples were analyzed in triplicate and fluorescence intensities were quantitatively analyzed using NIH ImageJ software.
Flow cytometry
BMDMs were seeded onto blank culture plates and Ti surface with different topographies in 24-well plates (1.5×10⁵ cells/well). Macrophage surface markers CCR7 (M1) and CD206 (M2) were detected by flow cytometry for evaluating the different phenotypes. After 3-day incubation, cells were scraped off, centrifuged, and resuspended in purified anti-mouse CD16/32 (Biolegend, San Diego, CA, USA) for 10 min at 4°C to block the nonspecific antigens. Then, BMDMs were incubated with PE-conjugated CCR7 (Biolegend) and PerCP-conjugated CD206 (Biolegend) for 30 min at 4°C. The isotype controls were PE-conjugated rat IgG2a, k and PerCP-conjugated Rat IgG2a, k (Biolegend). After washing twice in PBS, BMDMs were resuspended in PBS and analyzed on a flow cytometer (NovoCyte; ACEA Biosciences, San Diego, CA, USA). All samples were analyzed in triplicate.
Cytokine profiling
BMDMs were seeded onto blank culture plates and Ti surface with different topographies in 24-well plates (1.5×10⁵ cells/well). After 3-day incubation and 7-day incubation, the supernatants were collected and centrifuged at 12,000 rpm/min respectively. Cell cytokines in supernatants of each group were measured and analyzed by protein array (Ray Biotech, Guangzhou, China) and three replicates were set in each assay.
Alkaline phosphatase (ALP) assay
BMSCs were seeded onto blank culture plates and Ti surface with different topographies in 24-well plates (1.5×10⁵ cells/well) in the culture of osteoinductive culture medium or MCM. After 7 days of culture, cells were fixed with 4% paraformaldehyde for 30 min. After washing twice with PBS, cell staining was performed using the BCIP/NBT ALP color development kit (Leagene, Beijing, China) overnight at ambient temperature. In addition, BMSCs were washed and lysed in 1% Triton X-100 and the ALP activity in the lysis was determined by a colorimetric assay based on p-nitrophenyl phosphate. The intracellular total protein content was determined with a BCA kit (Solarbio, Beijing, China). The ALP activity was normalized to total intracellular protein.
Quantification of mineralization
BMSCs were seeded onto blank culture plates and Ti surface with different topographies in 24-well plates (1.5×10⁵ cells/well). After 3 weeks of culture, cells were fixed with 4% paraformaldehyde for 30 min. After washing twice with PBS, cells were stained with alizarin red S (pH 4.2; Sigma-Aldrich) at ambient temperature for 30 min. After washing with PBS 3 times, results were imaged for qualitative data by a stereomicroscope (Leica Microsystems, Wetzlar, Germany). To quantify alizarin red stain, each well had 10% cetylpyridinium chloride solution added and the absorbance of samples was measured via spectrophotometry at 620 nm in triplicate using a spectrophotometric microplate reader (Bio-Rad Laboratories Inc., Hercules, CA, USA).
Statistical analysis
All data are shown as mean±standard deviation and were analyzed using one-way analysis of variance followed by Bonferroni’s post-hoc test for parametric data and Kruskal–Wallis test followed by a Dunn’s Multiple comparison test for nonparametric data through the GraphPad Prism statistical program (GraphPad Software Inc., La Jolla, CA, USA). p<0.05 was considered to be significant and p<0.01 was considered to be highly significant.
Results
The topography of nanostructured Ti specimens
Through FE-SEM observation, densely and uniformly distributed TiO2 NTs could be detected with diameters of 30 nm (NT-30) and 100 nm (NT-100) respectively and the surface of P was specular with some polishing scratches (Figure 1A–B). The AFM showed that the surface roughness of the P group material was the smallest, while the surface roughness of the NT-30 and NT-100 groups was much bigger (Figure 1C). The roughness parameters of average height and root mean square height also revealed the same trend (Figure 1D).
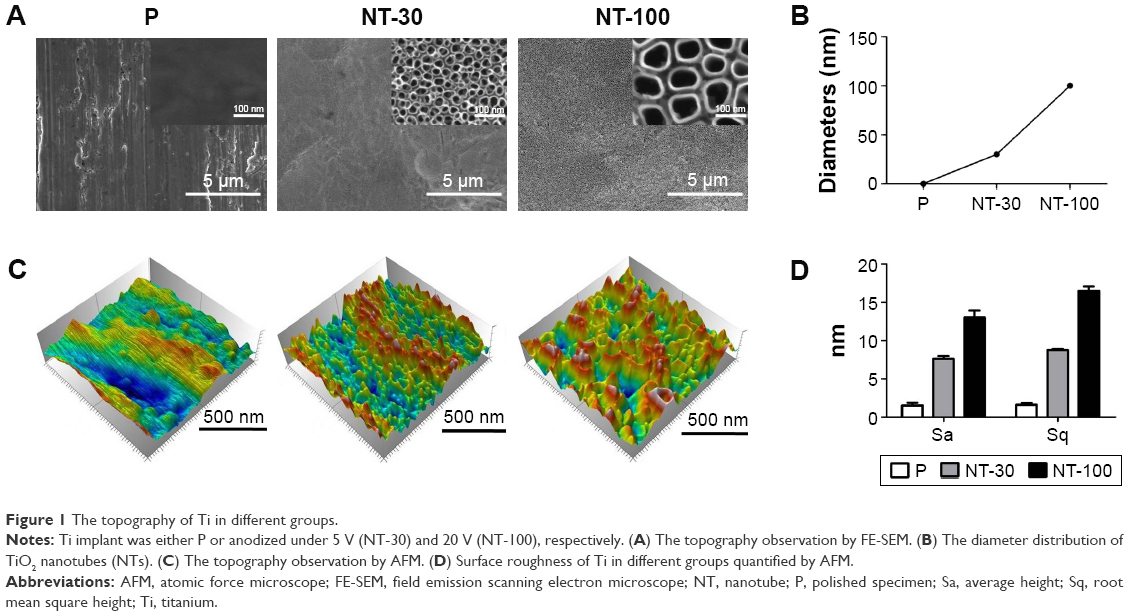 | Figure 1 The topography of Ti in different groups. |
The effects of topography of Ti implants on the osteogenic differentiation of BMSCs
The induction of nanostructured Ti to the osteogenic differentiation of BMSCs was determined by staining for ALP, mineralized extracellular matrix (ECM) as well as RT-qPCR analysis of osteogenesis-related gene expression (Figure 2). The expression of BMP-2 and Runx2 was significantly enhanced in NT-100 compared with NT-30 (Figure 2A). At 1 week, ALP synthesis by BMSCs of NT-30 and NT-100 was increased compared with that of NC and P, but BMSCs of NT-100 still produced more ALP than those of NT-30 (Figure 2B). At 3 weeks, through alizarin red staining, we found that BMSCs on the NT-100 surface showed the highest mineralization ability, while the mineralization ability of BMSCs on P was almost as low as it was in NC (Figure 2C).
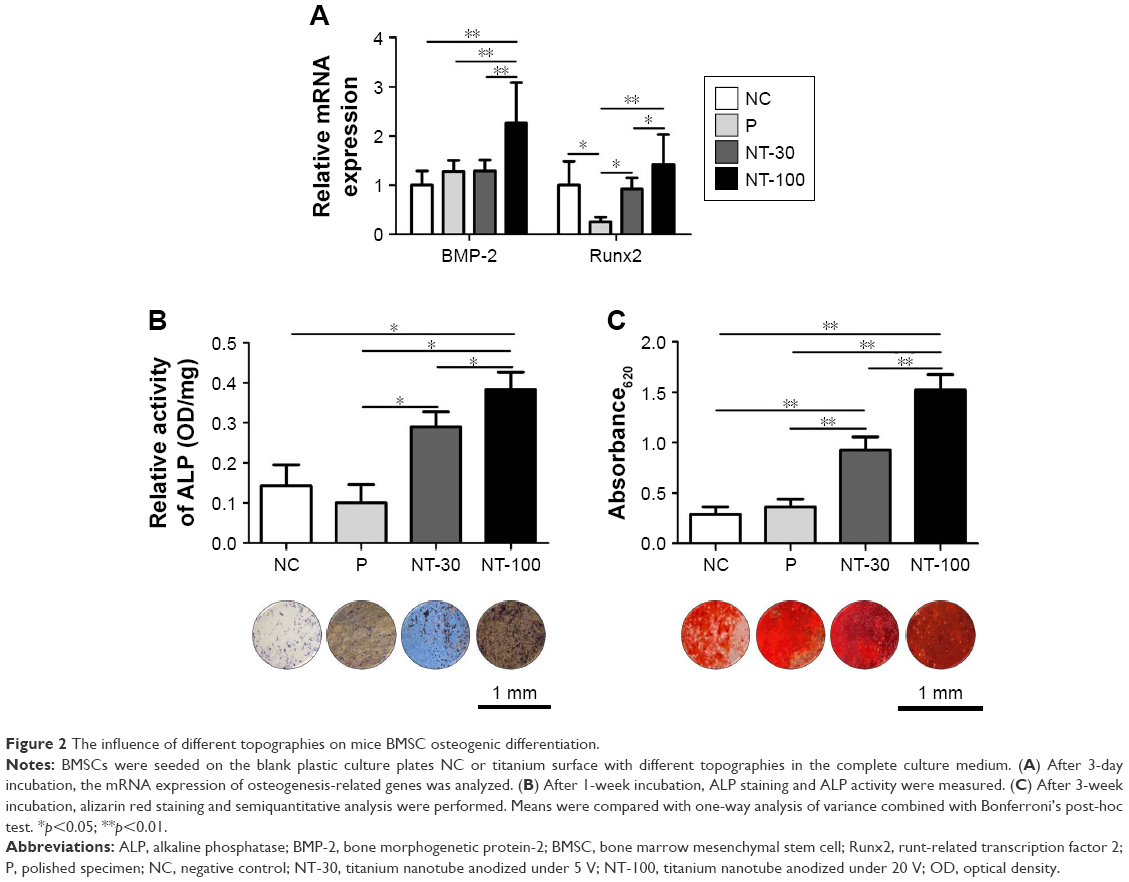 | Figure 2 The influence of different topographies on mice BMSC osteogenic differentiation. |
The osseointegration of Ti implants with different topographies in vivo
The osseointegration of Ti implants with different topographies was assessed in vivo (Figure 3). The micro-CT scanning indicated that the implants were surrounded by bone without any notable gap in all groups, indicating the successful bone formation around implants (Figure 3A). However, the analysis of BV/TV, TbTh, TbSp, and TbN in the ROI revealed that the bone trabecula around implants in NT-30 was the thickest and densest (Figure 3B). Furthermore, in push-in examinations, implants of NT-30 exhibited the greatest resistance force, suggesting the better osseointegration in NT-30 group (Figure 3C).
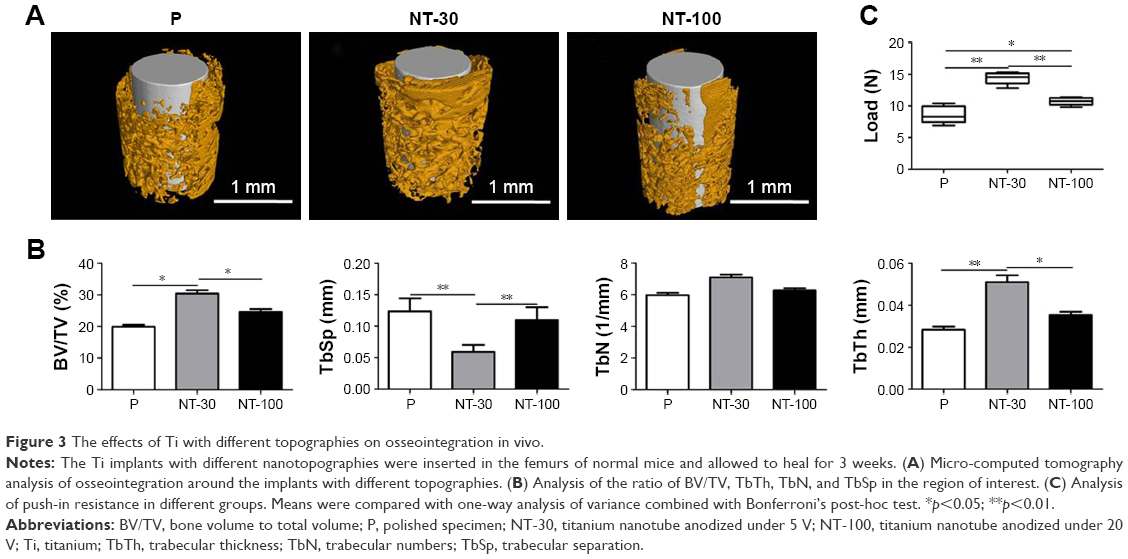 | Figure 3 The effects of Ti with different topographies on osseointegration in vivo. |
The effects of topography on the recruitment of macrophages with different subtypes in vivo
The polarization states of macrophages infiltrating around implants were evaluated (Figure 4). From the results of IHC staining, both iNOS-positive cells and CD163-positive cells could be found in the bone tissues around the implants (Figure 4A). However, compared with other groups, the ratio of M1/M2 macrophages in NT-30 was much lower than that in P and NT-100, and the ratio of M1/M2 macrophages in NT-100 was the highest (Figure 4B).
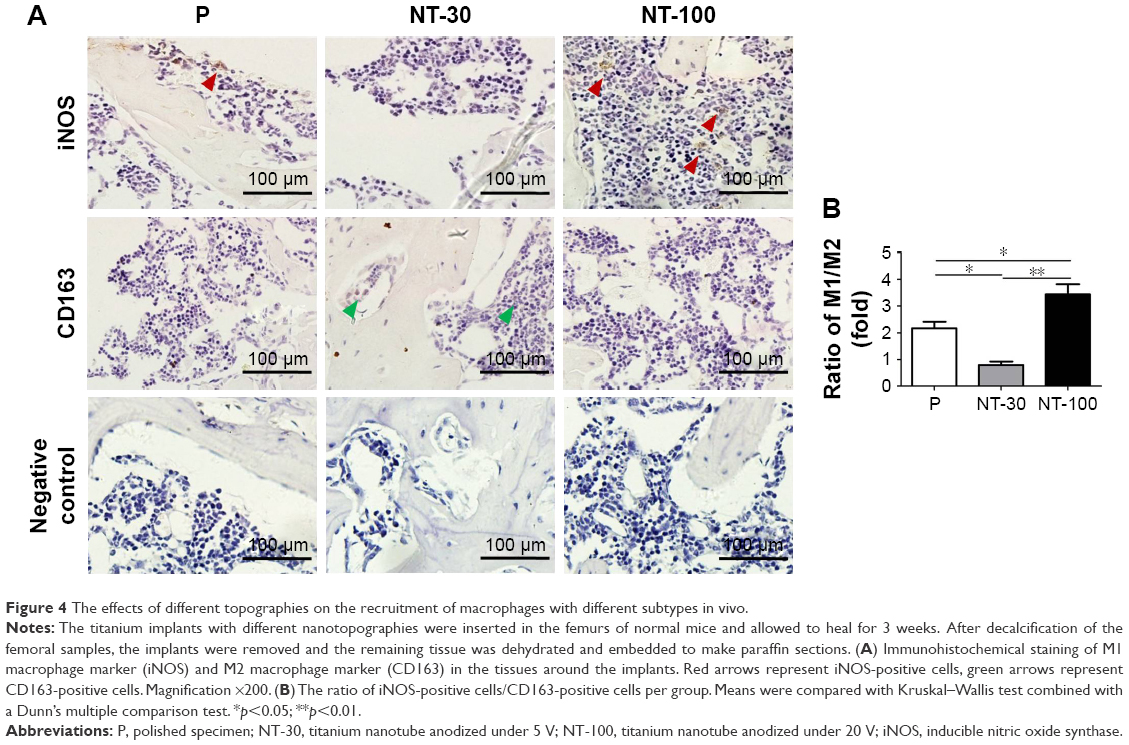 | Figure 4 The effects of different topographies on the recruitment of macrophages with different subtypes in vivo. |
The effects of topography on macrophage polarization in vitro
The induction effects of Ti topography on mice macrophage polarization were detected (Figure 5). Firstly, gene expressions of M1 macrophage markers (iNOS and IL-6) and M2 macrophage markers (Arg-1 and IL-10) were detected. A higher expression level of iNOS and IL-6 was found in NT-100 while a higher expression level of Arg-1 and IL-10 was found in NT-30 (Figure 5A).
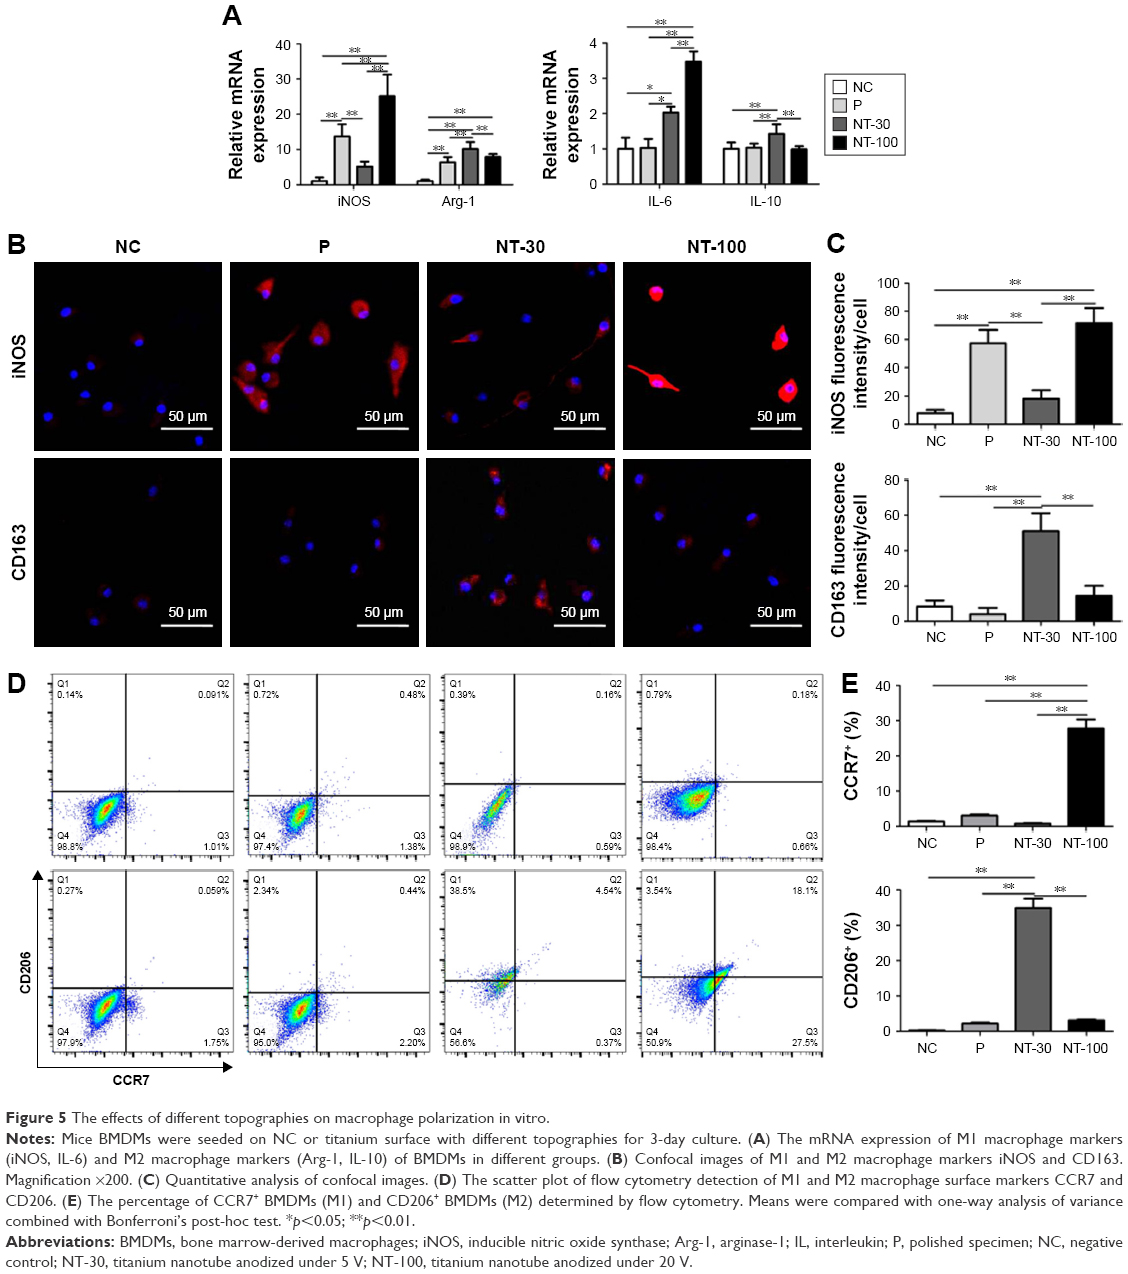 | Figure 5 The effects of different topographies on macrophage polarization in vitro. |
Additionally, BMDMs were stained with iNOS (M1) and CD206 (M2) through cytoimmunofluorescence. As shown in the results, the expression of iNOS in different groups showed the following trend: NT-100≥P>NT-30≥NC. However, the expression of CD206 in different groups showed the reverse trend: NT-30>NT-100≥P≥NC (Figure 5B–C).
Moreover, the immunomodulatory effects of topography were further confirmed by the scatter plot of flow cytometry detection of CCR7 (M1) and CD206 (M2), the surface markers of M1/M2 macrophages. Results showed that many more cells in NT-100 preferred to exhibit the M1 phenotype, while cells seeded on the NT-30 surface were dominated by M2 macrophages. Similarly to NC, cells in P were more likely to exhibit the M0 phenotype and not be activated (Figure 5D–E).
The effects of topography on cytokine secretion by macrophages
The analysis of protein array revealed the expression levels of inflammation-related cytokines in different groups at 3 days and 7 days (Figure 6). The expression of pro-inflammatory cytokines such as IFN-γ and IL-1β was similar between NT-30 and NT-100 at 3 days. However, at 3 days, cells of NT-100 manifested a significantly higher expression of IL-12p70, while cells of NT-30 were found to express a significantly higher level of TNF-α (Figure 6A). By contrast, at 7 days, compared with that of 3 days, the secretion level of pro-inflammatory cytokines was partly decreased in each group. But the expression of IFN-γ in NT-100 and P was more increased than that of NT-30. In addition, IL-1β and TNF-α manifested a much higher expression level in P, while the expression level of IL-1β and TNF-α in NT-100 was almost as low as that in NT-30. However, the expression of IL-12p70 in NT-30 was significantly higher than that of other groups at 7 days (Figure 6B).
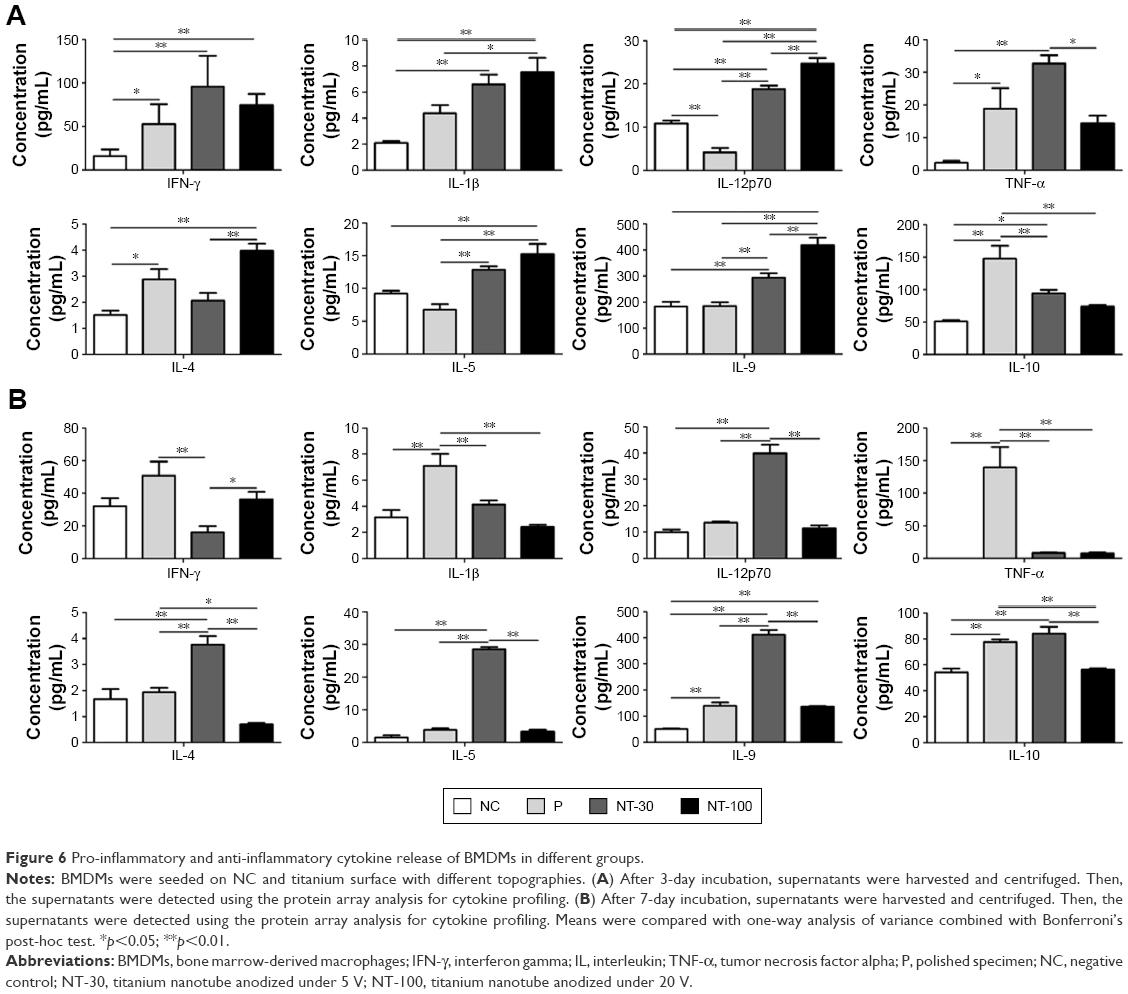 | Figure 6 Pro-inflammatory and anti-inflammatory cytokine release of BMDMs in different groups. |
Besides pro-inflammatory cytokines, the secretion level of anti-inflammatory cytokines varied in a time-dependent manner as well. At 3 days, cells of NT-100 showed a higher expression level of IL-4 and IL-9, while the expression of IL-10 in P was significantly higher than that of other groups (Figure 6A). In addition, at 7 days, the expression levels of IL-4, IL-5 and IL-9 were all significantly increased in NT-30; however, the expression level of IL-10 in P was significantly decreased and its expression level in other groups almost remained the same level compared with that of 3 days. Nonetheless, the secretion level of IL-10 in NT-30 was higher than that of NT-100 (Figure 6B).
The influence of topography-mediated immunomodulatory effects on the osteogenic differentiation of BMSCs
Based on the modulatory effects of topography on macrophage polarization, indirect co-culture of BMDMs and BMSCs was performed (Figure 7). Interestingly, by supplementing the culture of BMSCs with the corresponding MCM which was obtained from the culture of BMDMs on Ti surface with different topographies, significantly higher expression of osteogenesis-related gene expression and ALP activity were found in NT-30 (Figure 7A–B). However, the ALP activity of NC and P was basically unchanged. The ECM mineralization analysis of BMSCs at 3 weeks with the corresponding MCM was in agreement with RT-qPCR analysis and ALP data (Figure 7C).
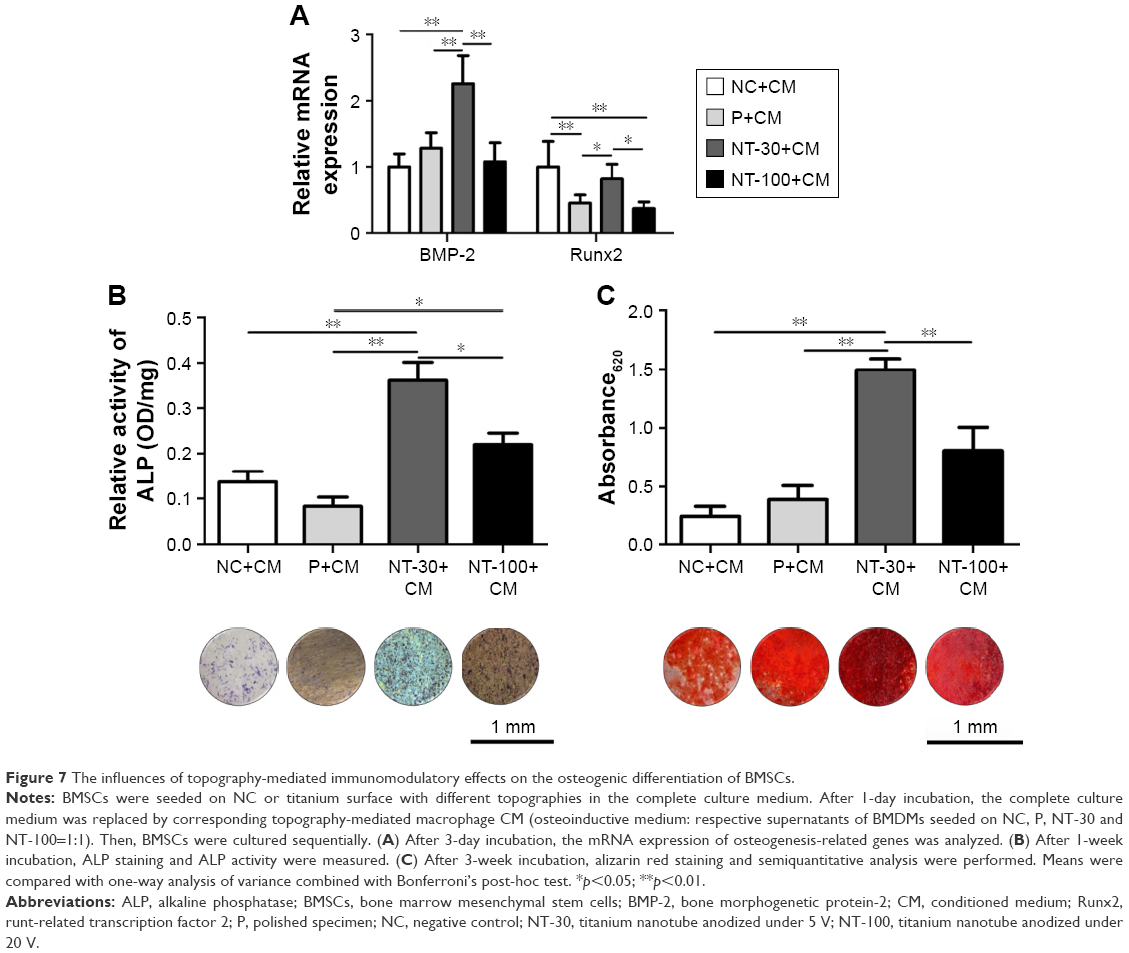 | Figure 7 The influences of topography-mediated immunomodulatory effects on the osteogenic differentiation of BMSCs. |
The effects of M1 polarization blocking on nanotopography-mediated osseointegration
Compared with WT mice, the KO mice developed significantly better osseointegration (Figure 8). From the results of micro-CT, much denser and thicker trabecula could be found around the implant in KO mice (Figure 8A) and the new bone formation ratio in KO mice was much higher than that of WT mice as well (Figure 8B). Moreover, enhanced push-in resistance was significantly inhibited in KO mice (Figure 8C).
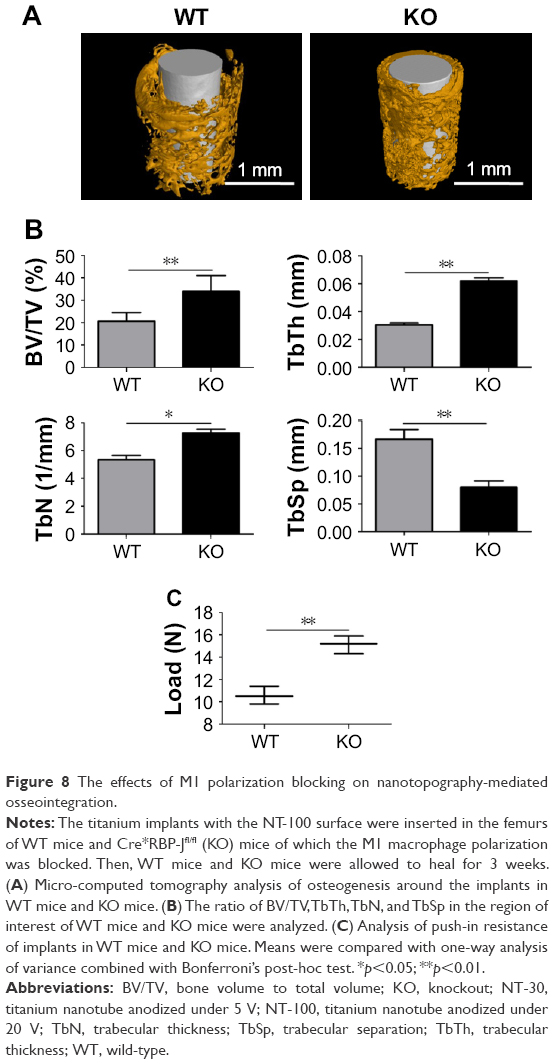 | Figure 8 The effects of M1 polarization blocking on nanotopography-mediated osseointegration. |
Discussion
Studies about the excellent ability to induce osteogenesis of bone implantation biomaterials in vitro are not unusual.26,29 However, increasing reports indicate that the appropriate immuno-microenvironment is essential for acquiring adequate osseointegration in vivo.30,31 This study aimed to evaluate the effects of nanotopography on the immuno-microenvironment (macrophage polarization) around implants in vivo and to explore the influences of different macrophage phenotypes resulting from the regulation of nanotopography on the osteogenic differentiation of BMSCs and osteogenesis finally.
Firstly, the induction of nanotopography to osteogenic differentiation of BMSCs was determined. The expression of BMP-2, which was demonstrated to stimulate the proliferation, migration, and osteogenic differentiation of MSCs in vitro and to correlate with osseointegration in the effects of TiO2 NTs on bone formation in vivo,32,33 in BMSCs of NT-100 was significantly higher than that of other groups, while Runx2 expression was significantly enhanced in NT-100 compared with NT-30, given that Runx2 is required for the differentiation of mesenchymal stem cells along the osteoblast lineage.34 In addition, the ALP analysis and ECM detection also supported the better osteoinductive ability of the nanotopography of NT-100, which was consistent with our previous studies.22–26
After that, it is essential to evaluate the osseointegration of Ti implants with different topographies in vivo. Through inserting the implants with different topographies into the femurs of mice and the consequent histological analysis and mechanical detection, the osteogenesis was NT-30>NT-100>P, which is partly different from our in vitro results and the studies in vitro performed by Zhao et al26 and Shi et al.29 The differences between in vitro and in vivo in our studies might even be related to the osteogenic environment influenced by the topography of Ti implants. Macrophages play quite vital roles in the prognosis of implantation, as the macrophage phenotype contributes to the alteration of the osteogenic environment,35 and have significant effects on the wound healing and the biological performances of biomaterials.18–20 Thus, whether macrophage behaviors are defined by different topographies of implants was evaluated. Previous studies have claimed that the surface nanotopography can reduce the infiltration of macrophages and attenuate the inflammatory process.36,37 In another study conducted by our group, it was also found that the infiltration of macrophages and other inflammatory cells induced by the nanotopography group was significantly less than that of the smooth group (data not shown), which might be related to the better bone formation finally achieved by the NT group. However, the changes in the polarization and secretion functions of the infiltrated macrophages also play a crucial role in the final bone formation.38 The wound and implant sites naturally contain a combination of stimuli that favor both M1 and M2 macrophage polarization at different stages of healing,17,39 thus, from results of IHC staining, both iNOS-positive cells and CD163-positive cells could be found around the implants. However, the ratio of M1/M2 macrophages in NT-30 was the lowest, suggesting fewer M1 macrophages infiltrating in NT-30 and fewer M2 macrophages infiltrating in P and NT-100. Compared with P and NT-100, the nanotopography of NT-30 is prone to induce more macrophages to the M2 phenotype, which may be beneficial to wound healing and osseointegration around the implants.30,40,41 From the above results, we might suspect that the difference of macrophage polarization states in the microenvironment was responsible for different osseointegration of Ti implants in vivo. However, whether the osseointegration differences and macrophage polarization states cooperate requires further evidence.
For a better understanding of the immunomodulatory effects of Ti topographies, the effects of topography on BMDM polarization were studied further. We found that different topography of Ti could lead to different expression levels of macrophage M1/M2 associated markers in genes. A higher expression level of iNOS and IL-6 was found in NT-100 while a higher expression level of Arg-1 and IL-10 was found in NT-30, suggesting the preference of macrophages in NT-100 to the M1 phenotype and the preference of macrophages in NT-30 to the M2 phenotype.21 Additionally, the morphological changes of BMDMs on the Ti surface with different topographies were found (data not shown). The round shape with shorter pseudopodium in NT-30 and the stretched shape in NT-100 were consistent with previous studies that a round shape is more related to M2 predominant, while a stretched shape is more related to M1 predominant.42–44 Cytoimmunofluorescence results showed that macrophages in NT-30 were prone to the M2 phenotype while cells in P and NT-100 were prone to the M1 phenotype. It was notable that the fluorescence intensity of CD163, a function-associated surface marker of M2 macrophages, is weaker than that of iNOS in general, suggesting that the intrinsic immune response elicited by topography is weaker than that influenced by chemical stimuli at the implantation site. From the results of flow cytometry, the distinct different polarization states between NT-30 and NT-100 were confirmed further. However, mice BMDMs in P were considered as almost unactivated. The slightly different results about the P topography in cytoimmunofluorescence and flow cytometry might be related to the different detection methods. However, one thing for certain is that the topography of P might not induce the M2 states of macrophages.
The main characteristics of polarized macrophages were the changed cytokine profiling. The analysis of the protein array revealed the expression levels of inflammation-related cytokines in different groups at 3 days and 7 days. Among them, the expression levels of IFN-γ, IL-1β and TNF-α in P were significantly higher, and the higher expression of IFN-γ in NT-100 at 7 days were considered to induce an imbalance between bone formation and bone resorption by enhancing osteoclast activity.45,46 IL-4 and IL-10 were well-known anti-inflammatory cytokines and were considered to be associated with the polarization of M2 macrophages and wound healing.31,47 IL-5 and IL-9 were recognized to be Th2-associated cytokines and involved in inflammation regulation.48,49 It was worth noting that the expression of IL-4 in NT-30 is lower than that of P and NT-100 at 3 days. In another study conducted by our group, we found that there were more mast cell infiltrations around the P and NT-100 groups within 3 days after implantation (data not shown). Given that the mast cells were associated with IL-4 secretion,50 we speculated that the higher expression of IL-4 in P and NT-100 might be related to the activated mast cells around implants at 3 days. However, as time progressed, the level of IL-4 secretion in the NT-30 group increased gradually, whereas that in the NT-100 group decreased gradually, which may be closely related to the change in the polarization state of macrophages. Interestingly, the expression of IL-12p70, which was considered to be related to M1 macrophage,51 was significantly increased in NT-30 at 7 days. Reports have stated that moderate proinflammatory M1 macrophages could inhibit RANKL-induced osteoclastogenesis,52 and the bone formation process is a dynamic balance between osteogenesis and osteoclastogenesis.59 Therefore the moderate polarization of M1 macrophages may be involved in the regulation of bone formation at the site of implantation. It should be noted that VEGF, a pro-healing growth factor,53 always remained at a high level in the NT-30 group (data not shown), indicating better healing and tissue reconstruction. Collectively, the expression level of inflammation-related cytokines uncovered that the polarization of macrophages is dynamic, balanced, and not absolute as a function of time and a highly complex microenvironment.14–16 Therefore, the macrophage phenotype is more likely to be considered as a spectrum between the M1 and M2 extreme, where any given cell may express certain components of multiple M1 or M2 phenotypes.31 Ultimately, based on the results in our studies, although the cytokine profiling is diverse, the preference of NT-30 for inducing more macrophages to the M2 phenotype compared with P and NT-100 is certain as time extends.
Following the confirmation of the immunomodulatory effects of topographies, the influences of topography-mediated macrophage polarization on the osteogenic differentiation of BMSCs requires exploring. By coculturing BMDMs and BMSCs, we found that the osteogenic differentiation of BMSCs on the NT-100 surface became nonideal and, by contrast, the osteogenic differentiation of BMSCs on the NT-30 surface became much better, implying that the cytokine profiling of BMDMs in NT-30 was beneficial for BMSC osteogenic differentiation while the cytokine profiling of BMDMs in NT-100 might impede nanotopography-induced osteogenic differentiation of BMSCs. Taken together, this confirms that the immunomodulatory effects of biomaterials are crucial to determine the in vivo outcomes.54,55
According to aforementioned findings, we might draw a conclusion that the osteogenic differentiation of BMSCs on different topographies was closely related to the status of surrounding macrophages. Specifically, the NT-30 surface was prone to induce M2 polarization of macrophages, which could contribute to the anti-inflammatory and pro-healing microenvironment, whereas the NT-100 surface was prone to induce M1 polarization of macrophages which could lead to the pro-inflammatory and poor-healing microenvironment. It is known that the M2 polarization of macrophages is beneficial for wound healing, tissue remodeling, or osteogenesis, the M1 macrophages indicate consistent inflammatory reactions.30,40,41 Consequently, although the osteogenic differentiation capacity of BMSCs on the NT-30 surface was weaker than that on the NT-100 surface, it was reversed once the topography-mediated MCM was applied. In that case, the RBP-J conditional gene knockout mice in which the classically activated macrophage was partly restrained56 were used to explore the effects of polarization changes of macrophages on osseointegration induced by NT-100. IFN-γ, M1 macrophage was also activated in response to microbial product-mediated activation of Toll-like receptors (TLRs).57 RBP-J, the major nuclear transducer of Notch signaling, augmented TLR4-induced expression of key mediators of classically activated M1 macrophages.56 Thus, RBP-J was involved in TLR-induced inflammatory macrophage polarization. From the results, we found that the RBP-J knockout mice manifested better osteogenesis and osteointegration. By extension, the part blockage of M1 polarization of macrophages would be beneficial to alleviate the inflammatory response at implantation sites. As expected, reducing M1 polarization of macrophages in mice could promote osteogenesis around Ti implants greatly.
Given the close relationship between the bone system and the immune system, it is not difficult to imagine that activated macrophages around the implants can secrete osteogenesis-related cytokines. An appropriate immune-inflammatory response can produce some cytokines that are conducive to osteogenesis, while an inappropriate immune response can cause chronic inflammatory responses and even fibrous encapsulation of implants.58 In our study, the macrophage phenotype exists along a continuum between the M1 and M2 extremes and the phenotype can switch in response to environmental cues. Excessive polarization in the M1 direction leads to prolonged inflammation, while excessive polarization in the M2 direction leads to fibrosis. The macrophage polarization induced by Ti surface morphology is not absolute either, and it is dynamic but it will dominate with a certain polarization direction. In our 3-week in vivo study, we did not find that NT-30 topography induces excessive fibrosis around the implant since the topography of NT-30 could induce M2 macrophage polarization predominantly. However, it is unclear whether the prognosis is good when the implants with NT-30 topography are applied to large animals and even humans. Therefore, in the future, we will focus on how to control the phenotypic changes of macrophages more precisely in terms of space and time through the surface modification of Ti materials, so as to obtain a more favorable microenvironment for osteogenesis.
Conclusion
In summary, modifying the surface nanotopography of Ti implants endowed them with osteoimmunomodulatory properties through regulating macrophage polarization (Figure 9). Specifically, TiO2 NTs with diameters of 80–100 nm were more likely to induce macrophages to the M1 phenotype, while TiO2 NTs with smaller diameters of 30 nm were prone to induce macrophages to the M2 phenotype. By shifting the macrophage phenotype, the changed surface markers, cytokine profiling, and even osteogenic environment could alter the osteogenic differentiation of BMSCs and osteogenesis finally. Therefore, the specific nanotopography-mediated macrophage polarization plays a crucial role in determining the implant osseointegration in vivo. In essence, comprehensive consideration of the surface characteristics of biomaterials and their immunomodulatory properties would be greatly helpful for the development of bone implants.
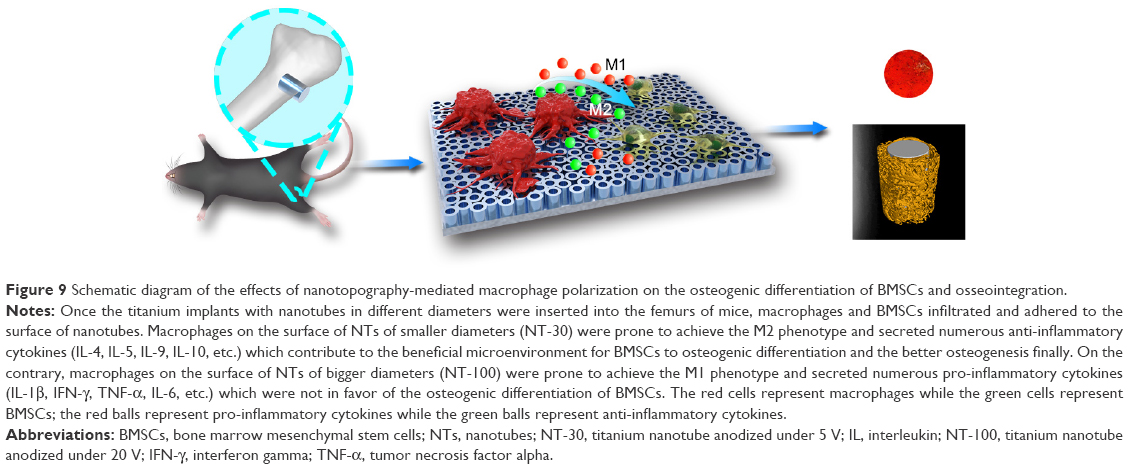 | Figure 9 Schematic diagram of the effects of nanotopography-mediated macrophage polarization on the osteogenic differentiation of BMSCs and osseointegration. |
Acknowledgments
We appreciate technical support from Dr Tao Zhou in Xi’an Jiaotong University for micro-CT scanning and analysis. We also appreciate technical support from Professor Hua Han and Hongyan Qin of the Department of Cell Biology and Medical Genetics at The Fourth Military Medical University for the bestowal of Cre*RBP-Jfl/fl mice. The study is supported by the National Natural Science Foundation of China (Nos. 81530051, 81771069, 31670966 and 81571531). We acknowledge Professors Yumei Zhang, Qintao Wang and Lihua Chen who provided theoretical guidance, technical support and critical financial support for the successful completion of this study and made great contributions to the paper. In particular, Professor Lihua Chen has provided much guidance and support from the immunology perspective.
Disclosure
The authors report no conflicts of interest in this work.
References
Dalby MJ, Gadegaard N, Tare R, et al. The control of human mesenchymal cell differentiation using nanoscale symmetry and disorder. Nat Mater. 2007;6:997–1003. | ||
Shibata Y, Tanimoto Y, Maruyama N, Nagakura M. A review of improved fixation methods for dental implants. Part II: biomechanical integrity at bone–implant interface. J Prosthodont Res. 2015;59:84–95. | ||
Longo G, Loannidu CA, Scotto d’Abusco A, et al. Improving osteoblast response in vitro by a nanostructured thin film with titanium carbide and titanium oxides clustered around graphitic carbon. PLoS One. 2016;11:e0152566. | ||
Wei C, Liu Z, Jiang F, Zeng B, Huang M, Yu D. Cellular behaviours of bone marrow-derived mesenchymal stem cells towards pristine graphene oxide nanosheets. Cell Prolif. 2017;50(5). | ||
Petecchia L, Usai C, Vassalli M, Gavazzo P. Biophysical characterization of nanostructured TiO2 as a good substrate for hBM-MSC adhesion, growth and differentiation. Exp Cell Res. 2017;358:111–119. | ||
Li Y, Dai X, Bai Y, et al. Electroactive BaTiO3 nanoparticle-functionalized fibrous scaffolds enhance osteogenic differentiation of mesenchymal stem cells. Int J Nanomedicine. 2017;12:4007–4018. | ||
Rajyalakshmi A, Ercan B, Balasubramanian K, Webster TJ. Reduced adhesion of macrophages on anodized titanium with select nanotube surface features. Int J Nanomedicine. 2011;6:1765–1771. | ||
Sun SJ, Yu WQ, Zhang YL, Jiang XQ, Zhang FQ. Effects of TiO2 nanotube layers on RAW 264.7 macrophage behavior and bone morphogenetic protein-2 expression. Cell Prolif. 2013;46:685–694. | ||
Milleret V, Tugulu S, Schlottig F, Hall H. Alkali treatment of microrough titanium surfaces affects macrophage/monocyte adhesion, platelet activation and architecture of blood clot formation. Eur Cell Mater. 2011;21:430–444. | ||
Hotchkiss KM, Reddy GB, Hyzy SL, Schwartz Z, Boyan BD, Olivares-Navarrete R. Titanium surface characteristics, including topography and wettability, alter macrophage activation. Acta Biomater. 2016;31:425–434. | ||
Garg K, Pullen NA, Oskeritzian CA, Ryan JJ, Bowlin GL. Macrophage functional polarization (M1/M2) in response to varying fiber and pore dimensions of electrospun scaffolds. Biomaterials. 2013;34:4439–4451. | ||
Spiller KL, Anfang RR, Spiller KJ, et al. The role of macrophage phenotype in vascularization of tissue engineering scaffolds. Biomaterials. 2014;35:4477–4488. | ||
Taraballi F, Corradetti B, Minardi S, et al. Biomimetic collagenous scaffold to tune inflammation by targeting macrophages. J Tissue Eng. 2016;7:2041731415624667. | ||
Franz S, Rammelt S, Scharnwebe D, Simon JC. Immune responses to implants – a review of the implications for the design of immunomodulatory biomaterials. Biomaterials. 2011;32:6692–6709. | ||
Chen Z, Mao X, Tan L, et al. Osteoimmunomodulatory properties of magnesium scaffolds coated with β-tricalcium phosphate. Biomaterials. 2014;35:8553–8565. | ||
Sridharan R, Cameron AR, Kelly DJ, Kearney CJ, O’Brien FJ. Biomaterial based modulation of macrophage polarization: a review and suggested design principles. Materials Today. 2015;18:313–325. | ||
Novak ML, Koh TJ. Macrophage phenotypes during tissue repair. J Leukoc Biol. 2013;93:875–881. | ||
Kang H, Kim S, Wong DSH, et al. Remote manipulation of ligand nano-oscillations regulates adhesion and polarization of macrophages in vivo. Nano Lett. 2017;17:6415–6427. | ||
Li B, Hu Y, Zhao Y, et al. Curcumin attenuates titanium particle-induced inflammation by regulating macrophage polarization in vitro and in vivo. Front Immunol. 2017;8:55. | ||
Ariganello MB, Simionescu DT, Labow RS, Lee JM. Macrophage differentiation and polarization on a decellularized pericardial biomaterial. Biomaterials. 2011;32:439–449. | ||
Martinez FO, Helming L, Gordon S. Alternative activation of macrophages: an immunologic functional perspective. Annu Rev Immunol. 2009;27:451–483. | ||
Liu Q, Wang W, Zhang L, et al. Involvement of N-cadherin/β-catenin interaction in the micro/nanotopography induced indirect mechanotransduction. Biomaterials. 2014;35:6206–6218. | ||
Wang W, Liu Q, Zhang Y, Zhao L. Involvement of ILK/ERK1/2 and ILK/p38 pathways in mediating the enhanced osteoblast differentiation by micro/nanotopography. Acta Biomater. 2014;10:3705–3715. | ||
Wang W, Zhao L, Ma Q, Wang Q, Chu PK, Zhang Y. The role of the Wnt/β-catenin pathway in the effect of implant topography on MG63 differentiation. Biomaterials. 2012;33:7993–8002. | ||
Wang W, Zhao L, Wu K, et al. The role of integrin-linked kinase/β-catenin pathway in the enhanced MG63 differentiation by micro/nano-textured topography. Biomaterials. 2013;34:631–640. | ||
Zhao L, Liu L, Wu Z, Zhang Y, Cuh PK. Effects of micropitted/nanotubular titania topographies on bone mesenchymal stem cell osteogenic differentiation. Biomaterials. 2012;33:2629–2641. | ||
Ma Q, Zhao L, Liu R, et al. Improved implant osseointegration of a nanostructured titanium surface via mediation of macrophage polarization. Biomaterials. 2014;35:9853–9867. | ||
Pajarinen J, Tamaki Y, Antonios JK, et al. Modulation of mouse macrophage polarization in vitro using IL-4 delivery by osmotic pumps. J Biomed Mater Res A. 2015;103:1339–1345. | ||
Shi M, Song W, Han T, et al. Role of the unfolded protein response in topography-induced osteogenic differentiation in rat bone marrow mesenchymal stem cells. Acta Biomater. 2017;54:175–185. | ||
Loi F, Córdova LA, Zhang R, et al. The effects of immunomodulation by macrophage subsets on osteogenesis in vitro. Stem Cell Res Ther. 2016;7:15. | ||
Brown BN, Badylak SF. Expanded applications, shifting paradigms and an improved understanding of host–biomaterial interactions. Acta Biomater. 2013;9:4948–4955. | ||
Moore NM, Lin NJ, Gallant ND, Becker ML. Synergistic enhancement of human bone marrow stromal cell proliferation and osteogenic differentiation on BMP-2-derived and RGD peptide concentration gradients. Acta Biomater. 2011;7:2091–2100. | ||
von Wilmowsky C, Bauer S, Roedl S, Neukam FW, Schmuki P, Schlegel KA. The diameter of anodic TiO2 nanotubes affects bone formation and correlates with the bone morphogenetic protein-2 expression in vivo. Clin Oral Implants Res. 2012;23:359–366. | ||
Li X, Cui Q, Kao C, Wang GJ, Balian GL. Lovastatin inhibits adipogenic and stimulates osteogenic differentiation by suppressing PPARgamma2 and increasing Cbfa1/Runx2 expression in bone marrow mesenchymal cell cultures. Bone. 2003;33:652–659. | ||
Anderson JA, McNally AK. Biocompatibility of implants: lymphocyte/macrophage interactions. Semin Immunopathol. 2011;33:221–233. | ||
Karazisis D, Ballo AM, Petronis S, et al. The role of well-defined nanotopography of titanium implants on osseointegration: cellular and molecular events in vivo. Int J Nanomedicine. 2016;11:1367–1382. | ||
Karazisis D, Petronis S, Agheli H, et al. The influence of controlled surface nanotopography on the early biological events of osseointegration. Acta Biomater. 2017;53:559–571. | ||
Omar OM, Granéli C, Ekström K, et al. The stimulation of an osteogenic response by classical monocyte activation. Biomaterials. 2011;32:8190–8204. | ||
Wynn TA, Vannella KM. Macrophages in tissue repair, regeneration, and fibrosis. Immunity. 2016;44:450–462. | ||
Hao S, Meng J, Zhang Y, et al. Macrophage phenotypic mechanomodulation of enhancing bone regeneration by superparamagnetic scaffold upon magnetization. Biomaterials. 2017;140:16–25. | ||
Gordon S. Alternative activation of macrophages. Nat Rev Immunol. 2003;3:23–25. | ||
McWhorter FY, Wang T, Nguyen P, Chung T, Liu WF. Modulation of macrophage phenotype by cell shape. Proc Natl Acad Sci U S A. 2013;110:17253–17258. | ||
Bartneck M, Schulte VA, Paul NE, Diez M, Lensen MC, Zwadlo-Klarwasser G. Induction of specific macrophage subtypes by defined micro-patterned structures. Acta Biomater. 2010;6:3864–3872. | ||
Gautam PK, Kumar S, Deepak P, Acharya A. Morphological effects of autologous hsp70 on peritoneal macrophages in a murine T cell lymphoma. Tumour Biol. 2013;34:3407–3415. | ||
Horowitz SM, Doty SB, Lane JM, Burstein AH. Studies of the mechanism by which the mechanical failure of polymethylmethacrylate leads to bone resorption. J Bone Joint Surg Am. 1993;75:802–813. | ||
Schwarz EM, Lu AP, Goater JJ, et al. Tumor necrosis factor-alpha/nuclear transcription factor-kappa B signaling in periprosthetic osteolysis. J Orthop Res. 2000;18:472–480. | ||
Stein M, Keshav S, Harris N, Gordon S. Interleukin 4 potently enhances murine macrophage mannose receptor activity: a marker of alternative immunologic macrophage activation. J Exp Med. 1992;176:287–292. | ||
Wang T, Feldman AL, Wada DA, et al. GATA-3 expression identifies a high-risk subset of PTCL, NOS with distinct molecular and clinical features. Blood. 2014;123:3007–3015. | ||
Malik S, Sadhu S, Elesela S, et al. Transcription factor Foxo1 is essential for IL-9 induction in T helper cells. Nat Commun. 2017;8:815. | ||
McLeod JJ, Baker B, Ryan JJ. Mast cell production and response to IL-4 and IL-13. Cytokine. 2015;75:57–61. | ||
Fu A, Wang Y, Wu Y, et al. Echinacea purpurea extract polarizes M1 macrophages in murine bone marrow-derived macrophages through the activation of JNK. J Cell Biochem. 2017;118:2664–2671. | ||
Yamaguchi T, Movila A, Kataoka W, et al. Proinflammatory M1 macrophages inhibit RANKL-induced osteoclastogenesis. Infect Immun. 2016;84:2802–2812. | ||
Pongkitwitoon S, Weinheimer-Haus EM, Koh TJ, Judex S. Low-intensity vibrations accelerate proliferation and alter macrophage phenotype in vitro. J Biomech. 2016;49:793–796. | ||
Liu Y, Wang L, Kikuiri T, et al. Mesenchymal stem cell-based tissue regeneration is governed by recipient T lymphocytes via IFN-γ and TNF-α. Nat Med. 2011;17:1594–1601. | ||
Al-Nawas B, Kämmerer PW, Morbach T, Ophoven F, Wagner W. Retrospective clinical evaluation of an internal tube-in-tube dental implant after 4 years, with special emphasis on peri-implant bone resorption. Int J Oral Maxillofac Implants. 2011;26:1309–1316. | ||
Xu H, Zhu J, Smith S, et al. Notch-RBP-J signaling regulates the transcription factor IRF8 to promote inflammatory macrophage polarization. Nat Immunol. 2012;13:642–650. | ||
Mosser DM, Edwards JP. Exploring the full spectrum of macrophage activation. Nat Rev Immunol. 2008;8:958–969. | ||
Chen Z, Yuen J, Crawford R, Chang J, Wu C, Xiao Y. The effect of osteoimmunomodulation on the osteogenic effects of cobalt incorporated β-tricalcium phosphate. Biomaterials. 2015;61:126–138. | ||
Han Y, You X, Xing W, Zhang Z, Zou W. Paracrine and endocrine actions of bone-the functions of secretory proteins from osteoblasts, osteocytes, and osteoclasts. Bone Res. 2018;6:16. |
 © 2018 The Author(s). This work is published and licensed by Dove Medical Press Limited. The
full terms of this license are available at https://www.dovepress.com/terms
and incorporate the Creative Commons Attribution
- Non Commercial (unported, 3.0) License.
By accessing the work you hereby accept the Terms. Non-commercial uses of the work are permitted
without any further permission from Dove Medical Press Limited, provided the work is properly
attributed. For permission for commercial use of this work, please see paragraphs 4.2 and 5 of our Terms.
© 2018 The Author(s). This work is published and licensed by Dove Medical Press Limited. The
full terms of this license are available at https://www.dovepress.com/terms
and incorporate the Creative Commons Attribution
- Non Commercial (unported, 3.0) License.
By accessing the work you hereby accept the Terms. Non-commercial uses of the work are permitted
without any further permission from Dove Medical Press Limited, provided the work is properly
attributed. For permission for commercial use of this work, please see paragraphs 4.2 and 5 of our Terms.