Back to Journals » International Journal of Nanomedicine » Volume 15
Nanosized Cubosomal Thermogelling Dispersion Loaded with Saquinavir Mesylate to Improve Its Bioavailability: Preparation, Optimization, in vitro and in vivo Evaluation
Authors Hosny KM ![]()
Received 14 May 2020
Accepted for publication 1 July 2020
Published 16 July 2020 Volume 2020:15 Pages 5113—5129
DOI https://doi.org/10.2147/IJN.S261855
Checked for plagiarism Yes
Review by Single anonymous peer review
Peer reviewer comments 2
Editor who approved publication: Dr Thomas Webster
Khaled M Hosny1,2
1Department of Pharmaceutics, Faculty of Pharmacy, King Abdulaziz University, Jeddah, Saudi Arabia; 2Department of Pharmaceutics and Industrial Pharmacy, Faculty of Pharmacy, Beni-Suef University, Beni-Suef, Egypt
Correspondence: Khaled M Hosny
Department of Pharmaceutics, Faculty of Pharmacy, King Abdulaziz University, Jeddah, Saudi Arabia
Tel +966561682377
Email [email protected]
Background: Low bioavailability and poor permeability of the blood–brain barrier are problematic when delivering therapeutic agents and particularly anti–human immunodeficiency virus therapy to the central nervous system. The intranasal route offers an alternative for central nervous system delivery. Cubosomes have been reported as helpful vehicles for intranasal delivery of therapeutics to enable brain targeting.
Objective: In this study, we aimed to develop the intranasal cubosomal thermogelling dispersion of saquinavir mesylate for central nervous system delivery.
Methods: The Box–Behnken design was applied to study the effect of monoolein, Poloxamer 407, and polyvinyl alcohol as independent factors and the particle size, entrapment efficiency, gelation temperature, and stability index as responses. The optimized cubosomes were evaluated using transmission electron microscopy, ex vivo permeation, and in vivo pharmacokinetics.
Results: The optimized formula consisting of monoolein (8.96%), Poloxamer 407 (17.45%), and polyvinyl alcohol (7.5%) was prepared and evaluated. Higher values for the steady-state flux, permeability coefficient, and enhancement factor were observed for the cubosomal thermogelling dispersion of saquinavir during ex vivo permeation in comparison with an aqueous suspension of saquinavir. From the pharmacokinetic profile, the relative bioavailability for the intranasal optimized formula was approximately 12-fold higher when compared with oral aqueous suspension and 2.5-fold greater when compared to the intranasal aqueous suspension of saquinavir.
Conclusion: Overall, the saquinavir-loaded cubosomal thermogelling formulation is promising for central nervous system delivery by intranasal administration.
Keywords: cubosomes, central nervous system, CNS, nose to brain delivery, human immunodeficiency virus, HIV, intranasal, saquinavir, thermogelling
Introduction
Delivering drugs to the central nervous system (CNS) is problematic due to physiological and anatomical barriers. Many promising drug candidates fail to reach therapeutic concentrations in the CNS because of the blood–brain barrier (BBB). Because of the difficulty of delivering adequate drug dosages to the CNS, diseases and disorders of the CNS remain difficult to treat.
Infection of the CNS due to the human immunodeficiency virus (HIV) can lead to various complications including HIV-1–associated neurological disorders.1,2 Thus, CNS delivery of anti-HIV agents is of great importance. The low bioavailability and poor permeability of the BBB are problematic when delivering anti-HIV agents to the CNS but to compound the situation, HIV-infected cells can act as reservoirs in the CNS and can be reactivated later. This can occur even when the plasma concentration of HIV is lowered by the use of antiviral agents.3
The problem of drug dosing in the CNS is often compounded by conventional delivery routes with oral drug administration considered the preferred route for systemic delivery of therapeutics. After oral administration, drugs are delivered to the CNS from the systemic circulation. Unfortunately, in many cases, high doses are required to achieve the required concentration within the CNS which can lead to side effects. To overcome the problem of low CNS bioavailability, both invasive and noninvasive drug delivery systems have been developed and extensively studied. In addition, alternate routes of drug delivery are proposed.4
The intranasal route is one of the alternative options and is considered a noninvasive route with various advantages and an enhanced efficiency. The olfactory epithelium of the CNS provides direct contact with the external environment and so direct nose-to-brain delivery is the hallmark feature of the intranasal route. The possibility of achieving systemic delivery of therapeutic agents by the intranasal route has been reported.5 The route’s advantages extend to enhanced absorption of lipophilic drugs and avoidance of the hepatic first-pass metabolism. Besides these tremendous advantages, the nose-to-brain targeting for the CNS delivery of drugs has dose limitations.6 Thus, the nose-to-brain route is better suited for low-dose drugs.
Intranasally administered drugs can reach the CNS by a neuronal pathway or by the systemic circulation. If a drug reaches the CNS by the systemic circulation, it must still cross the BBB however in the neuronal pathway, drugs reach the CNS via trigeminal neurons.7,8 These features of intranasal route make it useful for the CNS delivery of anti-viral agents.4 Providing enhanced retention of drug at the site of intranasal administration would further enhance their therapeutic efficacy. Thus, mucoadhesive and thermosensitive formulations are considered ideal for administration by the intranasal route.4,9
Saquinavir mesylate (SQ) is an antiviral agent acting by the mechanism of protease inhibition. SQ has low water solubility and shows poor permeation into the brain. In addition, P-glycoprotein–mediated efflux and metabolism in the liver and intestine further contribute to its bioavailability.9–11
Nanomedicine has provided some promising solutions for anti-HIV drug delivery to the CNS.3,4,12 Interestingly, nano-sized colloidal drug carriers such as nanoparticles and nanoemulsions have been reported for intranasal delivery of anti-HIV agents.12–14 These nanostructures are known to enhance solubility and bioavailability of drugs including SQ.15,16 In particular, intranasal delivery of SQ in the form of a nanoemulsion has shown promise for enhanced drug delivery to the CNS.14 Among these nanoparticles, the cubic phase nanoparticle, commonly known as a cubosome, is the most advanced form of the lipoidal carrier. Cubosomes are formed from lipid cubic phases and have gained much attention for drug delivery purposes.17–19 For structure, monoolein and phytantriol are commonly employed as lipids in cubosomes.20 Cubosomes have been reported to enhance the solubility and bioavailability of drugs by various routes of administration including intranasal deliver to target the brain.21 These cubosomes are known to have better stability than liposomes, and owing to their liquid crystalline, membrane architecture possesses a greater ability to envelop and encapsulate hydrophobic chemotherapeutic agents.24 Studies by Chen et al have shown that these delivery systems can be used to deliver multiple drugs with an extremely high encapsulation efficiency and an enhanced apoptotic efficacy was seen against A549 lung cancer cell lines in case of these multi-drug delivery nanosystems.22 These nanosystems have been found to possess suitable characteristics such as bypassing the blood–brain barrier and targeted distribution in preferable areas in the brain. One of the promising examples for this was the targeted delivery of neurotrophin to the central nervous system, as explained by Angelova et al.23
Thus, we hypothesized that administering SQ by the intranasal route would enhance its delivery to the brain. Moreover, presenting the drug in the form of a cubosomal formulation would result in better transnasal permeation. Further, we hypothesized that dispersing the SQ-loaded cubosomes in a thermogelling formulation would facilitate enhanced mucoadhesion, as well as better formulation characteristics for optimum performance. Based on these rationales, the present study aimed to develop and optimize a cubosomal thermogelling dispersion of SQ for better brain delivery.
Materials and Methods
Materials
Saquinavir mesylate (SQ) was obtained as a kind gift from SAJA (Jeddah, Saudi Arabia). Polyvinyl alcohol (PVA) and phosphate buffer pH 7.4 were obtained from Sigma-Aldrich (St. Louis, MO, USA). Monoolein was procured from Avanti Polar Lipids (Alabaster, AL, USA). Poloxamer 407 with an average molar mass of 12,600 Da was obtained from BASF (Ludwigshafen, Germany). Methanol was purchased from Sigma-Aldrich and acetonitrile (high-performance liquid chromatography [HPLC] grade) was procured from Fisher Scientific UK (Loughborough, Leicestershire, United Kingdom).
Experimental Design
A Box–Behnken design (BBD) was used for the 3-factor 17-run BBD with the help of Design Expert® 12.03.0 (Stat-Ease, Inc., Minneapolis, MN, USA) to design the optimal formulation. The studied variables in this work were the monoolein percentage with respect to dispersed materials (Factor A), the Poloxamer 407 percentage with respect to the dispersion media (Factor B), and the PVA percentage with respect to the dispersion media (Factor C). The percentage range for each variable was selected according to previously not mentioned preliminary tests which were performed in order to select the suitable range for each variable which produces a cubosomal dispersion.
The responses were the particle size (Response 1), entrapment efficiency (Response 2), gelation temperature (Response 3), and stability index (Response 4). Each formula contained 5% SQ. The formulation compositions of the 17 runs suggested by the software are listed in Table 1. Among the suggested 17 runs, one of the formulations was replicated several times. The replicate experiments were generated and suggested by the software. And the results of these replicate experiments were analyzed by the software in order to validate the design model.
 |
Table 1 Formulation Runs with Codes and Values for Independent Factors |
Cubosome Preparation
SQ-loaded cubosomal formulations described in the 17 runs in Table 1 were prepared by the top-down method, in which an accurate amount of monoolein was weighed in a glass vial and heated to 45°C until it was free flowing. Ten milliliters of a phosphate buffer at pH 7.4, 500 mg of SQ and a determined amount of Poloxamer 407, according to the design, were added to the vial containing the monoolein. Then, 5% PVA dissolved in 2 mL distilled water at 80°C was added dropwise to the molten mixture and thoroughly mixed at 1500 rpm with a magnetic stirrer. The resulting dispersion was sonicated using the ultrasonic T 25 digital ULTRA-TURRAX®, (IKA-Werke GmbH & Co. KG, Staufen, Germany) at 15,000 rpm for 2 min at 45°C.
Determination of Particle Size of Saquinavir Cubosomes
The particle size of the prepared SQ-loaded cubosomes was evaluated using a Microtrac® zetatrack particle size analyzer (Microtrac, Inc., Montgomeryville, PA, USA) which uses the dynamic light scattering technique to detect the size of the particles. One milliliter of cubosomal dispersion was diluted with 10 mL of distilled water with continuous stirring then 0.25 mL of the dispersion was subjected to particle size determination.
Determination of Saquinavir Entrapment Efficiency (EE)
The encapsulation efficiency of the cubosomes was determined by following a reported method.25–27 A free SQ was removed by dialysis using a dialysis bag membrane with a molecular weight cut off 12,000–14,000 Daltons and pore size: 2.4 nm. The dialysis bag was placed in distilled water for 1 hr at room temperature under stirring. A drug suspension was used as a control to validate the method. The drug concentration was determined by high-performance liquid chromatography (HPLC), in which saquinavir was separated on a Keystone BetaBasic C4 column (250 x 3 mm i.d.) at 40°C with a mobile phase of acetonitrile-50 mmol/L: ammonium formate buffer, pH 4.1 (52:48, by volume) at a flow rate of 0.5 mL/min., and saquinavir was detected at 235 nm. The entrapment efficiency was then calculated using the following Equation (1)
(1)
Determination of Stability Index
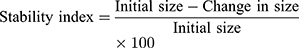
The stability of the cubosomal dispersions was evaluated by three freeze-thaw cycles (heating and cooling cycles). Freezing at −25°C for 12 h was followed by thawing at +25°C for 12 h. The resultant formulations were checked for a change in particle size to ensure the stability of the cubosomes. The stability index was determined from the following Equation (2).
(2)
Determination of Gelation Temperature
The rheological studies of the cubosomal thermogelling formulations were carried out with a Brookfield viscometer (RV model). The viscosity was measured at 15ºC. Then, the temperature of the viscometer was increased gradually and recorded. The point at which the storage modulus exceeds the loss modulus is defined as the gelation point, and the viscosity was measured again at this temperature to ensure the thermogelling behavior of the in situ gel base at this temperature.
Optimized Formulation
The SQ-loaded cubosomal formulation suggested by the optimization step using the software was prepared with the values suggested for monoolein, Poloxamer, and PVA. The optimized formulation was evaluated for particle size, entrapment efficiency, stability index, and gelation temperature as previously described for the 17 formulations.
Morphological Examination
TEM was used to analyze the morphological and structural characteristics of the SQ-loaded cubosomes (TEM H7500, Hitachi, Japan). Samples were processed after 200 fold dilution with double-distilled water. Samples were placed on the electron microscopy copper grids supported by Formvar films and the excess drawn off with filter paper. Samples were stained in 0.5% phosphotungstic acid solution for 30 s and observed after drying. The TEM operated at 80 kV enabling point-to-point resolutions.
Ex vivo Permeation Study
An ex vivo permeation study was performed to determine the cumulative amount permeated, cumulative percentage permeated, steady-state flux, permeability coefficient, diffusion coefficient, and enhancement factor for the optimized 5% SQ-loaded cubosomal thermogelling dispersion with respect to a 5% SQ aqueous suspension.
The experiment was carried out for 6 h at 37°C with a Franz diffusion cell apparatus (MicroettePlus, Hanson Research, Chatsworth, CA, USA). A 1.73-cm2 cell area was loaded with 1 mL of the optimized 5% SQ-loaded cubosomal thermogelling dispersion which contains 50 mg of SQ as a donor phase. The receptor compartment was filled with 7 mL of phosphate buffer pH 7.4 stirred at 400 rpm and maintained at 37±0.5°C. The experiment was performed with the mucosal membrane from the nostrils of sheep. Finally, the SQ concentration of the sample was estimated by HPLC in which saquinavir was separated on a C4 column (250 x 3 mm i.d.) at 40°C with a mobile phase of acetonitrile-50 mmol/L: ammonium formate buffer, pH 4.1 (52:48, by volume) at a flow rate of 0.5 mL/min and detected at 235 nm.
The various permeation parameters were determined according to a reported method.30 The cumulative amount permeated per unit area (Q) was directly determined from the concentration of drug in the receptor compartment of the Franz diffusion cell apparatus. The steady-state flux (Jss) was determined from the slope of the steady-state portion of a plot of Q versus time.
The permeability coefficient was determined from the steady-state flux and initial drug concentration in the delivery system (Co) according to the following Equation (3)
(3)
The diffusion coefficient used the values for thickness of the skin (h) and the lag time (tlag) determined from the plot of Q versus time according to the following Equation (4)
(4)
The enhancement factor was determined by comparing the flux from the optimized formulation to the aqueous suspension31 according to the following Equation (5)
(5)
In vivo Evaluation
The in vivo drug absorption study was approved by the experimental Animal Ethical Committee (AEC), Beni Suef Clinical laboratory Center, Egypt (Ethical Approval no. 3-003-2020). And ensured that the care and use of animals conformed to the guidelines in the Declaration of Helsinki, the Guiding Principle in Care and Use of Animals (DHEW publication NIH 80-23), and the Principles of Laboratory Animal Care (NIH publication #85-23, revised in 1985). Eighteen albino male rabbits were used in the in vivo study. The weight of the selected rabbits was in the range of 2 to 2.5 kg. The rabbits were placed in Groups 1, 2, and 3, with six rabbits in each group. Group 1 ingested the SQ aqueous suspension (15 mg/kg) orally. Group 2 was given the SQ aqueous suspension (15 mg/kg) intranasal, and Group 3 was given the optimized SQ-cubosomal thermogelling formula 15 mg/km intranasally. Blood collection was performed as per the protocol, and serum SQ concentrations were used to calculate the pharmacokinetic parameters. An earlier reported HPLC method was used to determine the plasma SQR concentrations. Specifically, saquinavir was extracted from plasma (250 microL) with methyl-t-butyl ether at basic pH and separated on a Keystone BetaBasic C4 column (250 x 3 mm i.d.) at 40°C with a mobile phase of acetonitrile-50 mmol/L: ammonium formate buffer, pH 4.1 (52:48, by volume) at a flow rate of 0.5 mL/min., and saquinavir was detected at 235 nm. Pharmacokinetic analysis was carried out, and various parameters (Tmax, Cmax, AUC0-1, t1/2, t1/2, and relative bioavailability) were calculated.
Results and Discussion
Experimental Design
Box–Behnken Experimental Design Statistical Analysis
The data obtained for the particle size, enhanced efficiency, stability index, and gelation temperature for the chosen 17 formulations are given in Table 2.
 |
Table 2 The Responses Obtained for Various Formulation Trials |
The statistical parameters obtained for various responses are listed in Table 3. The responses recorded are for the quadratic model. Using the Model F values, the quadratic models suggested for all of the four responses are significant. The observed F values indicated significantly reduced chance that an F-value this large could occur due to noise. The F value can be used to determine whether the test is statistically significant. Lack of fit value explains the inability of the data to fit in the selected model. Thus, a significant lack of fit implies that the model is not suitable or appropriate for the data. In other words, we can consider a model significant only if the lack of fit is not significant. Except for the particle size, the lack of fit for the F-values was not significant, this indicates the validity of the model. In the case of the particle size, the lack of fit was significant, and this was not desirable. A rule of thumb for a model to have good acceptance is that the predicted and adjusted R2 values should be nearly the same and more precisely, within 0.2 of each other. For all of the responses, the predicted and adjusted R2 values were found to be in good agreement with each other. Adequate precision is a measure of the signal-to-noise ratio, with a value above 4 being desirable. For all of the responses, the value for adequate precision was higher than 4.
 |
Table 3 Statistical Parameters Obtained for Various Responses for the Quadratic Model |
In the case of polymeric nanoparticles, methods like solvent evaporation and solvent diffusion are quite impressive.31 Unfortunately, these could not be readily extended and applied in the preparation of cubosomes. Unlike polymeric nanoparticles, cubosomes are prepared by several functional and structural components and thus a standard preparation method would not be appropriate for their production. The components for cubosomes are different in their nature. Nevertheless, cubosomes could be prepared by methods similar to the preparation of conventional nanoparticles. Sonication is one of the two most common methods for the preparation of cubosomes. Homogenization is another alternative method although prolonged homogenization could lead to the destruction of cubosomes.32 Meanwhile, sonication method in the preparation of cubosomes has the major specific advantages of reproducibility of the preparation method and high stability (zeta potential about −38 mV) of the formed cubosomes without the use of additional solvents.33
The quadratic model resulted in the following polynomial equation for particle size in terms of coded factors.

where Response 1 is the particle size, A is the concentration of monoolein used, B is the concentration of Poloxamer 407 used, and C is the concentration of PVA used. From the equation for particle size, the concentration of monoolein is seen to have the highest influence on particle size. It had a positive effect on the particle size, which means that a higher level of monoolein increases the particle size. Poloxamer 407 and PVA had negative effects and, thus, reduce the particle size at their higher concentrations. The magnitude determines the extent of the effect and, thus, Poloxamer 407 had a more intense effect on the particle size than PVA.
A plot of the predicted and actual values for particle size is shown in Figure 1A. The figure shows a good correlation between the predicted and actual results. This is a recognition of the validity of the design model. Most of the points lie on the line itself, which indicates a good correlation between the actual and predicted values.
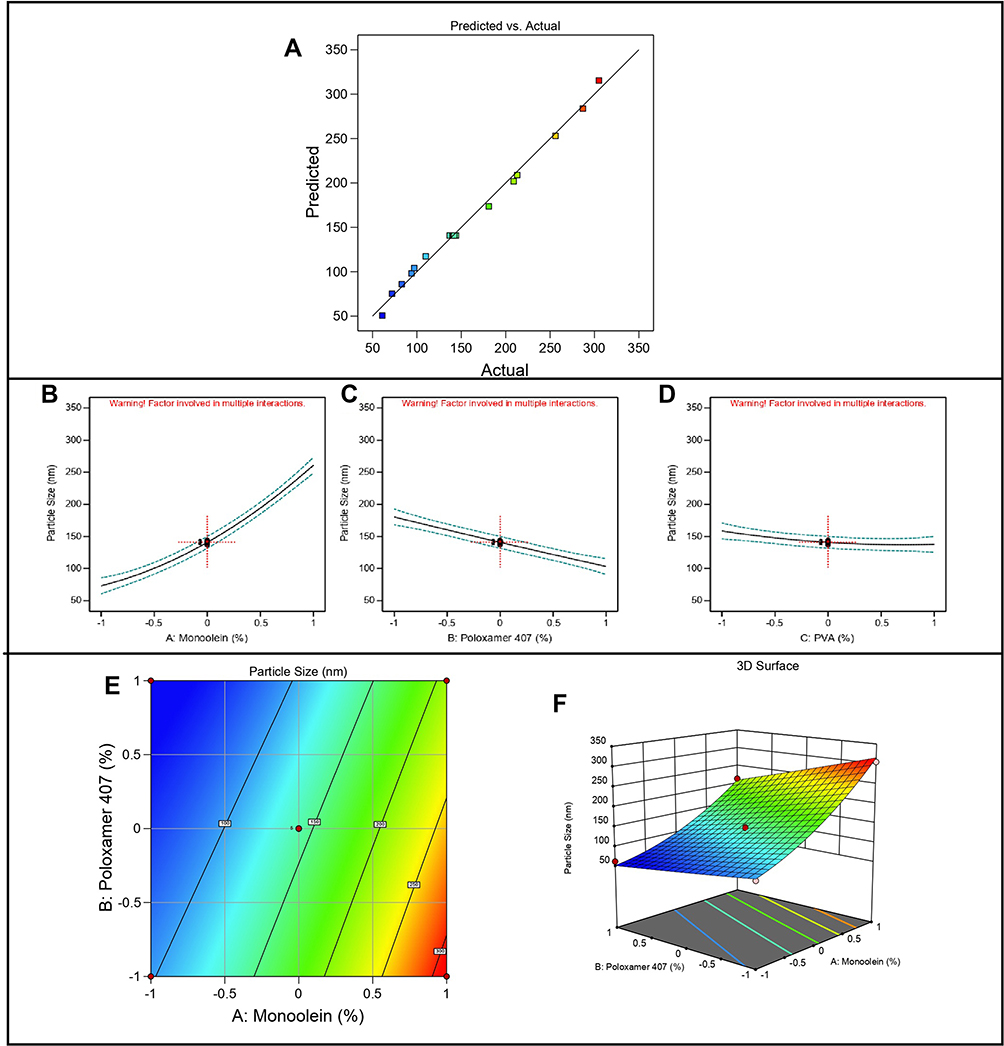 |
Figure 1 Predicted versus actual diagram, Main effect diagram, Contour, and 3-D response surface plots representing the effect of the studied variables on particle size (Y1). (A) Predicted versus actual diagram. (B) Main effect diagram of monoolein (%); (C) Main effect diagram of Poloxamer 407 (%); (D) Main effect diagram of PVA (%); (E) Contour Plot showing the effect of monoolein % and poloxamer %; (F) 3-D Surface plot representing the effects of the monoolein % and poloxamer % on particle size. |
The individual effect of independent factors on the particle size is shown in Figure 1B–D. It should be noted that the final response will be affected by the interaction between the independent factors, which are better predicted using contour and response surface plots. From the figure it is quite clear that at selected concentrations, the influence of individual factors was in the order monoolein > Poloxamer 407 > PVA. A drastic increase in particle size resulted from an increase in the monoolein concentration. On the contrary, increasing the concentration of Poloxamer 407 decreased the particle size. The effect of PVA in the selected concentration range was quite a bit less, but there was a slight decrease in particle size when its concentration was increased.
The contour and response surface plots are shown in Figure 1E and F. A distinct effect of the monoolein on particle size can be identified in the contour and response surface plots. From the iso-value curves, it can be seen that the particle size ranged from 100 to 250 nm when the concentration of monoolein was changed. In this case, the iso-value curves were almost parallel to the PVA concentration, which implies a lesser effect of PVA on particle size. Nevertheless, a slight decrease in particle size with a higher concentration of PVA may be noted. In the contour and response surface plots, Poloxamer 407 is shown to have a moderate effect on particle size. The particle size was found to decrease moderately with an increase in the Poloxamer 407 concentration. One of the main goals of the research is to prepare a nanosized cubosomes by decreasing the particle size. So, during optimization, the software was set to the goal of minimizing the particle size in order to obtain an optimum formula with small particle size.
The quadratic model resulted in the following polynomial equation for entrapment efficiency in terms of coded factors.
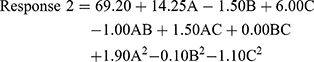
where Response 2 is the entrapment efficiency, A is the concentration of monoolein used, B is the concentration of Poloxamer 407 used, and C is the concentration of PVA used. From the equation, it can be seen that monoolein and PVA had a positive effect on the entrapment efficiency, whereas Poloxamer 407 had a negative effect. The effect was most pronounced for the concentration of monoolein. The concentration of Poloxamer 407 had the least effect on entrapment efficiency.
A plot of the predicted and actual values for entrapment efficiency is shown in Figure 2A. The predicted versus actual plot was indicative of a good correlation between the predicted and actual results.
 |
Figure 2 Predicted versus actual diagram, Main effect diagram, with contour, and 3-D response surface plots representing the effect of the studied variables on EE% (Y2). (A) Predicted versus actual diagram. (B) Main effect diagram showing the effect of monoolein (%); (C) Main effect diagram showing the effect of Poloxamer 407 (%); (D) Main effect diagram of PVA (%); (E) Contour Plot showing the effect of monoolein % and PVA %; (F) 3-D Surface plot representing the effects of % monoolein and %PVA on %EE. |
The individual effect of independent factors on the entrapment efficiency is shown in Figure 2B–D. In the case of the entrapment efficiency, higher concentrations of monoolein were found to favor drug entrapment. The effect was much higher when compared with the individual effects of Poloxamer 407 and PVA. A higher concentration of Poloxamer 407 slightly decreased the entrapment efficiency, but higher concentrations of PVA increased the entrapment of the drug in the cubosomes.
The contour and response surface plots for entrapment efficiency are shown in Figure 2E and F. From the plots, it can be seen that monoolein caused a drastic increase in the entrapment efficiency. The iso-value curves are almost perpendicular to the monoolein axis and thus indicate a significant effect. As shown in the contour plot and response surface plots, the value of the entrapment efficiency changed from around 55% to 85% when changing the monoolein concentration in the selected concentration range. The iso-value curves were almost parallel to the axis of Poloxamer 407. This indicated that the selected concentration range of Poloxamer 407 had no significant influence on the entrapment efficiency of SQ; however, a slight decrease in the entrapment efficiency was noted with higher concentrations of Poloxamer 407. In the case of PVA, a moderate positive effect was noted in the entrapment efficiency with increasing the concentration.
The quadratic model resulted in the following polynomial equation for gelation temperature in terms of coded factors.

where Response 3 is the gelation temperature, A is the concentration of monoolein used, B is the concentration of Poloxamer 407 used, and C is the concentration of PVA used. The concentration of monoolein was found to not affect the gelation temperature, as indicated by a zero value for the coefficient of A. Both the Poloxamer 407 and PVA concentrations had a negative effect on the gelation temperature. The concentration of Poloxamer 407 had a greater effect than PVA.
A plot of the predicted and actual values for gelation temperature is shown in Figure 3A. As in the case of the particle size and entrapment efficiency, the predicted versus actual plot for the gelation temperature was linear, which was indicative of a good correlation between the predicted and actual results.
 |
Figure 3 Predicted versus actual diagram, Main effect diagram, Contour, and 3-D response surface plots representing the effect of the studied variables on Gelation Temperature (Y3). (A) Predicted versus actual diagram. (B) Main effect diagram of monoolein (%); (C) Main effect diagram of Poloxamer 407 (%); (D) Main effect diagram of PVA (%); (E) Contour Plot showing the effect of poloxamer % and PVA %; (F) 3-D Surface plot representing the effects of the poloxamer % and PVA% on gelation temperature. |
The individual effect of the independent variables on gelation temperature is shown in Figure 3B–D. It can be seen that the gelation temperature was almost unaffected by the monoolein concentration. This indicated the absence of any thermogelling property of monoolein. At the same time, higher concentrations of Poloxamer 407 caused a significant reduction in the gelation temperature. This response was expected based on previously reported studies with Poloxamer 407.28–30 The effect of PVA on the gelation temperature was less compared with that of Poloxamer 407 in the selected concentration range. Polymer blends of PVA and its derivatives are also reported to have thermosensitive behavior.34,35
The contour and response surface plots for gelation temperature are shown in Figure 3E and F. The iso-value curves for gelation temperature were more or less parallel to the axis of monoolein. At the same time, the iso-value curves for gelation temperature were more or less perpendicular to the axis of Poloxamer 407. PVA had a moderate effect when compared with that of Poloxamer 407. In the contour plot of monoolein versus PVA, the iso-value curves were perpendicular to the axis of the PVA concentration. The variation in gelation temperature from 28 to 34ºC could be observed.
The quadratic model resulted in the following polynomial equation for the stability index in terms of coded factors.

where Response 4 is the stability index, A is the concentration of monoolein used, B is the concentration of Poloxamer 407 used, and C is the concentration of PVA used. From the equation, it is clear that the PVA concentration had the highest effect on the stability index compared with other factors. Also, the effect was positive with a higher concentration of PVA, resulting in higher stability. A similar positive effect was noted for Poloxamer 407. The concentration of monoolein had a negative effect on the stability index.
A plot of the predicted and actual values for the stability index is shown in Figure 4A. As in the case of the other three responses described earlier, the predicted versus actual plot for the stability was linear, which was indicative of a good correlation between the predicted and actual results.
 |
Figure 4 Predicted versus actual diagram, Main effect diagram, Contour, and 3-D response surface plots representing the effect of the studied variables on the stability index (Y4). (A) Predicted versus actual diagram. (B) Main effect diagram of monoolein (%); (C) Main effect diagram of Poloxamer 407 (%); (D) Main effect diagram of PVA (%); (E) Contour Plot showing the effect of poloxamer % and PVA %; (F) 3-D Surface plot representing the effects of the poloxamer % and PVA% on stability index. |
Figure 4B–D shows the one-factor interactions for the response stability index. It can be seen that the PVA concentration had a more pronounced effect on the stability index than any other factor. The effect of monoolein was much less than that of the PVA. The stability index value, and thus the stability of the cubosomes, was found to decrease slightly when the monoolein concentration was increased from 5% to 15%. In the case of Poloxamer 407, a slightly more pronounced, but positive, effect was observed for the stability index. Thus, higher Poloxamer concentrations favored the stability of cubosomes when they were used in the studied concentration range. The effect was noted even with a slight change in the concentration of the Poloxamer (15% to 20%). Thus, a careful selection of the Poloxamer concentration is required for stable cubosomes. The concentration of PVA had a drastic effect on the stability index even when used at low concentrations of 2.5% to 7.5%. The concentration of PVA had a positive effect on the stability index, meaning that a high concentration of PVA resulted in the enhanced cubosome stability. The stability index varied from 81% to 95%. Nevertheless, it may be noted that the overall effect of the individual factors is influenced by and subjected to interaction effects between the independent factors.
The contour and response surface plots for the stability index are shown in Figures 4E and F. From the contour plots, it can be seen that the iso-value curves of the stability index are more or less perpendicular to the PVA axis. Here, the value of the stability index varied from 80% to 90%. A similar observation was made in the case of the response surface plots. As expected from the individual effects, the response surface and contour plots also indicated a lesser effect for monoolein. Poloxamer 407 was found to have a moderate effect.
Optimized Formulation
The optimized formula provided by the software consisted of monoolein (8.96%), Poloxamer (17.45%), and PVA (7.5%). The optimized cubosomal formulation was prepared and evaluated. The predicted and observed values for the optimized formulation are shown in Table 4. The values were well in agreement, providing proof for a successful design validity and optimization.
 |
Table 4 Responses for the Optimized Formulation |
Morphological Examination
The TEM image (Figure 5) revealed that the optimized cubosomes had similar morphology to the reported cubosomes.36 They had an irregular polyangular structure. The individual particle size was between 100 and 150 nm in the TEM image and was in agreement with the results of particle size analysis by dynamic light scattering, which indicated that the average particle size for the optimum formula is 120 nm.
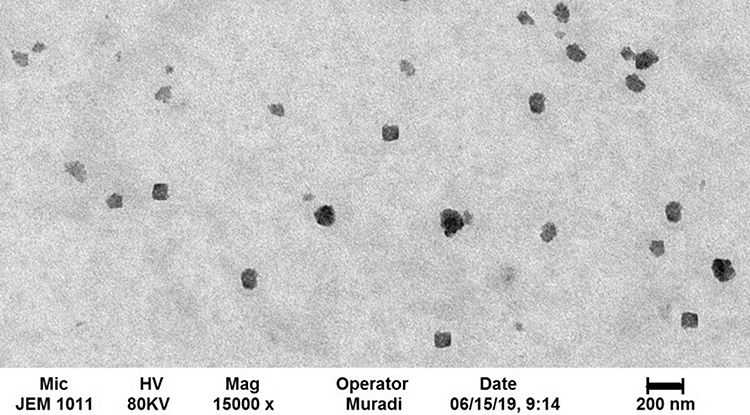 |
Figure 5 TEM image of SQ-loaded cubosomes. |
Ex vivo Permeation Studies
Ex vivo evaluation was carried out to study the permeation characteristics of the optimized SQ-loaded cubosomal thermogelling dispersions with the aqueous suspension of SQ. The results of the ex vivo evaluation are provided in Table 5. From the value of the steady-state flux, permeability coefficient, and enhancement factor, it is quite evident that the cubosomal thermogelling dispersion of SQ had superior drug permeability which favors better drug bioavailability. The cumulative amount of drug permeated can be used for a direct comparison of drug permeation when normalized for the area. This value directly gives the amount of drug that crosses the barrier, which here is the mucosal membrane from the sheep nostril. Thus, about 51% of the SQ permeated from the cubosomal thermogelling dispersion compared to only 14.5% from the aqueous dispersion. From the value of the steady-state flux of SQ, a rapid transport of SQ across the membrane by the cubosomal thermogelling dispersion was indicated by a flux value of 42.93 µg/cm2min. The flux of the SQ aqueous dispersion was 11.29 µg/cm2min only.
 |
Table 5 Permeation Parameters from ex vivo Studies |
Recently, the permeation enhancement factor has gained attention in the prediction of the permeability of a drug. In the present study, the enhancement factor was nearly equal to 3.5 times for the SQ-loaded cubosomal thermogelling dispersion when compared with the aqueous dispersion of SQ.
The permeation profile of the SQ formulations is given in Figure 6A. The cumulative amount of SQ permeated per unit area is distinctly more for the SQ-loaded cubosomal thermogelling dispersion. When plotted with the square root of time (Figure 6B), the permeation shows a more or less linear profile which indicates that the Higuchian matrix diffusion mechanism is in effect for the permeation of the SQ from the cubosomes.37
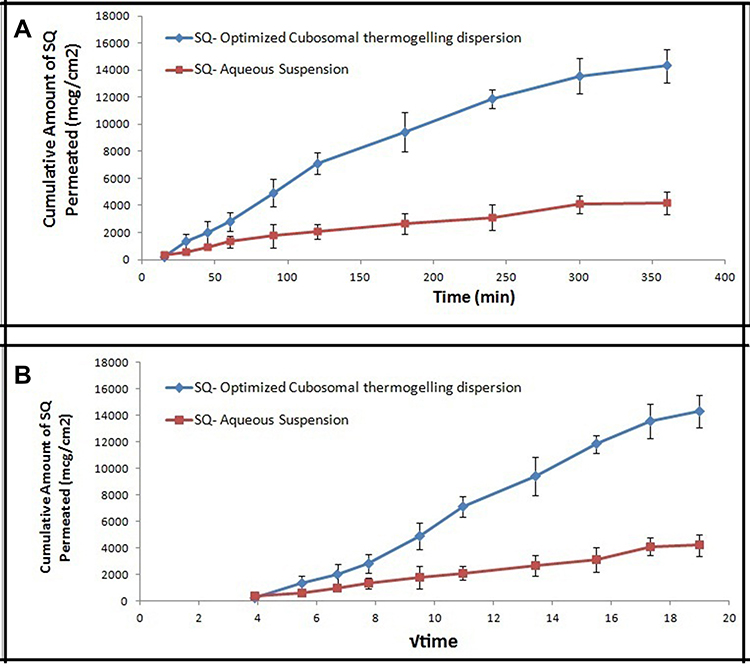 |
Figure 6 Permeation profile of SQ-loaded systems. (A) against the time. (B) against the square root of time. |
In vivo Evaluation
The in vivo evaluation of the developed cubosomes was carried out in albino rabbits with reference to oral and intranasal aqueous suspensions. The pharmacokinetic parameters for the drug when administered as intranasal cubosomes and oral and intranasal aqueous dispersion are provided in Table 6. The plasma SQ concentration–time profile for the formulations is shown in Figure 7.
 |
Table 6 Pharmacokinetic Parameters of SQ from the Formulations |
 |
Figure 7 Plasma SQ concentration–time profile for the tested formulations. |
From the pharmacokinetic profile of the SQ from the formulations, it can be seen that improvement in the pharmacokinetic parameters is possible with the administration of SQ as cubosomes. A clear Cmax was obtained for the cubosomal thermogelling dispersion with a value of 120.44±13 µg/mL. At the same time, technically a Cmax value of 37.43±5 µg/mL was obtained for the oral aqueous suspension of SQ and 78.5±9 µg/mL for intranasal SQ aqueous suspension. A higher value of Cmax is a clear indication of higher bioavailability. The Cmax is also a pharmacokinetic parameter for the assessment of bioavailability and this value is beneficial in assessing the drug with more availability to its site of action. This enhancement could be due to the fact that the absorption of nanoparticulate formulation depends on the physicochemical properties of the nanosized vesicles rather than the drug itself, and the nano range size of these particles enhances their absorption.38 Moreover, the plasma half-life of the SQ increased in the case of the intranasal administration either for SQ-loaded cubosomal thermogelling dispersion or for SQ-aqueous suspension. As a result, the elimination rate constant was less for the intranasal formulations compared to the oral formulation. A lower value for the elimination rate constant means that the drug is slowly eliminated from the body. This could be due to the presence of Poloxamer 188 surfactant in the formulation which causes steric hindrance that helps in reducing the tissue uptake by evading the reticuloendothelial system, which increased the residence time of the NPs in the blood circulation39,40 Thus, the favorable pharmacokinetic parameters for the SQ-loaded cubosomal thermogelling dispersion could help in dose reduction and dosing frequency. This is a very important aspect of therapeutic compliance and efficacy. Further modification in the formulation parameters could even facilitate the development of prolonged-release cubosomal thermogelling dispersions of SQ.
As expected, the AUC0-inf value of SQ-loaded cubosomal thermogelling dispersion was much higher than for the aqueous suspension of either oral or intranasal SQ. A notable increase in bioavailability was observed when the cubosomal thermogelling dispersion was administered by the intranasal route. The relative bioavailability was about 12-fold greater when compared with the oral aqueous suspension and more than 2.5-fold greater compared to the intranasal aqueous suspension.
Conclusion
The present study reports the optimization and evaluation of an SQ-loaded cubosomal thermogelling dispersion. A Box–Behnken design was used to study the effect of monoolein, Poloxamer 407, and PVA as independent factors. The particle size, entrapment efficiency, gelation temperature, and stability index were evaluated as responses. The quadratic response model used to evaluate the responses. The optimized formulation suggested by the software was prepared and evaluated. TEM revealed the typical irregular polyangular structure for cubosomes. The steady-state flux, permeability coefficient, and enhancement factor were higher for the cubosomal thermogelling dispersion of SQ during ex vivo permeation in comparison with an aqueous suspension of SQ. From the in vivo studies in albino rabbits, a superior pharmacokinetic profile was observed for the SQ-loaded cubosomal thermogelling dispersion. The relative bioavailability was about 12-fold higher when compared with the oral aqueous suspension and about 2.5-fold higher when compared to intranasal aqueous suspension. Thus, the SQ-loaded cubosomal thermogelling formulation is considered effective for the CNS delivery of SQ by intranasal administration.
Acknowledgment
This work was supported by the Deanship of Scientific Research (DSR), King Abdulaziz University, Jeddah, under grant No. (D-264-166-1439). The author, therefore, gratefully acknowledges the DSR technical and financial support.
Disclosure
The author reports that there are no conflicts of interest.
References
1. Gupta S, Kesarla R, Omri A. Approaches for CNS delivery of drugs–nose to brain targeting of antiretroviral agents as a potential attempt for complete elimination of major reservoir site of HIV to aid AIDS treatment. Expert Opin Drug Deliv. 2019;16(3):287–300. doi:10.1080/17425247.2019.1583206
2. Lu C-T, Zhao Y-Z, Wong HL, Cai J, Peng L, Tian X-Q. Current approaches to enhance CNS delivery of drugs across the brain barriers. Int J Nanomed. 2014;9:2241–2257.
3. Rao KS, Ghorpade A, Labhasetwar V. Targeting anti-HIV drugs to the CNS. Expert Opin Drug Deliv. 2009;6(8):771–784. doi:10.1517/17425240903081705
4. Roy U, Drozd V, Durygin A, et al. Characterization of nanodiamond-based anti-HIV drug delivery to the brain. Sci Rep. 2018;8(1):1603. doi:10.1038/s41598-017-16703-9
5. Grassin-Delyle S, Buenestado A, Naline E, et al. Intranasal drug delivery, an efficient and non-invasive route for systemic administration, focus on opioids. Pharmacol Ther. 2012;134(3):366–379. doi:10.1016/j.pharmthera.2012.03.003
6. Wang Z, Xiong G, Tsang WC, Schätzlein AG, Uchegbu IF. Nose-to-Brain Delivery. J Pharmacol Exper Ther. 2019;370(3):593–601. doi:10.1124/jpet.119.258152
7. Agrawal M, Saraf S, Saraf S, et al. Nose-to-brain drug delivery, An update on clinical challenges and progress towards approval of anti-Alzheimer drugs. J Control Release. 2018;281:139–177. doi:10.1016/j.jconrel.2018.05.011
8. Tzeyung AS, Md S, Bhattamisra SK, et al. Fabrication, optimization, and evaluation of rotigotine-loaded chitosan nanoparticles for nose-to-brain delivery. Pharmaceutics. 2019;11(1):26. doi:10.3390/pharmaceutics11010026
9. Ramana LN, Sharma S, Sethuraman S, Ranga U, Krishnan UM. Evaluation of chitosan nanoformulations as potent anti-HIV therapeutic systems. Biochim Biophys Acta. 2014;1840(1):476–484. doi:10.1016/j.bbagen.2013.10.002
10. Kim AE, Dintaman JM, Waddell DS, Silverman JA. Saquinavir, an HIV protease inhibitor, is transported by P-glycoprotein. J Pharmacol Exper Ther. 1998;286(3):1439–1445.
11. Thummel KE, Kunze KL, Shen DD. Enzyme-catalyzed processes of first-pass hepatic and intestinal drug extraction. Adv Drug Deliv Rev. 1997;27(2–3):99–127. doi:10.1016/S0169-409X(97)00039-2
12. Kaushik A, Jayant RD, Nair M. Nanomedicine for neuroHIV/AIDS management. 2018;13(7):669–673. doi:10.2217/nnm-2018-0005
13. Belgamwar A, Khan S, Yeole P. Intranasal chitosan-g-HPβCD nanoparticles of efavirenz for the CNS targeting. Artif Cells Nanomed Biotechnol. 2018;46(2):374–386. doi:10.1080/21691401.2017.1313266
14. Mahajan HS, Mahajan MS, Nerkar PP, Agrawal A. Nanoemulsion-based intranasal drug delivery system of saquinavir mesylate for brain targeting. Drug Deliv. 2014;21(2):148–154. doi:10.3109/10717544.2013.838014
15. Kuo YC, Ko HF. Targeting delivery of saquinavir to the brain using 83-14 monoclonal antibody-grafted solid lipid nanoparticles. Biomaterials. 2013;34(20):4818–4830. doi:10.1016/j.biomaterials.2013.03.013
16. Vyas TK, Shahiwala A, Amiji MM. Improved oral bioavailability and brain transport of Saquinavir upon administration in novel nanoemulsion formulations. Int J Pharm. 2008;347(1–2):93–101. doi:10.1016/j.ijpharm.2007.06.016
17. Eldeeb AE, Salah S, Ghorab M. Formulation and evaluation of cubosomes drug delivery system for treatment of glaucoma, Ex-vivo permeation and in-vivo pharmacodynamic study. J Drug Deliv Sci Technol. 2019;52:236–247. doi:10.1016/j.jddst.2019.04.036
18. M Lakshmi N, R Yalavarthi P, C Vadlamudi H, Thanniru J, Yaga G. Cubosomes as targeted drug delivery systems-a biopharmaceutical approach. Curr Drug Discov Technol. 2014;11(3):181–188. doi:10.2174/1570163811666140505125923
19. Pan X, Han K, Peng X, et al. Nanostructured cubosomes as advanced drug delivery system. Curr Pharm Des. 2013;19(35):6290–6297. doi:10.2174/1381612811319350006
20. Barriga HM, Holme MN, Stevens MM, Cubosomes T. Next generation of smart lipid nanoparticles? Angew Chem Int Ed . 2019;58(10):2958–2978.
21. Ahirrao M, Shrotriya S. In vitro and in vivo evaluation of cubosomal in situ nasal gel containing resveratrol for brain targeting. Drug Dev Ind Pharm. 2017;43(10):1686–1693. doi:10.1080/03639045.2017.1338721
22. Angelova A, Angelov B, Drechsler M, et al. Neurotrophin delivery using nanotechnology. Drug Discov Today. 2013;18(23–24):1263–1271. doi:10.1016/j.drudis.2013.07.010
23. Boge L, Bysell H, Ringstad L, et al. Lipid-based liquid crystals as carriers for antimicrobial peptides: phase behavior and antimicrobial effect. Langmuir. 2016;32(17):4217–4228. doi:10.1021/acs.langmuir.6b00338
24. Chen Y, Angelova A, Angelov B, et al. Sterically stabilized spongosomes for multidrug delivery of anticancer nanomedicines. J Mater Chem B. 2015;3(39):7734–7744. doi:10.1039/C5TB01193K
25. Remmel RP, Kawle SP, Weller D, Fletcher CV. Simultaneous HPLC assay for quantification of indinavir, nelfinavir, ritonavir, and saquinavir in human plasma. Clin Chem. 2000;46(1):73–81. doi:10.1093/clinchem/46.1.73
26. Di L, Kerns EH, Fan K, McConnell OJ, Carter GT. High throughput artificial membrane permeability assay for blood–brain barrier. Eur J Med Chem. 2003;38(3):223–232. doi:10.1016/S0223-5234(03)00012-6
27. Yue PF, Lu XY, Zhang ZZ, et al. The study on the entrapment efficiency and in vitro release of puerarin submicron emulsion. AAPS Pharmscitech. 2009;10(2):376–383. doi:10.1208/s12249-009-9216-3
28. Vauthier C, Bouchemal K. Methods for the preparation and manufacture of polymeric nanoparticles. Pharm Res. 2009;26(5):1025–1058. doi:10.1007/s11095-008-9800-3
29. Bei D, Marszalek J, Youan -B-BC. Formulation of dacarbazine-loaded Cubosomes–part II: influence of process parameters. AAPS PharmSciTech. 2009;10(3):1040–1047. doi:10.1208/s12249-009-9296-0
30. Barriga HMG, Holme MN, Stevens MM. Cubosomes: the next generation of smart lipid nanoparticles? Angew Chemie Int Ed. 2019;58(10):2958–2978. doi:10.1002/anie.201804067
31. Fakhari A, Corcoran M, Schwarz A. Thermogelling properties of purified poloxamer 407. Heliyon. 2017;3(8):e00390. doi:10.1016/j.heliyon.2017.e00390
32. Giuliano E, Paolino D, Fresta M, Cosco D. Mucosal applications of poloxamer 407-based hydrogels, an overview. Pharmaceutics. 2018;10(3):159. doi:10.3390/pharmaceutics10030159
33. Lu CT, Zhao YZ, Wong HL, Cai J, Peng L, Tian XQ. Current approaches to enhance CNS delivery of drugs across the brain barriers. Int J Nanomedicine. 2014;9:2241.
34. Montaser AS, Rehan M, El-Naggar ME. pH-Thermosensitive hydrogel based on polyvinyl alcohol/sodium alginate/N-isopropyl acrylamide composite for treating re-infected wounds. Int J Biol Macromol. 2019;124:1016–1024. doi:10.1016/j.ijbiomac.2018.11.252
35. Nasr M, Ghorab MK, Abdelazem A. In vitro and in vivo evaluation of cubosomes containing 5-fluorouracil for liver targeting. Acta Pharm Sin B. 2015;5(1):79–88.
36. Nasr M, Ghorab MK, Abdelazem A. In vitro and in vivo evaluation of cubosomes containing 5-fluorouracil for liver targeting. Acta Pharm Sin. 2015;B5(1):79–88.
37. Peng X, Zhou Y, Han K, et al. Characterization of cubosomes as a targeted and sustained transdermal delivery system for capsaicin. Drug Des Devel Ther. 2015;9:4209. doi:10.2147/DDDT.S86370
38. Doijad R, Manvi F, Godhwani D, Joseph R, Deshmukh N. Formulation and targeting efficiency of cisplatin engineered solid lipid nanoparticles. Indian J Pharm Sci. 2008;70(2):203. doi:10.4103/0250-474X.41456
39. Patra JK, Das G, Fraceto LF, et al. Nano based drug delivery systems: recent developments and future prospects. J Nanobiotechnol. 2018;16(1):71. doi:10.1186/s12951-018-0392-8
40. Aljaeid BM, El-Say KM, Hosny KM. Chitosan-TPP nanoparticles stabilized by poloxamer for controlling the release and enhancing the bioavailability of doxazosin mesylate: in vitro, and in vivo evaluation. Drug Dev Ind Pharm. 2019;45(7):1130–1139. doi:10.1080/03639045.2019.1597105
 © 2020 The Author(s). This work is published and licensed by Dove Medical Press Limited. The
full terms of this license are available at https://www.dovepress.com/terms
and incorporate the Creative Commons Attribution
- Non Commercial (unported, 3.0) License.
By accessing the work you hereby accept the Terms. Non-commercial uses of the work are permitted
without any further permission from Dove Medical Press Limited, provided the work is properly
attributed. For permission for commercial use of this work, please see paragraphs 4.2 and 5 of our Terms.
© 2020 The Author(s). This work is published and licensed by Dove Medical Press Limited. The
full terms of this license are available at https://www.dovepress.com/terms
and incorporate the Creative Commons Attribution
- Non Commercial (unported, 3.0) License.
By accessing the work you hereby accept the Terms. Non-commercial uses of the work are permitted
without any further permission from Dove Medical Press Limited, provided the work is properly
attributed. For permission for commercial use of this work, please see paragraphs 4.2 and 5 of our Terms.