Back to Journals » International Journal of Nanomedicine » Volume 12
Nanoparticle abraxane possesses impaired proliferation in A549 cells due to the underexpression of glucosamine 6-phosphate N-acetyltransferase 1 (GNPNAT1/GNA1)
Authors Zhao MZ, Li HY, Ma Y ![]() , Gong H, Yang S, Fang Q, Hu ZY
, Gong H, Yang S, Fang Q, Hu ZY
Received 11 December 2016
Accepted for publication 24 January 2017
Published 1 March 2017 Volume 2017:12 Pages 1685—1697
DOI https://doi.org/10.2147/IJN.S129976
Checked for plagiarism Yes
Review by Single anonymous peer review
Peer reviewer comments 3
Editor who approved publication: Dr Linlin Sun
Minzhi Zhao,* Haiyun Li,* Yan Ma, He Gong, Shu Yang, Qiaojun Fang, Zhiyuan Hu
Chinese Academy of Sciences Key Laboratory for Biomedical Effects of Nanomaterials and Nanosafety, CAS Center for Excellence in Nanoscience, National Center for Nanoscience and Technology, Beijing, People’s Republic of China
*These authors contributed equally to this work
Abstract: Abraxane (Abr), a US Food and Drug Administration-approved albumin-bound nanoparticle applied for the treatment of non-small-cell lung cancer, has been reported to be more effective than paclitaxel (PTX). To further understand the molecular mechanisms that produce this superior drug efficacy of Abr, a quantitative proteomic approach has been applied to investigate the global protein expression profiles of lung cancer cell A549 treated with Abr and PTX. Only one protein, namely, glucosamine 6-phosphate N-acetyltransferase 1 (GNA1), showed significant differential expression (P<0.05) in the cutoff of 2.0 fold, suggesting that Abr can be used safely as a substitute for PTX. GNA1 is a key enzyme in the biosynthesis of uridine diphosphate-N-acetylglucosamine, which is an important donor substrate for N-linked glycosylation and has several important functions such as embryonic development and growth. Albumin plays a major role in the regulation of this protein. In summary, this study first shows that the superior drug effect of Abr is mainly due to the downregulation of GNA1, which causes proliferative delay and cell adhesion defect. It is also noteworthy that the deficiency of GNA1 might reduce insulin secretion which correlates with type 2 diabetes.
Keywords: quantitative proteomics, nano-drug, drug efficacy, lung cancer, molecular mechanisms, abraxane
Introduction
Lung cancer is the second most common cancer and the leading cause of cancer death globally.1 Approximately 80%–85% of lung cancers are non-small-cell lung cancer (NSCLC). Nearly 70% of patients present with advanced stage disease, and the response rate to current standard combination chemotherapy is only 20%–25%.2 There exists the need for novel treatment approaches in NSCLC. Third generation chemotherapy agents (paclitaxel [PTX], docetaxel, gemcitabine, pemetrexed, or vinorelbine) in combination with a platinum compound (cisplatin, carboplatin) are the most commonly used backbone regimens for the first-line treatment of advanced NSCLC.3 However, toxicities and solubility issues complicate the use of taxanes, especially PTX, since the commercial PTX preparation (Taxol) is formulated in a vehicle composed of Cremophor EL (Cr-P) which is toxic and has several negative side effects.4,5 Furthermore, the short-term stability of PTX upon dilution with aqueous media can result in possible drug precipitation.6 It follows that the clinical application of Taxol is connected with problems of incompatibility and instability. Therefore, the development of an improved delivery system for PTX is of high significance.
Protein and liposome nanoparticles (NPs) represent a promising approach to the optimization of PTX delivery. Within the improved PTX-based drug system, only Abraxane (Abr, albumin [ALB] NP-bound PTX) and Lipusu (liposomal PTX approved by the State Food and Drug Administration [FDA] of China) have entered the stage of clinical applications. Abr is the only non-liposomal preparation of PTX that has entered the market. ALB NP formulation allows PTX to penetrate into tumors more easily and makes the drug more tolerable than Taxol.7 Abr significantly improved the response rate in NSCLC patients in comparison with generic chemotherapy with PTX drug. It has been approved by FDA for use in patients with NSCLC.8 However, the mechanism by which a better response was achieved and how the response was carried out are rarely known.
It has been reported that ALB particles extravasate from blood through the ALB receptor to increase local tumor concentrations of the drug, making Abr twice as effective as Taxol in treating metastatic breast cancer.9–11 Whether it also applies to lung cancer is unknown and molecular mechanism needs to be deeply explored in the global scope. Furthermore, most of the recent reports described above are about the route of exposure12/concentration12/delivery13 or distribution14 of free PTX; no attention was given to ALB or the whole features. Few investigations have concentrated on the specific mechanism of direct drug effect on the contact of tumor cells at the biological molecular aspect of the host cells. It was reported that in Cremophor-based (solvent-based) PTX (Taxol), Cremophor EL would reduce the free PTX proportion by trapping of the compound in Cremophor EL micelles.15,16 Combined with the potential side effect of Cremophor EL on cells, free/unbound PTX was used as the control group. Previously, the molecular mechanisms involved in the drug resistance of NP formation of PTX and Abr have been studied at the transcriptomics and proteomics level.17,18 The aim of this study is to understand the mechanism of PTX NP formulations on lung cancer cells. Comparative proteomic analysis was carried out on Abr NPs and PTX on NSCLC human lung adenocarcinoma cells A549.
Methods
Drugs and chemicals
Abr was obtained from Celgene Corporation (Summit, NJ, USA). PTX was procured from Zhejiang Hisun Pharmaceutical Factory (China). PI, RNase A and MTT (3-(4,5-dimethyl-thiazol-2-yl)-2,5-diphenyl tetrazolium bromide), Alexa Fluor 488-phalloidin, and Hoechst 33342 were purchased from Sigma-Aldrich (St Louis, MO, USA); dimethyl sulfoxide (DMSO) from Amresco Inc. (Solon, OH, USA). Anticancer agents were prepared extemporaneously in complete culture medium immediately prior to use in vitro.
Cell culture
The human NSCLC cell line, A549 (ATCC, CCL-185), was maintained in Dulbecco’s Modified Eagle’s Medium/high glucose (DMEM/H; Thermo Fisher Scientific, Waltham, MA, USA) supplemented with 10% (v/v) fetal bovine serum (FBS; Thermo Scientific), 100 U/mL penicillin (Gibco BRL, Grand Island, NY, USA), and 100 μg/mL streptomycin (Gibco BRL) in a highly humidified atmosphere of 5% CO2 at 37°C. Cells were passed using a solution containing 0.05% trypsin and 0.5 mM ethylenediaminetetraacetic acid (EDTA; Life Technologies, Gaithersburg, MD, USA), when the density became 70%–80%.
Cell viability assay
Cell viability was determined by MTT assay. Briefly, cells were seeded on sterilized substrates in 96-well plates at 4×10³ cells/100 μL medium in each well. After 24 h, the medium was aspirated and replaced with 200 μL of media containing serial dilutions of treatment samples. The concentrations of Abr and PTX used in each group were 10, 100, 500, 1,000, 2,000, 4,000, 8,000, and 16,000 nM. After incubation for 24 h at 37°C, the drug containing growth medium was replaced with 100 μL medium containing 10 μL of MTT (5 mg/mL in phosphate-buffered solution [PBS]). After 4 h, the culture solution was removed, leaving behind the precipitate. Thereafter, 150 μL of DMSO was added to each well to suspend the formazan crystals while vigorously stirring the plates using an automated shaker. The absorbance of each well was read on a microplate reader (Tecan, Zurich, Switzerland) at a test wavelength of 570 nm. Six wells were used for each drug concentration, and the experiment was repeated three times. Relative cell viability to untreated control cells was calculated.
SILAC labeling
All SILAC reagents were from Pierce™ SILAC Protein Quantitation Kits (Thermo Fisher Scientific Inc., Waltham, MA, USA). Cells were grown in SILAC media containing either light isotopes of 12C6 L-lysine and 12C6 14N4 L-arginine (Lys0/Arg0) or heavy isotopes of 13C615N2 L-lysine and 13C615N4 L-arginine (Lys8/Arg10) for six rounds of cell division in SILAC DMEM supplemented with 10% dialyzed FBS for complete incorporation of isotope-labeled amino acids. Then, the heavy-labeled cells were treated with 1 μM Abr, and light-labeled cells were treated with 1 μM PTX as the control.
Protein extraction, separation, and in-gel digestion
Cells were collected in 2% sodium dodecyl sulfate (SDS) lysis buffer containing 0.1 mM phenylmethylsulfonyl fluoride and 1 mM EDTA as addition protease inhibitor and sonicate cells to decrease viscosity by breaking DNA. The lysates were dissolved with repeated vortex and ultra-sonication, followed by centrifugation at 25,000 × g at 4°C for 30 min to remove insoluble substances. The total protein concentration was determined by Bradford assay. Proteins extracted from the surfaces of PTX and Abr were mixed at a ratio of 1:1 for a total of 60 μg proteins. They were then separated by SDS-polyacrylamide gel electrophoresis (PAGE) on a 12.5% gel. Gels were fixed and stained with Coomassie Brilliant Blue. Each gel lane was excised into 24 slices. The slices were then cut into 1 mm3 pieces and destained in 50% acetonitrile with 25 mM ammonium bicarbonate solution, before being dehydrated in 100% acetonitrile and dried. The in-gel proteins were reduced by incubation with 10 mM dithiothreitol for 40 min at 56°C, followed by alkylation with 55 mM iodoacetamide for 40 min in the dark. After being washed and dehydrated, the proteins were digested with 8 ng/μL sequencing grade trypsin at 37°C overnight. The peptides were extracted from gel pieces with 0.1% formic acid and 50% acetonitrile for 120 min twice, and the extracts were dried in a vacuum centrifuge.
Liquid chromatography–tandem mass spectrometry (LC–MS/MS) analysis and data acquisition
Peptides were cleaned using TARGA C18 Microspin Columns (The Nest Group Inc., Southborough, MA, USA) and dried before resuspension in MS loading buffer (0.1% formic acid in H2O). Peptides were analyzed with Easy-nLC1000 nanoflow ultra-high performance liquid chromatography (Thermo Fisher Scientific) coupled to Q-Exactive MS (Thermo Fisher Scientific). Peptides were separated on a 100 μm ×10 cm in-house made column packed with a reversed phase ReproSil-Pur C18-AQ resin (3 μm, 120 Å, Dr Maisch GmbH, Ammerbuch, Germany). Gradient elution was performed from 2% acetonitrile to 40% acetonitrile in 0.1% formic acid over 4 h. High-energy collision dissociation was used to fragment the peptide precursor ions. Normalized collision energy was 30%. The Q-Exactive was operated in the data dependent top 15 method, collecting a full MS scan from 300 to 1,650 m/z at 70 K resolution and an AGC target of 1e6. The 15 most abundant ions per scan were selected for MS/MS at 17.5 K resolution and AGC target of 1e5 and intensity threshold of 1 K. Maximum fill times were 10 and 100 ms for MS and MS/MS scans, respectively, with a dynamic exclusion of 60 s. The respective software versions were Tune 2.6.0 and Xcalibur 2.2 (Thermo Fisher Scientific).
MS data analysis
Raw files were loaded into the MaxQuant software package (version 1.4.1.2)19 and searched against the Uniprot protein database downloaded from uniprot (ftp://ftp.uniprot.org/pub/databases/uniprot/current_release/knowledgebase/proteomes/) human protein sequence database using a target-decoy database to calculate the false discovery rate (FDR) using percolator supplemented with frequently observed contaminants and concatenated with reversed copies of all sequences. Andromeda search engine was used, and data were searched with 6 ppm precursor tolerance and 20 mDa tolerance for fragment ions. The protein modifications were carbamidomethylation (C) (fixed), oxidation (M) (variable), and protein N-terminal acetylation (variable); the enzyme specificity was set to trypsin; the maximum missed cleavages were set to two. Peptides with at least seven amino acids were considered for peptide identification. For SILAC analysis, two ratio counts were set as a minimum for quantification. The protein ratios were calculated from the median of all normalized peptide ratios using only unique peptides or peptides assigned to the protein group with the highest number of peptides (“razor” peptides). For protein identification, at least one unique or razor peptide was required. The required FDR was set to 1% at peptide and protein levels for protein identification. Statistical analysis of data and one sample Student’s t-tests were performed with Perseus software in the MaxQuant computational platform. Only proteins showing significance (P<0.05) and fold-change >2.0 (one sample Student’s t-test normalized ratio difference) were considered differentially regulated.
Western blot analysis
Cells were lysed with the same method of protein digestion as discussed earlier. Proteins (30 μg) were loaded onto 12.5% SDS-PAGE, separated, and then transferred to polyvinylidene fluoride membranes. The membranes were then blocked in 5% skim milk and incubated with primary antibodies (Abcam, Cambridge, UK) against GNPNAT1/GNA1, AKT, phosphor-Ser473-AKT (p-AKT), and β-actin. The blots were developed by chemiluminescence using Amersham enhanced chemiluminescence reagents (GE Healthcare, Little Chalfont, UK). For GNA1 analysis, three groups of sample were added, that is, 1 M pure ALB, 2 (2 M), and 4 (4 M) fold of PTX.
Cell adhesion
For the evaluation of cell attachment, cells were cultured in 24-well culture plates at an initial seeding density of 5×10⁴ cells/well 1 μM of Abr and PTX for 24 h, and two other groups in which samples were pre-incubated in 10 mM GlcNAc for 48 h. Then, the cells were resuspended and seeded on new dishes. After cleaning the unattached cells and trypsin digesting the attached cells after 4 h of seeding, cell number was counted using a hemocytometer. Cell adhesion rate was calculated from the proportion of adherent/seeded cells and then normalized with control group.
Cell proliferation
Cells (4×10³) were plated in 96-well plates per well. After 24 h, the medium was aspirated and replaced with 200 μL of media containing serial dilutions of treatment samples, including Abr and PTX. The concentrations of Abr and PTX used in each group were 1 μM. After 1, 3, and 5 days of treatment, 100 μL medium containing 10 μL of 5 mg/mL MTT in PBS was added to each well and the cells were incubated for another 4 h at 37°C. The supernatant was then removed, and 150 μL of DMSO was added to each well. The absorbency of each sample was measured with a microplate reader at the wavelength of 570 nm.
Confocal microscopy
Cells were washed with ice-cold PBS three times, then fixed with 4% formaldehyde at room temperature for 10 min, and incubated with 0.5% Triton X-100 in PBS for 5 min. The cells were then washed with cold PBS twice and stained with Alexa Fluor 488-phalloidin and Hoechst 33342 for 30 min in room temperature. After washing three times with cold PBS, confocal fluorescence imaging was performed on an Olympus FV1000-IX81 confocal-laser scanning microscope. A 50 mW, FV5-LAMAR 488 nm laser head was the excitation source for Alexa Fluor 488-phalloidin throughout the experiment, and emission was recorded between 520 and 620 nm. Hoechst 33342 was excited by a 50 mW, 405 nm laser head FV5-LD405-2 and collected with a band-pass filter within the range of 422–472 nm. The objective used for imaging was a UPLSAPO 100× oil-immersion objective with a numerical aperture of 1.4 (Olympus). During the characterization of different samples, all the parameters of the microscope were set to be the same for comparison of experimental and control groups.
Flow cytometry analysis
Cells after treatment for 24 h were subject to fluorescein isothiocyanate (FITC)-conjugated annexin V and PI staining, and apoptotic and necrotic cells were analyzed by FACS.20 To determine the percentage of apoptosis, annexin V and PI staining were performed by annexin V-FITC Apoptosis Detection Kit (Beyotime Institute of Biotechnology, Jiangsu, China). Then the apoptotic cells were detected by FACScan flow cytometry (BD Biosciences, San Jose, CA, USA). The results were analyzed by WinMDI 2.9 software (Purdue University Cytometry Laboratories, West Lafayette, IN, USA).
Statistical analysis
All functional experiments were done in triplicate. Data were averaged and expressed as mean ± standard deviation. They were analyzed with one-way analysis of variance, using Statistical Package for the Social Sciences (SPSS) software (version 19.0; SPSS Inc., Chicago, IL, USA), and the lowest level of statistical significance was defined as P<0.05.
Results and discussion
Cell viability results of A549 treated with Abr and PTX
To test the difference of drug effect of Abr and PTX on lung cancer cells in moderate time, cell viability of A549 cells was studied at several concentrations. Figure 1 shows that these two drugs had similar effects at 24 h. The values corresponding to the concentrations of 100 and 1,000 nM were nearly the same for these two drugs. Because the cell viability at 100 nM is very close to control, 1,000 nM (1 μM) point was chosen to study the difference of deep biological effects by quantitative proteomic analysis.
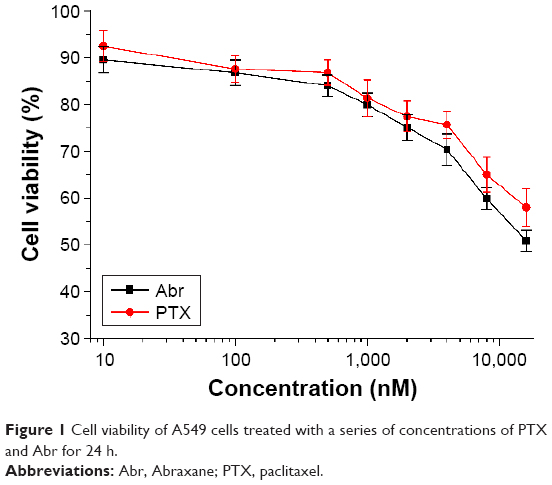 | Figure 1 Cell viability of A549 cells treated with a series of concentrations of PTX and Abr for 24 h. |
Quantitative proteomic analyses of A549 treated with Abr and PTX
A quantitative proteomic approach, the so-called stable isotope labeling with amino acids in cell culture (SILAC), was used to study the difference of molecular mechanisms for drug effect (biological effect) of Abr NP and PTX on A549 from the proteomic aspect. The time point to study the drug effect was set at 24 h. Cell viability assay results indicated that cytotoxicity values were nearly the same at the 1 μM point. To study the cellular biological effect on the basis of the same living cells at the test time, this concentration was chosen in the quantitative proteomic analysis. In order to characterize the alterations in global protein expression of lung cancer cell proteome in response to contact with Abr and PTX, A549 cells were labeled and the proteins were quantified following standard SILAC operating procedures (Figure 2). Three biological replicate experiments were carried out. A total of 4,898 confident protein groups were identified with 71.4% (3,496 protein groups) being common among three replicates and 91% (4,463 protein groups) identified in at least two replicates (Figure 3A). High correlations of the ratios among replicates for the pairwise comparisons indicated that the quantitative data were repeatable and high quality (Figure 3B). By calculating the correlation between the three separate biological replicates, a mean correlation was obtained between measurements of 0.84. Histograms indicating the distribution of fold-changes (Log2[Abr/PTX] ratio) are shown in Figure 3C. The differential distribution was highly concentrated, which suggested that there was little overall change in the cells proteome. Proteins identified and quantified in each replicate experiment have been listed in Table S1. The three datasets were then combined and analyzed together using stringent and unified criteria which are available in MaxQuant. Student’s t-test was used to analyze every two sets of data, and an arbitrary cutoff of 2.0 fold and statistical significance of P<0.05 were used to define differentially expressed proteins. A list of quantified proteins in all three biological replicates containing the significantly differential protein values with a statistical P<0.05 (marked with “+”) can be found in Table S2.
 | Figure 2 Flowchart of SILAC coupled with LC–MS/MS for a comparative analysis of protein expression in A549 cells treated with PTX and Abr for 24 h. |
 | Figure 3 Proteomics reproducibility. |
It is noteworthy that only one protein was significantly regulated by comparing Abr with PTX treatment. Glucosamine 6-phosphate N-acetyltransferase 1 (GNPNAT1/GNA1) was the only downregulated protein in this study (ratio of the Abr group vs PTX group is 0.198±0.003). The expression of this protein was confirmed by Western blot analysis (Figure 4A and B). GNPNAT1/GNA1, a member of the GCN5-related N-acetyltransferase superfamily, is a key enzyme in the pathway toward biosynthesis of uridine diphosphate-N-acetylglucosamine (UDP-GlcNAc), an important donor substrate for N-linked glycosylation. The nucleotide sugar UDP-GlcNAc is an important metabolite in eukaryotic cells. It holds a key position in the N-linked glycosylation of protein, which impacts on diverse physiological and pathological processes, and in the generation of glycosylphosphatidylinositol linkers, which anchor the membrane protein to the cell.21 GNA1 catalyzes the formation of N-acetylglucosamine 6-phosphate from acetyl-CoA and the acceptor substrate GlcN6P.22 In Saccharomyces cerevisiae, GNA1 is required for multiple steps in the cell cycle, and its inactivation is lethal.23 Boehmelt G et al reported that murine embryos with a homozygous mutation in EMeg32, the human GNA1 ortholog, died with a general proliferative delay of development.24 Genes encoding GNA1 have been characterized in various eukaryotic organisms such as the murine gene EMeg32.25 It has been noted that EMeg32 was essential for embryonic development, while EMeg32-dependent UDP-GlcNAc levels influence cell cycle progression and susceptibility to apoptotic stimuli.26 This study reported that the deficiency of EMeg32 (EMeg32 mutant cells) could impair adhesiveness, proliferation, and actin depolymerization of mouse embryonic fibroblasts (MEFs). Here, GNA1 will still be used as the mammalian gene name and abbreviation of the related protein. Because Abr has only one component human serum ALB except PTX and the connecting form is not a covalent bond but the hydrophobic interaction,27 it needs to be known whether ALB alone can also have an influence on the expression level of GNA1. In addition, the reasons why Abr was shown to be more effective than PTX were mostly related to the unbound drug concentration of PTX. Therefore, the effect of higher amounts of PTX (2 and 4 fold of 1 M) is also tested on GNA1 expression. The results are shown in Figure 4C. It is interesting to note that GNA1 expression level was extremely downregulated by ALB. High concentration of PTX can also partly decrease GNA1, but only the highest one, 4× PTX group, was significantly different from the PTX group. The results indicated that the component ALB itself was involved in the upregulation of GNA1, not the ALB-bound particle formulation. And it is interesting that high amount of PTX also had little effect, but it was not significantly different at the P<0.05 level.
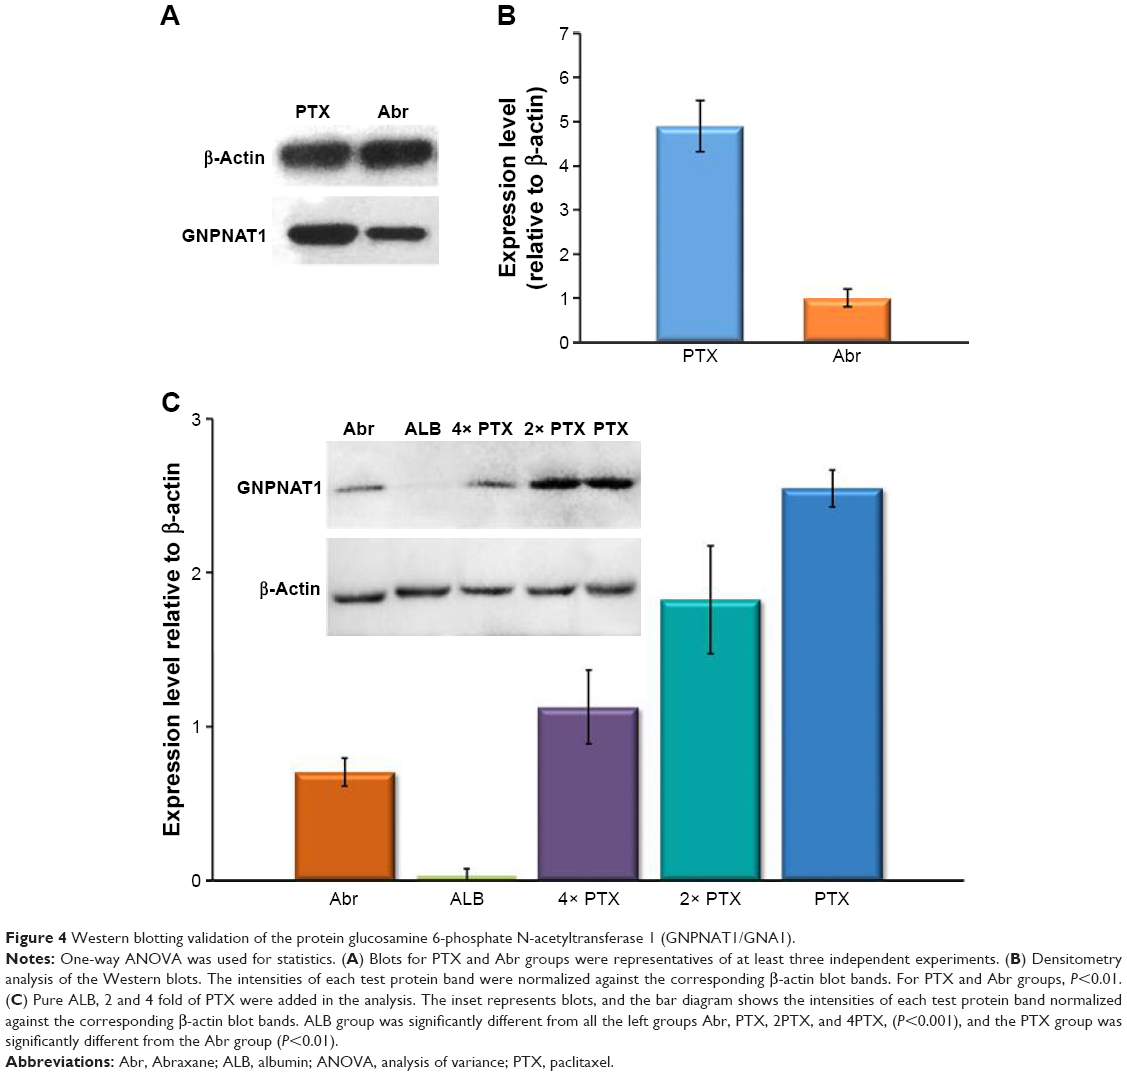 | Figure 4 Western blotting validation of the protein glucosamine 6-phosphate N-acetyltransferase 1 (GNPNAT1/GNA1). |
Lack of GNA1 influences cell adhesion and restoration of its function rescues the biological defect
It is reported that EMeg32-deficient MEFs also had a drastic defect in substratum adhesiveness, which correlated with the extent of intracellular UDP-GlcNAc reduction. It could be complemented by GlcNAc feeding with GlcNAc.26 In this study, GNA1 is downregulated in response to Abr compared with PTX. The substratum adhesion to culture dish responding to these two drugs is tested. Figure 5 showed that the number of adherent cells treated with Abr is significantly lower than PTX. This defect could be rescued by feeding with 10 mM GlcNAc. However, further addition of 10 mM GlcNAc did not induce a significant influence on the adhesion level of PTX. In that report, this gene was completely inhibited (EMeg32−/−).26 But in this study, this protein is relatively low in the Abr group, and the level of its expression is correlated to the performance is not known either. Cell adhesion defect may increase the risk of invasiveness of tumor cells.
 | Figure 5 Cell adhesion test. |
Actin depolymerization of A549 responds to Abr and PTX
The difference of cell adhesion may be correlated with cytoskeletal dynamics. And it is reported that GNA1 yeast mutants play some role in the regulation of actin dynamics.28,29 Thus, the study assessed the difference of actin dynamics of the treatment between these two drugs by utilizing latrunculin A. It prevents polymerization of actin through binding actin monomers.30 Then the depolymerization of existing actin bundles can be compared. By staining actin with Alexa Fluor 488-phalloidin, confocal microscopy analysis was performed to test actin depolymerization in both groups. Figure 6 shows a reduction in the number of actin bundles in A549 cells treated with PTX after a 30 min latrunculin A treatment. Cells treated with Abr showed a certain resistance to latrunculin A, which was manifested in the presence of visible actin bundles. The difference was not very obvious because the expression of GNA1 was not totally inhibited. However, the difference was still comparable (PTX group, 26%; Abr group, 38%). Cells with at least five intact actin bundles were counted as positive. At least 200 cells were evaluated per sample.
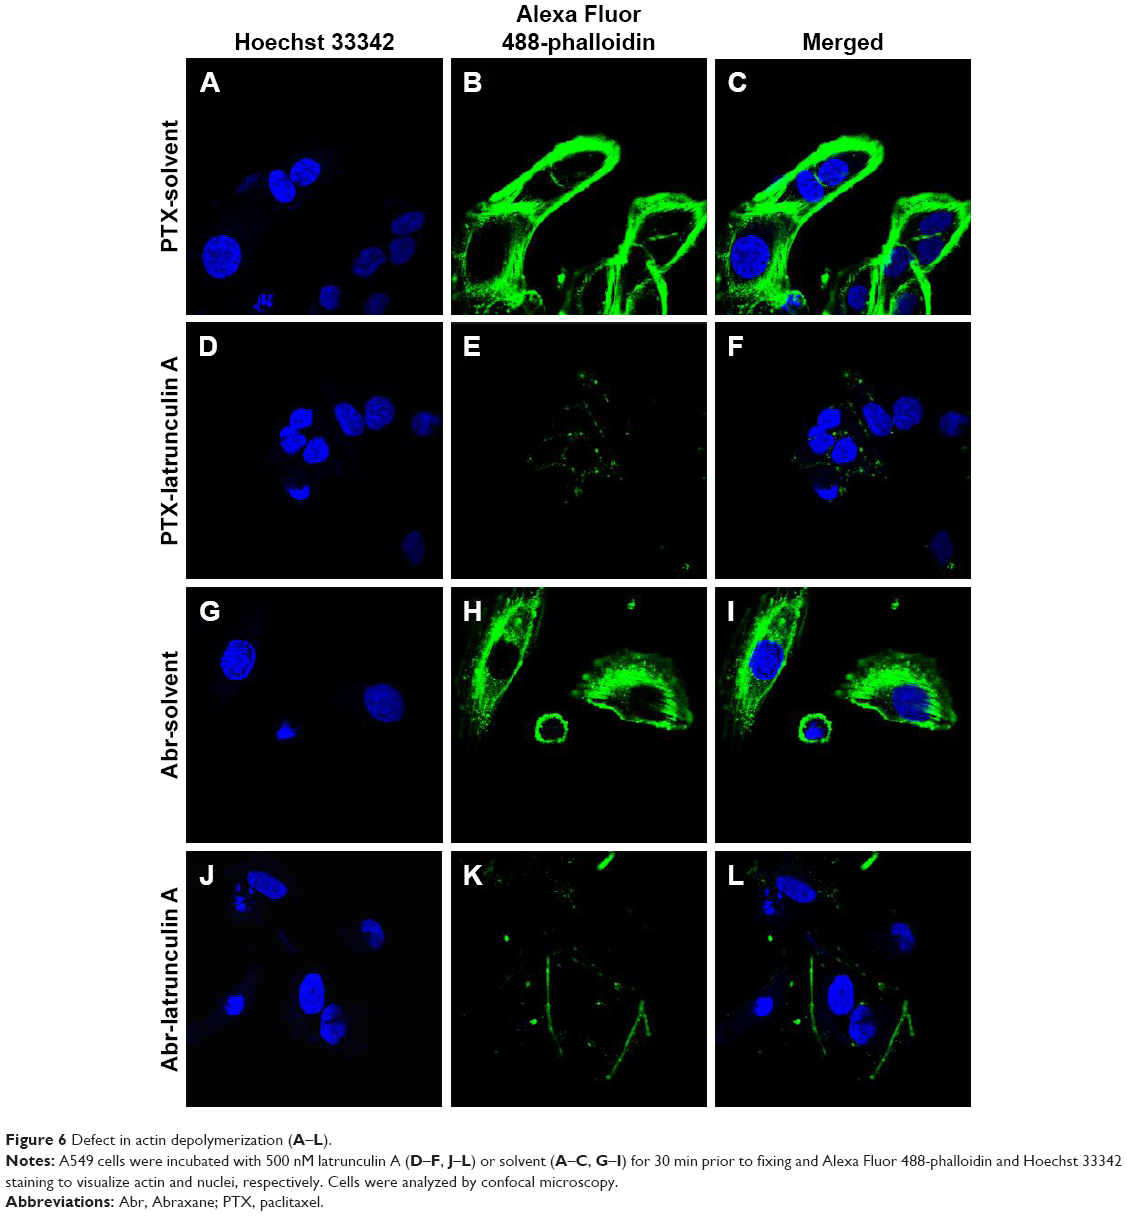 | Figure 6 Defect in actin depolymerization (A–L). |
Increased effect of Abr on A549 is due to impaired proliferation but not cell death
At 24 h, the cell viability in response to 1 μM of these two drugs is nearly the same. For the only protein that was significantly downregulated, the most obvious phenotype in vitro is impaired proliferation.26 More time duration is required to assess this phenotype because the proliferation doubling times are usually longer than 1 day. Moreover, addition of GlcNAc to GNA1 defective cells can rescue the growth defect if lower levels of this protein are the main reason.26 Thus, this study tests the proliferation rate of cells treated with the two drugs at 1, 3, and 5 days and also adds two groups containing pretreatment of 10 mM GlcNAc. The results in Figure 7 showed that more and more A549 cells were killed along with time in those drug containing groups and only GlcNAc had no important influence on cell proliferation. Abr induced a lower growth rate than PTX, and addition of GlcNAc could rescue this defect. Although the main effect of cell proliferation defect is the core component PTX, the downregulation of GNA1 may also play a role in the drug effect of Abr based on the same concentration of PTX between these two groups in the study. Most defects can be ascribed to an impairment in the synthesis of the nucleotide sugar UDP-GlcNAc, which presents in the lack of cytosolic O-glycosylation and lesser perturbation of Golgi-driven glycosylation.26 Moreover, impaired actin turnover could contribute to the growth suppression.
 | Figure 7 Cell proliferation of A549 treated with PTX, Abr, Abr + GlcNAc, and GlcNAc (*P<0.05; **P<0.001). |
Both increased apoptosis and decreased proliferation were found in EMeg32 deficient embryos.26 So apoptosis incidence was also investigated in A549 cells in response to these two drugs. Annexin V/propidium iodide (PI) staining was used for flow cytometry analysis (FACS) after 24 h of treatment. Both PTX and Abr showed increase in apoptosis over blank control, but there was no obvious difference between each other (Figure 8A–D). The necrosis rate was calculated, and the results were 3.85±0.21, 9.25±0.64, and 9.45±1.61 for control, PTX, and Abr groups, respectively. No statistical significance was reported for PTX and Abr. So the increased effect of Abr on A549 is due to impaired proliferation and not cell death. The Abr group expressed higher levels of active AKT than control cells as detected by anti-phospho-Ser473-AKT antibody and addition of 10 mM GlcNAc decreased phosphor-AKT (p-AKT) levels (Figure 8E). It is reported that GNA1 deficient cell lines could induce AKT activation and withstood apoptotic stimuli (apoptosis-inducing agents) better,26 and activation of AKT is reported to prevent proapoptotic pathways.31 However, no difference has been reported about apoptotic stimuli within these two treatments in this study. This indicated that apoptosis was not the main cause of the observed decrease in proliferation of Abr-treated cells. It has been suggested that activated AKT induces cell cycle progression.32 However, the increase in this kinase did not lead to increased proliferation. At G2–M phase of cell cycle, the accumulation of GNA1 protein could provide high levels of UDP-GlcNAc.24 Because of decreased cytosolic O-glycosylation in GNA1 deficient cells, downstream pathways usually mediating this function of AKT may be no longer operative. Since Golgi-mediated protein modifications are halted at this stage, while cytosolic O-glycosylation is still functional, reduced UDP-GlcNAc levels in GNA1 deficient cells could affect cell cycle-relevant protein modifications.26 Besides, this may be the difference between in vitro and in vivo, as well as the difference between cancer cells and embryonic cells.
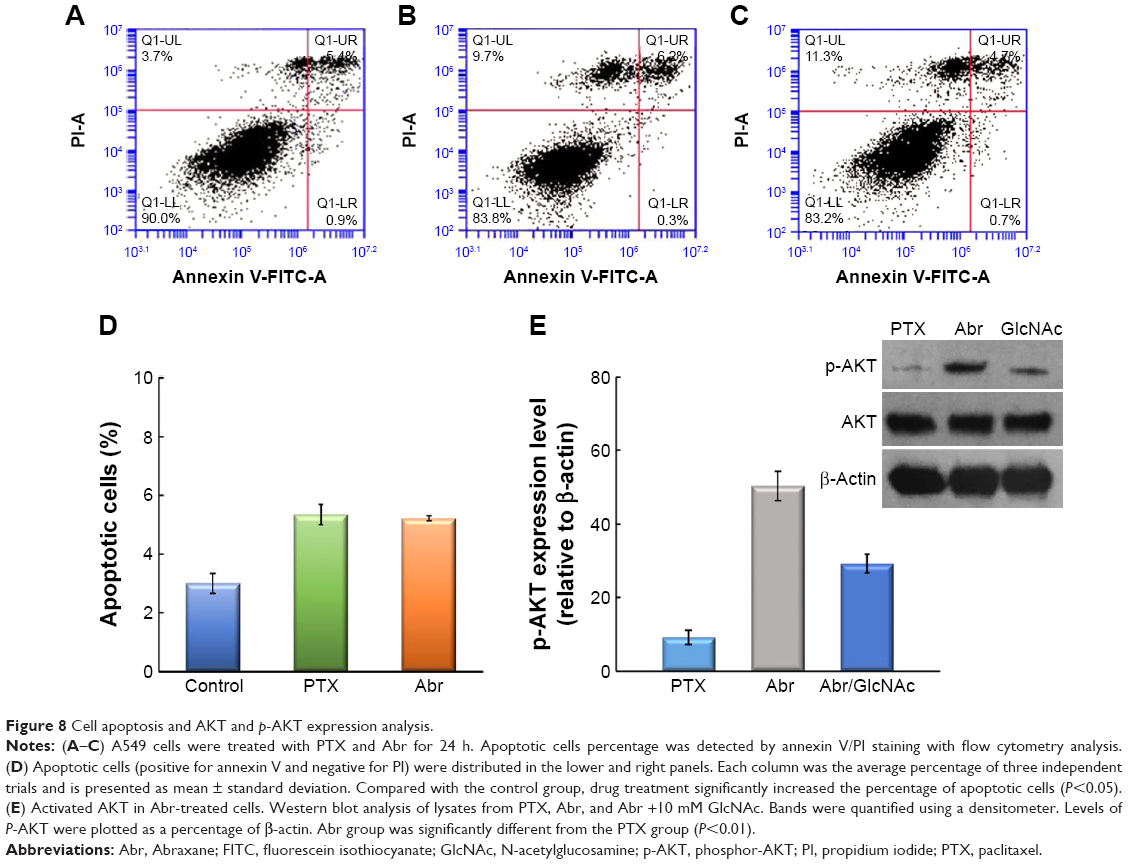 | Figure 8 Cell apoptosis and AKT and p-AKT expression analysis. |
An integrative analysis of transcriptomic and metabolomic data about prostate cancer cells indicated upregulation of GNA1 in organ-confined prostate cancer as compared to benign adjacent tissues as well as metastatic tissues. Stable knockdown of GNA1 in LNCap cells (androgen-dependent prostate cancer cells) leads to diminished cell growth. In contrast, they are not affected in androgen-independent C4-2 cells. Knockdown of GNA1 in C4-2 cells enhances invasiveness.33 These findings about cell growth arrest and enhanced cell invasiveness have some similarity to the present study, but nowadays research about either the biomolecule mechanism of better drug efficacy of Abr or further functional analysis of GNA1 is not enough. This analysis of GNA1 function could only gather information from the research carried out on mice because there were no human cases were reportedly available for analysis. The suppression of cell proliferation in A549 may mean a better drug efficacy of Abr for lung cancer. However, it has also been reported recently that GNA1 deficiency reduced insulin secretion at basal (2.8 mM) glucose levels,34 and this may increase type 2 diabetes risk.
Abr is a ALB-bound particle formulation of PTX, devoid of any solvent excipients. It was developed to avoid Cremophor/ethanol-associated toxicities in Cremophor-based (solvent-based) PTX (Taxol). There has been a randomized crossover pharmacokinetic study of solvent-based PTX and Abr.12 This study showed that the mean unbound drug concentration of PTX was considerably higher with Abr as compared to solvent-based PTX (6.3% vs 2.4%, P<0.001). Furthermore, coupled with the higher dose and shorter infusion time, a maximal concentration of unbound PTX ~10 fold higher was achieved. The systematic area under the concentration versus time curve was also nearly 3 fold higher. Abr has also been reported to have a higher plasma clearance and a larger volume of distribution than Taxol.14 Even for the direct drug effect on cells, transport of PTX across an endothelial cell monolayer increased 4.2 fold for Abr than Taxol.13 It was considered that the unbound fraction of PTX is the pharmacologically active form, because that drug bound to protein, or other (macro) molecules, is unable to cross cell membranes and interact with the active site.35 Then, Abr has been found to cross endothelial cell membranes and reach the tumor cell by enhanced permeability and retention effect,36 and transcytosis across the endothelial barrier is facilitated by its binding to the gp60 receptor and caveolar transport.37 In the tumor interstitial space, ALB–PTX complexes bind to the secreted protein acidic and rich in cysteine, which is overexpressed in a majority of tumors.37 Even so, systemic exposure to unbound PTX is still likely to be a driving force behind tumoral uptake,14 and unbound PTX concentrations might be still very important in antitumor activity. The existing drug effect improvement molecular mechanisms are all about increasing the amount of PTX concentration, and no further mechanism except PTX itself. In this study, it was found that Abr which has the same amount of PTX exhibits more effective drug effect than PTX through the downregulation of protein GNA1, leading to the decrease of cell proliferation. Although higher concentration of PTX had part of such an effect, ALB itself was the predominant reason of reduction of GNA1.
By quantitative proteomic analysis, this study found some subtle response of lung cancer cell A549 and explained how cellular level results were obtained from the molecular aspects. The scheme of the major biological effects induced by Abr is shown in Figure 9. The result indicated that the different biological effect between PTX and Abr in A549 cells mainly came from GNA1. However, other proteins may also have some influences, and the development of detection and analysis technologies may require more in-depth research in the future. Further investigations on molecular level research are needed for not only totally new drug but also new drug formulation, such as nano-drug. Globally studying the molecular mechanism will enable reasoning why a certain nano-drug has such good or bad performance, and it also helps in finding potential active function or security problems.
 | Figure 9 Scheme of biological effect and molecular mechanism of A549 cells by Abr compared with PTX. |
Conclusion
Abr has become the current gold standard for PTX delivery.38 More and more PTX-based NPs have been developed for the enhancement of drug efficacy and the elimination of toxicity. Before the occurrence of high-throughput technology, little was known about why it had better effect than PTX in the molecular biological mechanism aspect. Now it has become possible to understand the global protein expression pattern. By employing proteomic analysis, this study first found the mechanism of better efficacy of Abr compared with PTX was impaired cell proliferation induced by protein GNA1 with correlated functions such as adhesion and actin depolymerization defects. And ALB can regulate this protein independently and then result in more antitumor effects of Abr through additional mechanisms except aggregation of free PTX.
Acknowledgments
This work was supported by the National Natural Science Foundation of China (numbers 81500900, 31470049, 31270875, and 31400702), National High Technology Research and Development Program of China (2015AA020408), “Strategic Priority Research Program” of Chinese Academy of Sciences (XDA09040300), and Chinese Academy of Science (100 Talents Program of the Chinese Academy of Sciences: Y4362911ZX).
Disclosure
The authors report no conflicts of interest in this work.
References
Siegel R, Naishadham D, Jemal A. Cancer statistics, 2013. CA Cancer J Clin. 2013;63(1):11–30. | ||
Schiller JH, Harrington D, Belani CP, et al. Comparison of four chemotherapy regimens for advanced non-small-cell lung cancer. N Engl J Med. 2002;346(2):92–98. | ||
Chu Q, Vincent M, Logan D, Mackay JA, Evans WK. Taxanes as first-line therapy for advanced non-small cell lung cancer: a systematic review and practice guideline. Lung Cancer. 2005;50(3):355–374. | ||
Gelderblom H, Verweij J, Nooter K, Sparreboom A. Cremophor EL: the drawbacks and advantages of vehicle selection for drug formulation. Eur J Cancer. 2001;37(13):1590–1598. | ||
Van ZL, Verweij J, Sparreboom A. Role of formulation vehicles in taxane pharmacology. Invest New Drugs. 2001;19(2):125–141. | ||
Xu Q, Trissel LA, Martinez JF. Stability of paclitaxel in 5% dextrose injection or 0.9% sodium chloride injection at 4, 22, or 32 degrees C. Am J Hosp Pharm. 1995;51(24):3058–3060. | ||
Garber K. Improved Paclitaxel formulation hints at new chemotherapy approach. J Natl Cancer Inst. 2004;96(2):90–91. | ||
Alex S, Scripture CD, Vuong T, et al. Comparative preclinical and clinical pharmacokinetics of a cremophor-free, nanoparticle albumin-bound paclitaxel (ABI-007) and paclitaxel formulated in Cremophor (Taxol). Clin Cancer Res. 2005;11(11):4136–4143. | ||
Emerich DF, Thanos CG. The pinpoint promise of nanoparticle-based drug delivery and molecular diagnosis. Biomol Eng. 2006;23(4):171–184. | ||
Antohe F, Heltianu C, Simionescu M. Albumin-binding proteins of endothelial cells: immunocytochemical detection of the 18 kDa peptide. Eur J Cell Biol. 1991;56(1):34–42. | ||
Antohe F, Dobrila L, Heltianu C, Simionescu N, Simionescu M. Albumin-binding proteins function in the receptor-mediated binding and transcytosis of albumin across cultured endothelial cells. Eur J Cell Biol. 1993;60(2):268–275. | ||
Gardner ER, Dahut WL, Scripture CD, et al. Randomized crossover pharmacokinetic study of solvent-based paclitaxel and nab-paclitaxel. Clin Cancer Res. 2008;14(13):4200–4205. | ||
Desai N, Trieu V, Yao Z, et al. Increased antitumor activity, intratumor paclitaxel concentrations, and endothelial cell transport of cremophor-free, albumin-bound paclitaxel, ABI-007, compared with cremophor-based paclitaxel. Clin Cancer Res. 2006;12(4):1317–1324. | ||
Sparreboom A, Scripture CD, Trieu V, et al. Comparative preclinical and clinical pharmacokinetics of a cremophor-free, nanoparticle albumin-bound paclitaxel (ABI-007) and paclitaxel formulated in Cremophor (Taxol). Clin Cancer Res. 2005;11(11):4136–4143. | ||
Van TO, Huizing MT, Panday VR, Schellens JH, Nooijen WJ, Beijnen JH. Cremophor EL causes (pseudo-) non-linear pharmacokinetics of paclitaxel in patients. Br J Cancer. 1999;81(2):330–335. | ||
Sparreboom A, Zuylen LV, Brouwer E, et al. Cremophor EL-mediated alteration of paclitaxel distribution in human blood: clinical pharmacokinetic implications. Cancer Res. 1999;59(7):1454–1457. | ||
Minzhi Z, Haiyun L, Xiangli B, Chunni L, Qiaojun F, Zhiyuan H. Quantitative proteomic analysis of cellular resistance to the nanoparticle abraxane. ACS Nano. 2015;9(10):10099–10112. | ||
Liu C, Wu X, Luo C, et al. Abraxane, the nanoparticle formulation of paclitaxel can induce drug resistance by up-regulation of P-gp. PLoS One. 2015;10(7):e0131429. | ||
Cox J, Matic I, Hilger M, et al. A practical guide to the MaxQuant computational platform for SILAC-based quantitative proteomics. Nat Protoc. 2009;4(5):698–705. | ||
Qu G, Liu S, Zhang S, et al. Graphene oxide induces toll-like receptor 4 (TLR4)-dependent necrosis in macrophages. ACS Nano. 2013;7(7):5732–5745. | ||
Wang J, Zhou YF, Li LF, Liang YH, Su XD. Purification, crystallization and preliminary X-ray analysis of the glucosamine-6-phosphate N-acetyltransferase from human liver. Acta Crystall. 2006;62(62):1097–1099. | ||
Dennis JW. Glucosamine-6 Phosphate N-Acetyltransferase (GNPNAT1/GNA1). Japan: Springer; 2014. | ||
Mio T, Kokado M, Arisawa M, Yamada-Okabe H. Reduced virulence of Candida albicans mutants lacking the GNA1 gene encoding glucosamine-6-phosphate acetyltransferase. Microbiology. 2000;146( Pt 7)(7):1753–1758. | ||
Boehmelt G, Fialka I, Brothers G, et al. Cloning and characterization of the murine glucosamine-6-phosphate acetyltransferase EMeg32. Differential expression and intracellular membrane association. J Biol Chem. 2000;275(17):12821–12832. | ||
Mio T, Yamada-Okabe T, Arisawa M, Yamada-Okabe H. Saccharomyces cerevisiae GNA1, an essential gene encoding a novel acetyltransferase involved in UDP-N-acetylglucosamine synthesis. J Biol Chem. 1999;274(1):424–429. | ||
Boehmelt G, Wakeham A, Elia A, et al. Decreased UDP-GlcNAc levels abrogate proliferation control in EMeg32-deficient cells. EMBO J. 2000;19(19):5092–5104. | ||
Chen Q, Liu Z. Albumin carriers for cancer theranostics: a conventional platform with new promise. Adv Mater. 2016;28(47):10557–10566. | ||
Lin R, Allis CD, Elledge SJ. PAT1, an evolutionarily conserved acetyltransferase homologue, is required for multiple steps in the cell cycle. Genes Cells. 1996;1(10):923–942. | ||
Cleves AE, Novick PJ, Bankaitis VA. Mutations in the SAC1 gene suppress defects in yeast Golgi and yeast actin function. J Cell Biol. 1989;109(1):2939–2950. | ||
Ayscough K. Use of latrunculin-A, an actin monomer-binding drug. Methods Enzymol. 1998;298(98):18–25. | ||
Datta SR, Brunet A, Greenberg ME. Cellular survival: a play in three Akts. Genes Dev. 1999;13(22):2905–2927. | ||
Brennan P, Babbage JW, Burgering B. Phosphatidylinositol 3-kinase couples the interleukin-2 receptor to the cell cycle regulator E2F. Immunity. 1997;7(5):679–689. | ||
Panzitt K, Shojaie A, Putluri N, et al. Abstract 5387: integrative analysis of transcriptomic and metabolomic data reveals a critical role for aminosugar metabolism in prostate cancer. Cancer Res. 2013;73(8 Suppl):5387. | ||
Bacos K, Gillberg L, Volkov P, et al. Blood-based biomarkers of age-associated epigenetic changes in human islets associate with insulin secretion and diabetes. Nat Commun. 2016;7:11089. | ||
Brouwer E, Verweij J, De BP, et al. Measurement of fraction unbound paclitaxel in human plasma. Drug Metabol Dispos. 2000;28(10):1141–1145. | ||
Matsumura Y, Maeda H. A new concept for macromolecular therapeutics in cancer chemotherapy: mechanism of tumoritropic accumulation of proteins and the antitumor agent smancs. Cancer Res. 1986;46(46):6387–6392. | ||
Wei C, Liu N, Xu P, et al. From bench to bedside: successful translational nanomedicine: highlights of the Third Annual Meeting of the American Academy of Nanomedicine. Nanomed Nanotechnol Biol Med. 2007;3(4):322–331. | ||
Bhattacharyya J, Bellucci JJ, Weitzhandler I, et al. A paclitaxel-loaded recombinant polypeptide nanoparticle outperforms Abraxane in multiple murine cancer models. Nat Commun. 2015;6(Suppl 1–2):337–345. |
 © 2017 The Author(s). This work is published and licensed by Dove Medical Press Limited. The
full terms of this license are available at https://www.dovepress.com/terms
and incorporate the Creative Commons Attribution
- Non Commercial (unported, 3.0) License.
By accessing the work you hereby accept the Terms. Non-commercial uses of the work are permitted
without any further permission from Dove Medical Press Limited, provided the work is properly
attributed. For permission for commercial use of this work, please see paragraphs 4.2 and 5 of our Terms.
© 2017 The Author(s). This work is published and licensed by Dove Medical Press Limited. The
full terms of this license are available at https://www.dovepress.com/terms
and incorporate the Creative Commons Attribution
- Non Commercial (unported, 3.0) License.
By accessing the work you hereby accept the Terms. Non-commercial uses of the work are permitted
without any further permission from Dove Medical Press Limited, provided the work is properly
attributed. For permission for commercial use of this work, please see paragraphs 4.2 and 5 of our Terms.