Back to Journals » International Journal of Nanomedicine » Volume 13
Multispectral optoacoustic tomography (MSOT) for imaging the particle size-dependent intratumoral distribution of polymeric micelles
Authors Cong ZQ, Yang FF, Cao L, Wen H, Fu TT, Ma SQ, Liu CY, Quan LH, Liao YH ![]()
Received 30 August 2018
Accepted for publication 27 November 2018
Published 12 December 2018 Volume 2018:13 Pages 8549—8560
DOI https://doi.org/10.2147/IJN.S185726
Checked for plagiarism Yes
Review by Single anonymous peer review
Peer reviewer comments 2
Editor who approved publication: Dr Linlin Sun
Zhaoqing Cong, Feifei Yang, Li Cao, Han Wen, Taotao Fu, Siqi Ma, Chunyu Liu, Lihui Quan, Yonghong Liao
Key Laboratory of Bioactive Substances and Resources Utilization of Chinese Herbal Medicine, Institute of Medicinal Plant Development, Chinese Academy of Medical Sciences and Peking Union Medical College, Haidian District, Beijing 100193, People’s Republic of China
Purpose: This study proposes the utilization of multispectral optoacoustic tomography (MSOT) to investigate the intratumoral distribution of polymeric micelles and effect of size on the biodistribution and antitumor efficacy (ATE).
Materials and methods: Docetaxel and/or optoacoustic agent-loaded polymeric micelles (with diameters of 22, 48, and 124 nm) were prepared using amphiphilic block copolymers poly (ethylene glycol) methyl ether-block-poly (D,L lactide) (PEG2000–PDLLAx). Subcutaneous 4T1 tumor-bearing mice were monitored with MSOT imaging and IVIS® Spectrum in vivo live imaging after tail vein injection of micelles. The in vivo results and ex vivo confocal imaging results were then compared. Next, ATE of the three micelles was found and compared.
Results: We found that MSOT imaging offers spatiotemporal and quantitative information on intratumoral distribution of micelles in living animals. All the polymeric micelles rapidly extravasated into tumor site after intravenous injection, but only the 22-nm micelle preferred to distribute into the inner tumor tissues, leading to a superior ATE than that of 48- and 124-nm micelles.
Conclusion: This study demonstrated that MSOT is theranostically a powerful imaging modality, offering quantitative information on size-dependent spatiotemporal distribution patterns after the extravasation of nanomedicine from tumor blood vessels.
Keywords: multispectral optoacoustic tomography, MSOT, polymeric micelle, in vivo imaging, intratumoral distribution, particle size, tumor model
Introduction
The use of long-circulating polymeric micelles is a promising strategy to target tumors in systemic cancer treatment.1 Antineoplastic small molecules, such as paclitaxel (Genexol-PM), are often delivered by these surface-modified nanoscale vesicles.2,3 Despite extensive studies, which have demonstrated that micelles preferentially accumulate in solid tumors with a leaky vascular bed through the enhanced permeability and retention (EPR) effect,4 it is demanding to find a noninvasive imaging technology to measure the intratumoral distribution.5 Currently, there are many modalities available for the visualization of micelles in vivo; each has its own advantages and drawbacks. Magnetic resonance imaging (MRI) and X-ray-based computed tomography (CT) afford high spatial resolution, but confer low molecular specificity.6 In addition, fluorescence molecular tomography and positron emission tomography have been used as molecular imaging modalities with higher sensitivity compared with MRI and CT,7,8 but they have limited spatial resolution. Moreover, intravital microscopy has high resolution and molecular specificity, yet it requires invasive procedures and has shallow tissue penetration.9,10 Considering the advantages of operational simplicity, high sensitivity, and low cost, optical imaging techniques are regarded as more favored imaging methods applicable to preclinical and clinical use. Although the practice of the ultraviolet (UV) absorbing molecular probes in live tissues has some significant drawbacks, such as high levels of light extinction and tissue autofluorescence,11,12 near-infrared (NIR) absorption and emission fluorescent probes favor deep tissue bioimaging applications.12,13 In addition, NIR fluorescent probe can be used for both photothermal and photodynamic therapies for cancer treatment.14,15 Nonetheless, NIR fluorescence imaging can achieve high penetration depth, yet they often confer low spatial resolution.16
Multispectral optoacoustic tomography (MSOT) is a noninvasive imaging method based on photoacoustic effect. This method involves image reconstruction from ultrasound waves that are generated due to the thermoelastic extension of molecules on selective photon absorption.17 Compared with conventional optical imaging, MSOT has shown promising results in higher spatial resolution (~150 μm) and a deep penetration depth (>5 cm).18 The fluorochromes incorporated in micelles exhibit sound NIR absorption and hence are expected to permit deep tissue visualization in vivo.19–21
Polymeric micelles can circulate for a prolonged time and accumulate in tumor tissues through EPR effect.22 Yet, micellar vesicles are likely to face difficulties in penetrating tumors in a particle size-dependent manner, and the effect of tumor interstitium on the intratumoral distribution of micelles remains unclear.23–25 In this study, we used different amphiphilic copolymers (PEG2000–PDLLAx) to control particle sizes ranging from 22 to 124 nm. Subsequently, the intratumoral distribution behaviors of micelles after tail vein injection were evaluated using MSOT imaging with a view to investigate how polymeric micelles’ size affects intratumoral distribution and antitumor efficacy (ATE).
Materials and methods
Materials
Docetaxel (DTX) was purchased from HVSF United Chemical Materials Co., Ltd. (Beijing, People’s Republic of China). 1,1′-Dioctadecyl-3,3,3′,3′-tetramethylindotricarbocyanine iodide (DiR) and coumarin 6 were purchased from AAT Bioquest (Sunnyvale, CA, USA) and Sigma-Aldrich Co. (St Louis, MO, USA). PEG2000–PDLLA2000 (polydispersity index [PDI] <1.8), PEG2000–PDLLA5000 (PDI <1.8), and PEG2000–PDLLA8000 (PDI <1.8) were purchased from Daigang Biomaterial Co., Ltd. (Jinan, People’s Republic of China). Water was purified by a Milli-Q water purification system (EMD Millipore, Billerica, MA, USA). All other chemicals and reagents were of analytical grade.
Preparation of micelles and characterization
DTX-loaded mPEG–PDLLA micelles were spontaneously formed by a solid dispersion technique.26 In brief, mPEG–PDLLA (30 mg) and DTX (6 mg) were mixed in 5 mL of dichloromethane. The solution was then stirred for 5 minutes, and after that, dichloromethane was removed with reduced pressure at 25°C to acquire a thin DTX/copolymer film. The remaining dichloromethane was completely removed by further drying in a vacuum dryer for 12 hours. To obtain a micellar dispersion, 5 mL of water at 30°C was added to the thin film and stirred for 5 minutes. The transparent dispersion was then filtered through a 0.22-μm filter (Tianjin Branch Billion Lung Experimental Equipment, Tianjin, People’s Republic of China). To prepare micelles with different particle sizes, three mPEG–PDLLA micelles, namely mPEG2000–PDLLA2000, mPEG2000–PDLLA5000, and mPEG2000–PDLLA8000, were utilized for the preparation of DTX-loaded polymeric micelles. Empty and DTX/DiR/coumarin 6-loaded mPEG–PDLLA micelles were made following the similar protocol.
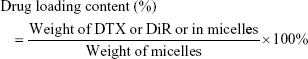
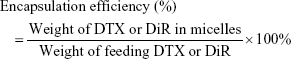
UV–visible (Vis) absorption spectra of DiR and coumarin-loaded micelles were studied by Cary 100 UV-Vis (Agilent Technologies, Santa Clara, CA, USA) to confirm the synthesis of micelles. To determine the particle size characteristics of different micelles, the micelles were mixed with ultrapure water and analyzed by Malvern Instruments Zetasizer Nano-S (Malvern, UK). To study the stability of the micelles, the size of the micelles was analyzed at time points of Days 1, 3, 7, 10, 14, and 21. All of the analyses were triplicated. The morphology of micelles was observed by JEM-2100F transmission electron microscope (TEM; JEOL, Tokyo, Japan) with 80 kV acceleration. The TEM samples were prepared by dropping aqueous micellar dispersion on copper grids and dried under room temperature. The encapsulation efficiency of DTX or DiR was determined by high-performance liquid chromatography (HPLC) or fluorescent method. First, the micellar suspension was diluted with acetonitrile to disrupt the DiR and DTX-loaded micellar structure. The concentration of DTX was assessed by the HPLC method, whereas the determination of DiR was carried out using a fluorescent assay. The drug loading content and encapsulation efficiency were calculated as follows:
|
|
A dialysis method was applied to study the fluorescent probes and DTX release from micelles. To achieve sink conditions and improve the stability of DiR and DTX, the release medium consisted of PBS solution (0.01 M, pH 7.4) and Tween 80 (0.5%). An aliquot of 1 mL of DiR and DTX-loaded micellar dispersion was added into a dialysis tube with a molecular weight cutoff of 8,000 Da (SnakeSkin™; Thermo Scientific, Waltham, MA, USA). Then, 100 mL of release medium was added as the receiving medium. The dialysis tube was then put in a water bath (37°C) and under continuous magnetic stirring at 100 rpm. At predetermined time points (eg, 20 minutes, 30 minutes, 1 hour, 3 hours, 5 hours, 8 hours, and 12 hours), 1 mL of the medium from the receiving phase was withdrawn by a pipette, mixed with acetonitrile for fluorescence study, and 1 mL fresh medium was added. The release test of each formulation was triplicated.
Animal models for imaging and pharmacodynamics studies
Female Balb/c mice with a weight of 18–20 g were bought from Vital River Laboratory Animal Technology Co., Ltd. (Beijing, People’s Republic of China). All of the mice were accommodated at specific pathogen-free animal rooms with humidity control and air temperature at 23°C ± 2°C. Mice had free access to food and water. The animal study was approved by the Animal Ethics Committee at the Institute of Medicinal Plant Development, Chinese Academy of Medical Sciences, which comply with “Laboratory Animal-Guideline for Ethical Review of Animal Welfare” issued by the General Administration of Quality Supervision, Inspection and Quarantine of the People’s Republic of China and the Standardization Administration of the People’s Republic of China.
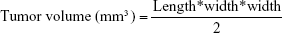
A xenografted 4T1 breast cancer model was employed in this study. The 4T1 cell suspensions at a density of 8×10⁵ in 50 μL of 1,640 medium were inoculated subcutaneously to the right side of the back. Tumor length and width were measured using a clipper, and tumor volume was calculated using the following formulation.
|
The imaging study was performed till tumor volume reached about 110 mm3.
MSOT
DiR was chosen as an optoacoustic agent and encapsulated in PEG2000–PELLAx micelles because it has satisfactory photostability for continuous excitation,27 and it is the most frequently used NIR fluorescent dye for in vivo NIR living imaging.28 The in vivo real-time MSOT imaging was carried out on a commercial MSOT InVision 256-TF tomography system (iThera Medical GmbH, München, Germany). The experimental MSOT setup has been detailed previously.29,30 Briefly, a tunable laser with pulses at 10 Hz and wavelengths between 680 and 900 nm was used for illumination. After the laser gave the illumination, the optoacoustic signals, which were produced by the optoacoustic probe (DiR)’s absorption of laser energy, were detected by a 256-element, toroidal, and ring-shaped detector. The detector was set to cover the sample over an angle of 270°, allowing for cross-sectional tomographic imaging.
The animals were given anesthesia with 1.8% isoflurane in oxygen and enfolded with polyethylene film to keep free from water. After tail vein injection of 200 μL micelles (~40 μg of DiR), multispectral images were monitored to 24 hours from the tumor site to liver region using seven wavelengths at 690, 720, 750, 790, 820, 850, and 900 nm and 20 pulses per wavelength. To study the quantitative information of the whole tumor tissue or different slices, data of whole tumor tissue within a three-dimensional image and of central or border tumor tissue within a two-dimensional image were analyzed.30
NIR fluorescence imaging (in vivo imaging system [IVIS])
To compare the signals obtained from MSOT, the mice scanned by MSOT were also monitored by IVIS® Spectrum in vivo living imaging system (Caliper Life Sciences, Hopkinton, MA, USA) at 5 minutes, 1 hour, 5 hours, and 24 hours. Whole-body IVIS was studied on animals under anesthesia (2% isoflurane). Living Image software (Version 4.2) was used for image analysis.
Ex vivo fluorescence imaging
To validate the MSOT data, fluorescence cryosectioning imaging was achieved ex vivo using DeltaVision ultra-high-resolution microscope (GE Healthcare Life Sciences, Marlborough, MA, USA). Briefly, after the animals performed in vivo imaging, they were treated by overdose Ketamine and then frozen to −80°C. After embedding the tumor-xenografted mice in optimal cutting temperature (Sakura Finetek Europe, Zoeterwoude, the Netherlands) media, a Leica Cryostat (Leica CM1900; Leica Biosystems, Heidelberg, Germany) was used to cut the tissue into 5 μm. Tumors were sliced along the coronal plane to better serve the live imaging results. Representative images were obtained by DeltaVision ultra-high-resolution microscope to confirm the existence of DiR in the different parts.
In vivo antitumor study
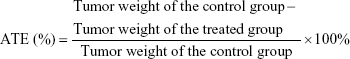
Around 10 days after the neoplasm inoculation of the 4T1 cells into the animal’s right flank, the tumors had reached a palpable volume of 110 mm3 in average, the mice were chosen and randomized into four treated and one control groups, and treatments were then started. Four treated groups were administrated via tail vein with DTX suspension (formulated in 50% Cremophor EL and 50% ethanol, w/w) or with DTX-loaded mPEG2000–PDLLA2000, DTX-loaded mPEG2000–PDLLA5000, or DTX-loaded mPEG2000–PDLLA8000 micelles. The intravenous bolus doses of DTX were maintained at 5 mg/kg every other day for three times. At the same time, saline was administrated to the PBS control group. Five days after the final injection, 200 μL blood was collected. Serum was obtained by whole blood centrifugation at 3,000 rpm for 10 minutes. Using a biochemical autoanalyzer, serum biochemical analysis was carried out to determine the serum level of total bilirubin (TBIL) and alkaline phosphatase to evaluate liver function. Nephrotoxicity was assessed by the determination of the levels of uric acid (URIC), urea nitrogen (UREA), and creatinine. The efficacy experiments were triplicated (n=24 in total for each group). The volume of the tumor was recorded every other day, and the weight of the tumor was measured after mice sacrifice. ATE was defined and calculated as follows:
|
Data analysis
All values were expressed as mean ± SD. SPSS Version 17.0 was used for the statistical analyses. Two-tailed, unpaired Student’s t-test or factorial analysis of variance (ANOVA) was applied when processing the data.31 If the ANOVA showed a significant difference, post hoc comparisons were then used with the Student–Newman–Keuls or Dunnett’s tests. A P-value ≤0.05 was taken to indicate the statistical significance.
Results and discussion
Preparation and characterization of polymeric micelles
Three different kinds of micelles were prepared using a solid dispersion method. The UV-Vis absorption spectra were evaluated to investigate the interaction of DTX with amphiphilic copolymers. The UV-Vis absorption spectra of free DiR, free coumarin 6, and free DTX are quite similar to the spectra of the DiR micelle, coumarin 6 micelle, and DTX micelle (Figure S1). The results revealed a minor change in the wavelength and a decrease in absorbance intensity. Figure 1A–C shows the particle size distribution of micelles assembled by mPEG2000–PDLLA2000, mPEG2000–PDLLA5000, and mPEG2000–PDLLA8000, respectively. The particle size of micelles gradually increased with increasing proportion of hydrophobic segments. While the size of mPEG2000–PDLLA2000 micelle was ~22 nm, the sizes of mPEG2000–PDLLA5000 and mPEG2000–PDLLA8000 micelles increased to ~48 and ~124 nm, respectively. The particle size and morphology were also confirmed by TEM images, which showed the spherical structure of micelles (Figure S2A–C). In addition, the micellar structure appeared to be stable over 3 weeks in terms of particle size (Figure S2D). Figure 1G showed that all micelles exhibited relatively narrow distribution with a PDI varying from 0.042 to 0.240, and DTX loading capacity of polymer micelles slightly decreased when increasing the proportion of hydrophobic segments. The in vitro release results (Figure 1D–F) indicated that DiR and coumarin 6 had similar release profiles to those of DTX, suggesting that the DiR signal given by MSOT or the coumarin 6 signal of ex vivo confocal imaging can represent the presence of DTX.
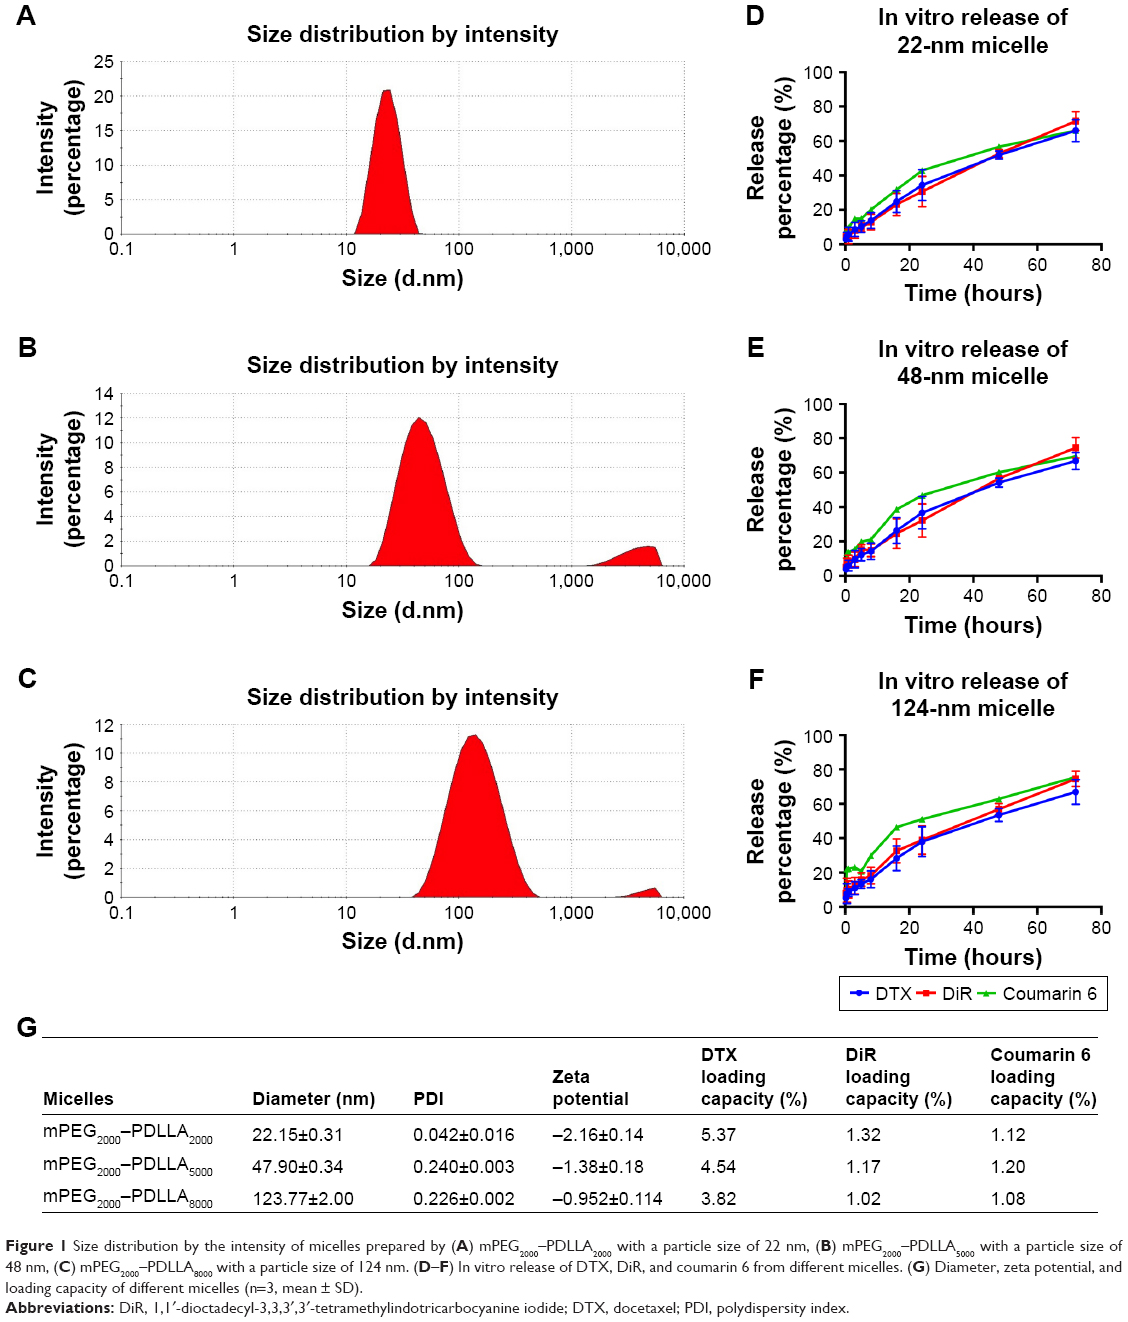 | Figure 1 Size distribution by the intensity of micelles prepared by (A) mPEG2000–PDLLA2000 with a particle size of 22 nm, (B) mPEG2000–PDLLA5000 with a particle size of 48 nm, (C) mPEG2000–PDLLA8000 with a particle size of 124 nm. (D–F) In vitro release of DTX, DiR, and coumarin 6 from different micelles. (G) Diameter, zeta potential, and loading capacity of different micelles (n=3, mean ± SD). |
Verification of MSOT imaging for tumor distribution
In this study, the distribution profile of DiR/coumarin 6 micelle in tumor tissues was investigated following intravenous (tail vein) administration to Balb/c female mice using MSOT (Figure 2A) and IVIS (Figure 2B) imaging systems. The MSOT findings appeared to well support the tumor imaging results from IVIS. Both representative MSOT and IVIS images showed that micelles accumulated in tumor site as revealed by signal intensity postinjection (Figure 2A and B). Strong signal intensities were acquired 3.5 hours after administration. The emitted signals in tumor tissues reached a maximum value at 7 hours and then decreased at 9 hours. MSOT was previously used not only to elucidate the distribution of liposomal indocyanine green (ICG) in tissues30 but also to monitor the clearance rate of ICG from the circulation and its time-resolved uptake in the liver and gallbladder in mice with a high temporal resolution.32 These earlier studies have illustrated the superiority of MSOT over IVIS in terms of the coherence with the ex vivo validation studies.
 | Figure 2 The biodistribution of DiR/coumarin 6-loaded mPEG2000–PDLLA5000 micelle (48 nm) in tumor tissue in a 4T1 tumor-bearing mice. |
Apart from offering signal intensity, MSOT, as a high-resolution imaging method, also revealed that the biodistribution of micelles in tumors is not homogeneous as shown in Figure 2A(a–d), and the heterogeneous distribution appeared to be in a temporally dependent manner. To verify the in vivo data, the mice were euthanized after MSOT imaging, and the tissues were removed and frozen for cryosectioning. The ex vivo fluorescence images showed increasing fluorescence intensity of coumarin 6 from the center to the border of the tumor (Figure 2C(i–l)), which were well consistent with the MSOT image (Figure 2C(m)). The observed tissue distribution data by fluorescence microscopy, albeit not quantitative, were in agreement with MSOT imaging results, which proved the reliability of the MSOT imaging method.
MSOT imaging intratumoral distribution
Large macromolecules and nanoparticles can extravasate from blood vessels near tumor and assemble within the tumor tissue due to the EPR effect.33,34 As far as nanocarriers are concerned, the degree of EPR is dependent on the carrier size and a decreased size generally enhances the deposition and accumulation of the carriers within the tumor mass,35,36 albeit mixed results were documented in the literature.22 In this study, the tumor accumulation and intratumoral distribution of polymeric micelles after intravenous injection were analyzed using MSOT imaging, which indicated that the accumulation of micelles was affected by particle size (Figure 3D). The MSOT signal intensity demonstrated that the three different micelles were ready to extravasate and accumulate in the tumor tissues (Figure 3A–C). The signal intensities of both 22- and 48-nm micelles remained constant within 7 hours, whereas that of 124 nm appeared to increase gradually (Figure 3E). Consistent with the previous findings,37,38 the 22-nm micelle resulted in higher tumor accumulation than either 48- or 124-nm micelle.
 | Figure 3 Optoacoustic analysis of the intratumoral distribution of polymeric micelles after intravenous injection. |
In this study, MSOT imaging conferred not only a quantitative analysis of tumor accumulation but also a spatiotemporal and quantitative analysis of the intratumoral distribution. Previous studies in tissue penetration of nanocarriers in a living animal were mostly based on the in vivo confocal laser scanning microscopy (CLSM) technique,38 which enables to determine the penetrating ability of nanocarriers through tumor interstitium in microscale around blood vessels, suggesting that a size threshold for tumor penetration with a nanoparticle of 10–40 nm but not ≥50 nm would facilitate the accumulation in the interior of tumor tissues.22,35,36,38,39 However, CLSM was unable to reveal the spatial distribution characteristics within the whole tumors. In contrast, MSOT imaging could provide a three-dimensional distribution profile of micelles in tumor tissues in a spatiotemporal manner with a reasonable spatial resolution. To simplify the analysis of distribution profiles of micelles in tumor tissues, MSOT imaging in the central and border parts of tumor tissues was used to indicate spatial distribution characteristics. Figure 3A–C shows the typical tumor central and border images of different micelles at 0.1 and 5 hours postinjection. The results showed that the MSOT signal intensity of 22-nm micelle in the tumor central part decreased from 0.1 to 5 hours, whereas that of the border part increased remarkably from 0.1 to 5 hours. In addition, the intensities of 48-nm micelle in both central and border parts remained unchanged, whereas those of 124-nm micelles increased in both parts. Figure 3E shows the intensity ratios between tumor central and border parts as a function of time. The results showed that the 22-nm micelle initially distributed more in the central tumor region with a peak central-to-border ratio of ~3.5, whereas the 48- and 124-nm micelles tended to deposit less in the central tumor region with the center to border ratios of around 1.7 and 1.4, respectively. These data indicated that particle size affected the initial extravasation and spatial distribution of polymeric micelles within tumor tissues immediately after injection, and the 22-nm micelle conferred higher availability of the drug to the inner tumor tissues than either 48- or 124-nm micelle.
In vivo antitumor study
A dose-dependent cytotoxicity of DTX-loaded micelles with different sizes was evaluated by 3-(4,5-dimethylthiazol-2-yl)-2,5-diphenyltetrazolium bromide (MTT) assay in 4T1 cell line (Figure S3). All of the three micelles were more potent than free DTX. To determine whether DTX-loaded micelles result in renal and liver toxicity, we determined the concentrations of UREA, URIC, and TBIL in blood. A detailed analysis result of these biochemical parameters in the mice serum treated with different size micelles as compared with free DTX and PBS showed no statistically significant differences (Figure S4).
The in vivo ATE of different sizes of polymeric micelles was examined in a xenograft 4T1 breast cancer model (Figure 4). Changes in body weight are often utilized to evaluate the toxicity (Figure 4C).40,41 Our results showed that, compared with PBS group, the body weights of the mice decreased slowly over time in the DTX and micelle groups, which indicate that there were no significant differences among the DTX and micelle groups (ANOVA, P>0.05). Mice treated with free drug or micelles showed a great (ANOVA, P<0.05) decrease in tumor volume 4 days after the first treatment compared with the PBS group (Figure 4B). However, there was no significant difference among the three micelle groups. 4T1 tumors are of high vascular permeability,42 and the present data in Figure 4B were consistent with the previous findings that polymer micelles inhibited the volume growth of highly permeable, but not poorly permeable tumors in mice independent of particle size.38 Nonetheless, when the tumor weight rather than tumor volume was used to calculate the tumor inhibition rate, the present study found that there was a significant difference in ATE among the three micelle groups (Figure 4D). The group treated with 22-nm micelle gave 65.05% of inhibition, significantly higher than 42.88% of 48-nm group or 52.25% of 124-nm group. In vivo ATE is not only the matter of the high drug concentration in tumor tissues but also has a great relationship with the drug interaction with tumor cells, which may be influencing uptake efficiency, intracellular localization, and cytotoxicity.43 For example, micelle size may affect the uptake efficiency, and a size-dependent uptake in different cell lines has been studied, with the maximum cellular uptake at a micelle core size ranging from 30 to 50 nm.44–46 Therefore, high drug concentration and better uptake efficiency can explain why the group treated with 22-nm micelle had a higher antitumor effect.
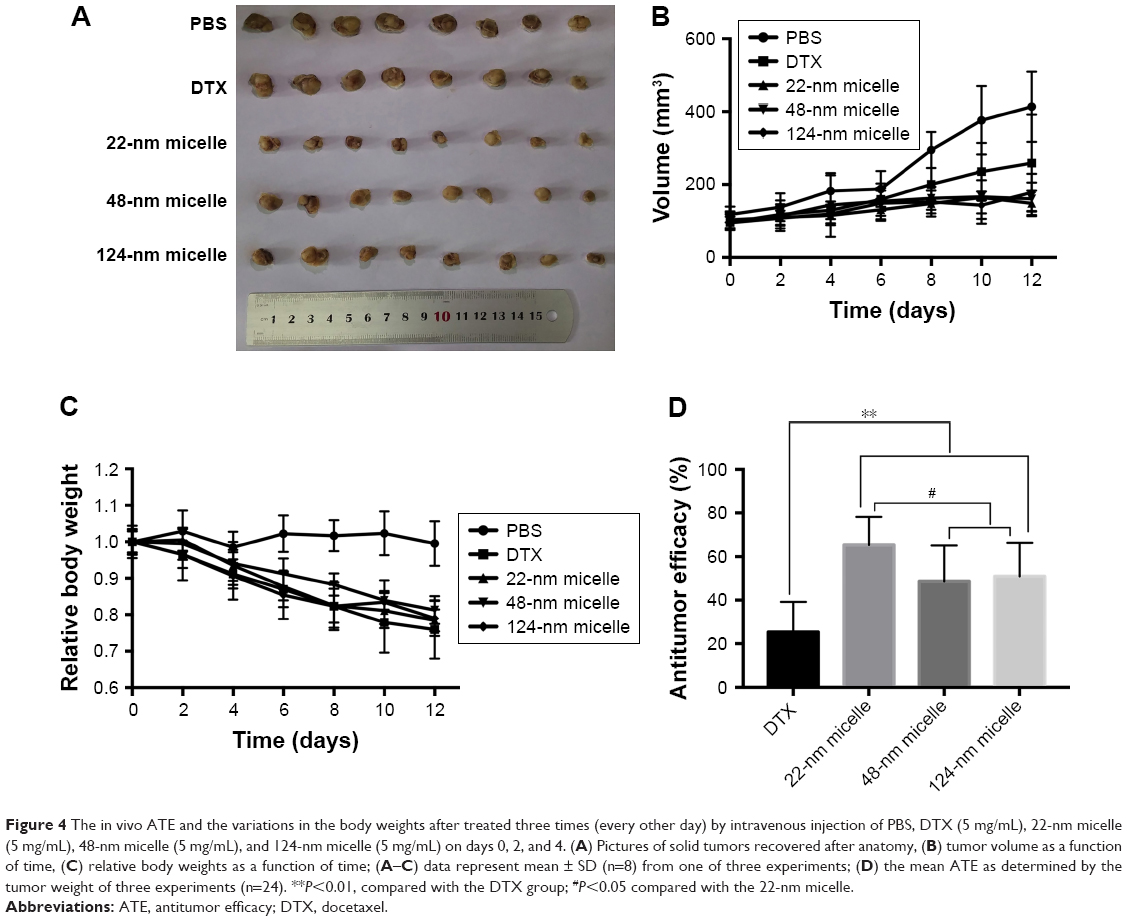 | Figure 4 The in vivo ATE and the variations in the body weights after treated three times (every other day) by intravenous injection of PBS, DTX (5 mg/mL), 22-nm micelle (5 mg/mL), 48-nm micelle (5 mg/mL), and 124-nm micelle (5 mg/mL) on days 0, 2, and 4. (A) Pictures of solid tumors recovered after anatomy, (B) tumor volume as a function of time, (C) relative body weights as a function of time; (A–C) data represent mean ± SD (n=8) from one of three experiments; (D) the mean ATE as determined by the tumor weight of three experiments (n=24). **P<0.01, compared with the DTX group; #P<0.05 compared with the 22-nm micelle. |
Conclusion
We developed an MSOT imaging method for the spatiotemporal and quantitative analysis of the intratumoral distribution of micelles with different particle sizes in living animals in this study. The MSOT imaging results have demonstrated that the initial extravasation and spatial distribution of polymeric micelles within tumor tissues were highly dependent on particle size. The 22-nm micelle improved the availability of micellar vesicles in the inner tumor tissues, leading to significant better antitumor effects than micelles with larger diameters.
Acknowledgments
We thank Jonathan Huynh for his expert advice on English writing. This work was supported by CAMS Initiative for Innovative Medicine (Grant no. 2016-I2M-1–012) and the National Natural Science Foundation of China (Grant no. 81603052).
Disclosure
The authors report no conflicts of interest in this work.
References
Shin DH, Tam YT, Kwon GS. Polymeric micelle nanocarriers in cancer research. Front Chem Sci Eng. 2016;10(3):348–359. | ||
Kim TY, Kim DW, Chung JY, et al. Phase I and pharmacokinetic study of Genexol-PM, a cremophor-free, polymeric micelle-formulated paclitaxel, in patients with advanced malignancies. Clin Cancer Res. 2004;10(11):3708–3716. | ||
Bobo D, Robinson KJ, Islam J, Thurecht KJ, Corrie SR. Nanoparticle-based medicines: a review of FDA-approved materials and clinical trials to date. Pharm Res. 2016;33(10):2373–2387. | ||
Maeda H. The enhanced permeability and retention (EPR) effect in tumor vasculature: the key role of tumor-selective macromolecular drug targeting. Adv Enzyme Regul. 2001;41:189–207. | ||
Yang Y, Sunoqrot S, Stowell C, et al. Effect of size, surface charge, and hydrophobicity of poly(amidoamine) dendrimers on their skin penetration. Biomacromolecules. 2012;13(7):2154–2162. | ||
Histed SN, Lindenberg ML, Mena E, Turkbey B, Choyke PL, Kurdziel KA. Review of functional/anatomical imaging in oncology. Nucl Med Commun. 2012;33(4):349–361. | ||
Antonsen SL, Jensen LN, Loft A, et al. MRI, PET/CT and ultrasound in the preoperative staging of endometrial cancer – a multicenter prospective comparative study. Gynecol Oncol. 2013;128(2):300–308. | ||
Maffione AM, Lopci E, Bluemel C, Giammarile F, Herrmann K, Rubello D. Diagnostic accuracy and impact on management of (18)F-FDG PET and PET/CT in colorectal liver metastasis: a meta-analysis and systematic review. Eur J Nucl Med Mol Imaging. 2015;42(1):152–163. | ||
Lichtman JW, Fraser SE. The neuronal naturalist: watching neurons in their native habitat. Nat Neurosci. 2001;4 Suppl(11s):1215–1220. | ||
Miller MA, Weissleder R. Imaging the pharmacology of nanomaterials by intravital microscopy: Toward understanding their biological behavior. Adv Drug Deliv Rev. 2017;113:61–86. | ||
Yuan L, Lin W, Zheng K, He L, Huang W. Far-red to near infrared analyte-responsive fluorescent probes based on organic fluorophore platforms for fluorescence imaging. Chem Soc Rev. 2013;42(2):622–661. | ||
Anees P, Joseph J, Sreejith S, et al. Real time monitoring of aminothiol level in blood using a near-infrared dye assisted deep tissue fluorescence and photoacoustic bimodal imaging. Chem Sci. 2016;7(7):4110–4116. | ||
Guo Z, Park S, Yoon J, Shin I. Recent progress in the development of near-infrared fluorescent probes for bioimaging applications. Chem Soc Rev. 2014;43(1):16–29. | ||
Ji C, Gao Q, Dong X, et al. A Size-Reducible Nanodrug with an Aggregation-Enhanced Photodynamic Effect for Deep Chemo-Photodynamic Therapy. Angew Chem Int Ed Engl. 2018;57(35):11384–11388. | ||
Zhang S, Guo W, Wei J, Li C, Liang XJ, Yin M. Terrylenediimide-based intrinsic theranostic nanomedicines with high photothermal conversion efficiency for photoacoustic imaging-guided cancer therapy. ACS Nano. 2017;11(4):3797–3805. | ||
Brooksby BA, Dehghani H, Pogue BW, Paulsen KD. Near-infrared (NIR) tomography breast image reconstruction with a priori structural information from MRI: algorithm development for reconstructing heterogeneities. IEEE J Sel Top Quantum Electron. 2003;9(2):199–209. | ||
Manohar S, Razansky D. Photoacoustics: a historical review. Adv Opt Photonics. 2016;8(4):586–617. | ||
Zhang HF, Maslov K, Stoica G, Wang LV. Functional photoacoustic microscopy for high-resolution and noninvasive in vivo imaging. Nat Biotechnol. 2006;24(7):848–851. | ||
Gu K, Xu Y, Li H, et al. Real-time tracking and in vivo visualization of β-galactosidase activity in colorectal tumor with a ratiometric near-infrared fluorescent probe. J Am Chem Soc. 2016;138(16):5334–5340. | ||
Tang R, Xue J, Xu B, Shen D, Sudlow GP, Achilefu S. Tunable ultrasmall visible-to-extended near-infrared emitting silver sulfide quantum dots for integrin-targeted cancer imaging. ACS Nano. 2015;9(1):220–230. | ||
Racovita A, Morar A, Balan O, Moldoveanu F, Moldoveanu A. Near infrared imaging for tissue analysis. Paper presented at: Control Systems and Computer Science (CSCS), 21st International Conference; May 29–May 31; 2017; Bucharest, Romania. | ||
Wang J, Mao W, Lock LL, et al. The role of micelle size in tumor accumulation, penetration, and treatment. ACS Nano. 2015;9(7):7195–7206. | ||
Huang K, Ma H, Liu J, et al. Size-dependent localization and penetration of ultrasmall gold nanoparticles in cancer cells, multicellular spheroids, and tumors in vivo. ACS Nano. 2012;6:4483–4493. | ||
Caster JM, Stephanie KY, Patel AN. Effect of particle size on the biodistribution, toxicity, and efficacy of drug-loaded polymeric nanoparticles in chemoradiotherapy. Nanomed Nanotechnol Biol Med. 2017;13(5):1673–1683. | ||
Recordati C, De Maglie M, Bianchessi S, et al. Tissue distribution and acute toxicity of silver after single intravenous administration in mice: nano-specific and size-dependent effects. Part Fibre Toxicol. 2016;13:12. | ||
Liu L, Sun L, Wu Q, et al. Curcumin loaded polymeric micelles inhibit breast tumor growth and spontaneous pulmonary metastasis. Int J Pharm. 2013;443(1–2):175–182. | ||
Liu H, Wu D. In vivo near-infrared fluorescence tumor imaging using DiR-loaded nanocarriers. Curr Drug Deliv. 2016;13(1):40–48. | ||
Wang J, Guo F, Yu M, et al. Rapamycin/DiR loaded lipid-polyaniline nanoparticles for dual-modal imaging guided enhanced photothermal and antiangiogenic combination therapy. J Control Release. 2016;237:23–34. | ||
Burton NC, Patel M, Morscher S, et al. Multispectral opto-acoustic tomography (MSOT) of the brain and glioblastoma characterization. Neuroimage. 2013;65:522–528. | ||
Beziere N, Lozano N, Nunes A, et al. Dynamic imaging of PEGylated indocyanine green (ICG) liposomes within the tumor microenvironment using multi-spectral optoacoustic tomography (MSOT). Biomaterials. 2015;37:415–424. | ||
Hu X, Han R, Quan LH, Liu CY, Liao YH. Stabilization and sustained release of zeylenone, a soft cytotoxic drug, within polymeric micelles for local antitumor drug delivery. Int J Pharm. 2013;450(1–2):331–337. | ||
Taruttis A, Morscher S, Burton NC, Razansky D, Ntziachristos V. Fast multispectral optoacoustic tomography (MSOT) for dynamic imaging of pharmacokinetics and biodistribution in multiple organs. PLoS One. 2012;7(1):e30491. | ||
Yue J, Liu S, Xie Z, Xing Y, Jing X. Size-dependent biodistribution and antitumor efficacy of polymer micelle drug delivery systems. J Mater Chem B. 2013;1(34):4273–4280. | ||
Maeda H, Bharate GY, Daruwalla J. Polymeric drugs for efficient tumor-targeted drug delivery based on EPR-effect. Eur J Pharm Biopharm. 2009;71(3):409–419. | ||
Popović Z, Liu W, Chauhan VP, et al. A nanoparticle size series for in vivo fluorescence imaging. Angew Chem Int Ed Engl. 2010;49(46):8649–8652. | ||
Perry JL, Reuter KG, Luft JC, Pecot CV, Zamboni W, DeSimone JM. Mediating passive tumor accumulation through particle size, tumor type, and location. Nano Lett. 2017;17(5):2879–2886. | ||
Goodman TT, Chen J, Matveev K, Pun SH. Spatio-temporal modeling of nanoparticle delivery to multicellular tumor spheroids. Biotechnol Bioeng. 2008;101(2):388–399. | ||
Cabral H, Matsumoto Y, Mizuno K, et al. Accumulation of sub-100 nm polymeric micelles in poorly permeable tumours depends on size. Nat Nanotechnol. 2011;6(12):815–823. | ||
Chen H, Zhang W, Zhu G, Xie J, Chen X. Rethinking cancer nanotheranostics. Nat Rev Mater. 2017;2(7):17024. | ||
Xiao K, Luo J, Li Y, Lee JS, Fung G, Lam KS. PEG-oligocholic acid telodendrimer micelles for the targeted delivery of doxorubicin to B-cell lymphoma. J Control Release. 2011;155(2):272–281. | ||
Zhang L, He Y, Ma G, Song C, Sun H. Paclitaxel-loaded polymeric micelles based on poly(ε-caprolactone)-poly(ethylene glycol)-poly(ε-caprolactone) triblock copolymers: in vitro and in vivo evaluation. Nanomed Nanotechnol Biol Med. 2012;8(6):925–934. | ||
Ye J, Fu G, Yan X, et al. Noninvasive magnetic resonance/photoacoustic imaging for photothermal therapy response monitoring. Nanoscale. 2018;10(13):5864–5868. | ||
Shang L, Nienhaus K, Nienhaus GU. Engineered nanoparticles interacting with cells: size matters. J Nanobiotechnology. 2014;12:5. | ||
Varela JA, Bexiga MG, Åberg C, Simpson JC, Dawson KA. Quantifying size-dependent interactions between fluorescently labeled polystyrene nanoparticles and mammalian cells. J Nanobiotechnology. 2012;10(1):39. | ||
Wang SH, Lee CW, Chiou A, Wei PK. Size-dependent endocytosis of gold nanoparticles studied by three-dimensional mapping of plasmonic scattering images. J Nanobiotechnology. 2010;8:33. | ||
Lu F, Wu SH, Hung Y, Mou CY. Size effect on cell uptake in well-suspended, uniform mesoporous silica nanoparticles. Small. 2009;5(12):1408–1413. |
Supplementary materials
 | Figure S1 UV-Vis absorption spectra of free DiR and 48 nm DiR micelle (A), free coumarin 6 and 48 nm coumarin 6 micelle (B), free DTX and 48 nm DTX micelle (C). |
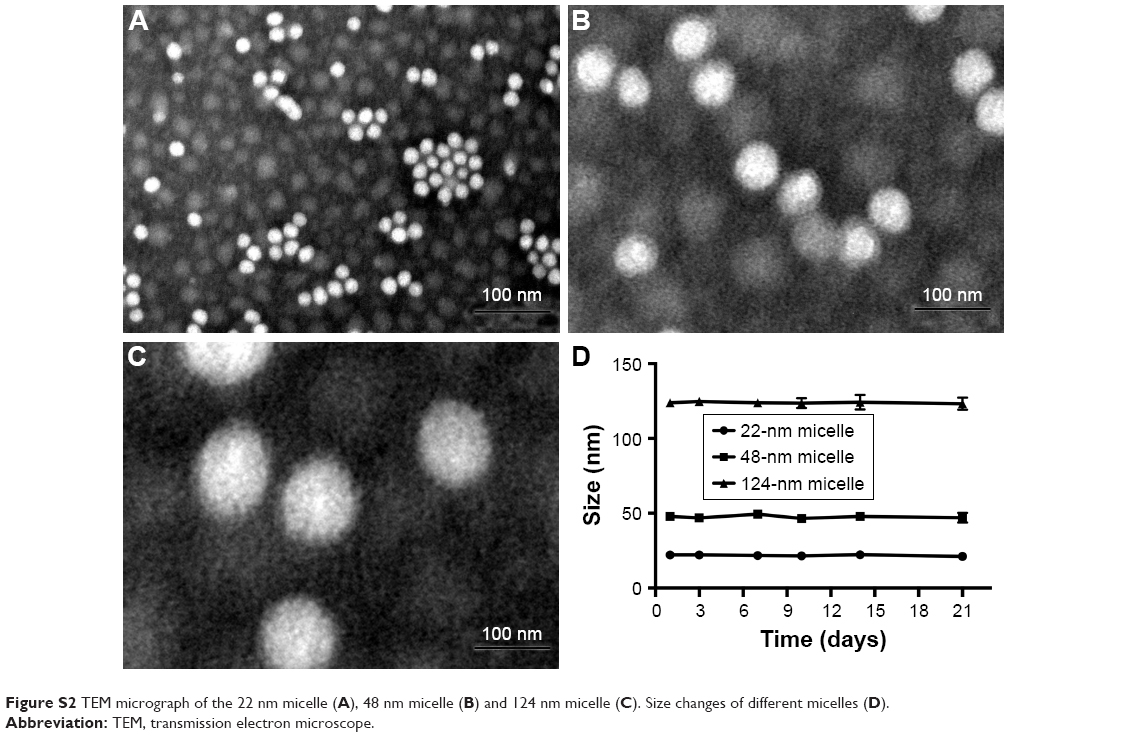 | Figure S2 TEM micrograph of the 22 nm micelle (A), 48 nm micelle (B) and 124 nm micelle (C). Size changes of different micelles (D). |
 | Figure S3 Cytotoxicity (MTT assay) of different size micelles in 4T1 cells ([A] 24 hours, [B] 48 hours). Cell viability was determined by measuring MTT method. |
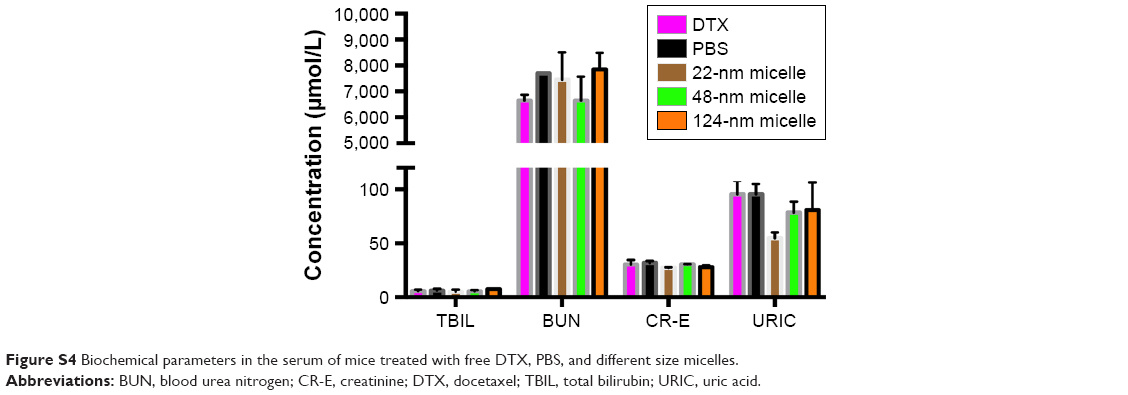 | Figure S4 Biochemical parameters in the serum of mice treated with free DTX, PBS, and different size micelles. |
 © 2018 The Author(s). This work is published and licensed by Dove Medical Press Limited. The
full terms of this license are available at https://www.dovepress.com/terms
and incorporate the Creative Commons Attribution
- Non Commercial (unported, 3.0) License.
By accessing the work you hereby accept the Terms. Non-commercial uses of the work are permitted
without any further permission from Dove Medical Press Limited, provided the work is properly
attributed. For permission for commercial use of this work, please see paragraphs 4.2 and 5 of our Terms.
© 2018 The Author(s). This work is published and licensed by Dove Medical Press Limited. The
full terms of this license are available at https://www.dovepress.com/terms
and incorporate the Creative Commons Attribution
- Non Commercial (unported, 3.0) License.
By accessing the work you hereby accept the Terms. Non-commercial uses of the work are permitted
without any further permission from Dove Medical Press Limited, provided the work is properly
attributed. For permission for commercial use of this work, please see paragraphs 4.2 and 5 of our Terms.