Back to Journals » Clinical Ophthalmology » Volume 14
Multimodal Evaluation of Visual Function in Geographic Atrophy versus Normal Eyes
Authors Burguera-Giménez N, García-Lázaro S, España-Gregori E ![]() , Gallego-Pinazo R, Burguera-Giménez N, Rodríguez-Vallejo M
, Gallego-Pinazo R, Burguera-Giménez N, Rodríguez-Vallejo M ![]() , Jonna G
, Jonna G
Received 16 January 2020
Accepted for publication 30 April 2020
Published 4 June 2020 Volume 2020:14 Pages 1533—1545
DOI https://doi.org/10.2147/OPTH.S246245
Checked for plagiarism Yes
Review by Single anonymous peer review
Peer reviewer comments 2
Editor who approved publication: Dr Scott Fraser
Noemi Burguera-Giménez,1– 3 Santiago García-Lázaro,2 Enrique España-Gregori,4,5 Roberto Gallego-Pinazo,6 Neus Burguera-Giménez,2 Manuel Rodríguez-Vallejo,3 Gowtham Jonna1
1Ophthalmology Department, Retina Research Center, Austin, Texas, USA; 2Optometry Department, University of Valencia, Valencia, Spain; 3Ophthalmology Department, Qvision, Hospital Vithas Virgen Del Mar, Almeria, Spain; 4Ophthalmology Department, La Fe University Hospital, Valencia, Spain; 5Surgery Department, University of Valencia, Valencia, Spain; 6Ophthalmology Department, Oftalvist, IMED Hospital, Valencia, Spain
Correspondence: Gowtham Jonna Tel +1512 454 – 5851
Email [email protected]
Purpose: To comprehensively evaluate visual function in eyes with geographic atrophy (GA) as compared to normal eyes.
Patients and Methods: Sixty-three eyes from 63 patients ≥ 50 years old were recruited for this observational study; 31 were identified as normal macular health eyes and 32 with GA. Visual function was tested with best corrected visual acuity (BCVA), low luminance visual acuity (LLVA), low luminance deficit (LLD), reading speed, macular integrity microperimetry, fixation stability, and contrast sensitivity function (CSF). Anatomic function was evaluated with spectral-domain optical coherence tomography (SD-OCT) and fundus autofluorescence (FAF). Quality of life and vision were assessed with the National Eye Institute Visual Function Questionnaire-25 (NEI VFQ-25).
Results: Visual function and quality of life are reduced in patients with GA. Moderate and strong correlations in the GA group were found between maximum reading speed (r = 0.787) (p˂0.01), CS spatial frequency 3 cpd (r = 0.441) (p˂0.05), CS spatial frequency 6 cpd (r = 0.524) (p˂0.01), fixation P1 (r = 0.379) (p˂0.05), macular sensitivity (r = 0.484) (p˂0.05) and atrophic area (r = − 0.689) (p˂0.01), and the VFQ-25 composite score.
Conclusion: The decreased visual function is reflected in a poor quality of life in patients with GA. Reading speed, contrast sensitivity, fixation, and macular sensitivity are strongly associated with vision-related quality of life. The results suggest the importance of the reading letter size in patients with GA. Microperimetry and reading speed are useful tools to better assess visual impairment in patients with GA.
Keywords: geographic atrophy, age-related macular degeneration, reading speed, visual function, quality of life
Introduction
Age-related Macular Degeneration (AMD) is considered the most frequent cause of severe, irreversible central vision loss and is one of the leading causes of blindness in developed countries.1,2 More than 21 million people older than 60 years in the world have AMD2 and will increase in the coming years due to population aging.3 8.7% of the elderly population has AMD and is projected to largely increase by 2020 (196 million people) and reach 288 million by 2040.3
GA, the late-stage of AMD, is increasing exponentially with population aging4 and is becoming a larger public health problem.5 GA is characterized by loss of the retinal pigment epithelium (RPE) in the parafoveal area (pericentric macula).6–8 With disease progression, atrophic areas grow and coalesce leading to foveal RPE atrophy and moderate to severe vision loss.9 Patients with foveal-sparing (FS) GA may have good central vision but have many difficulties reading or recognizing faces due to parafoveal scotomata and because they cannot fit into the non-atrophic foveal area.9,10 The progression of GA results in a deterioration of visual function and a reduction in quality of life.
GA has anatomic and functional effects. In macular diseases such as AMD with GA, it is critical to correlate the anatomic findings with visual function.11 Though visual acuity has been used as the primary metric to assess visual function, it has been demonstrated that it is inadequate to comprehensively assess visual impairment10 and thus, underrepresents functional deficits.12 Other measures such as the contrast sensitivity function (CSF),13–16 reading speed,16–19 and low luminance visual acuity (LLVA), have been introduced to predict future VA loss.9,17,19 Several studies have also demonstrated the importance of microperimetry,9,11,20-23 measurement of extrafoveal fixation/preferred retinal locus (PRL),24–27 and fixation stability in the assessment of retinal sensitivity and macular function.28
Though variable, the mean enlargement rate of GA from the largest clinical trials to date is approximately 2 mm2 per year but there remains no currently approved, efficacious treatment option.29 For this reason, it is very important to continue to refine the tools for monitoring GA progression. Multimodal imaging with fundus autofluorescence (FAF) and spectral-domain optical coherence tomography (SD-OCT) have proven to be useful in monitoring GA.5,8,30 The combination of multimodal imaging with psychophysical tests and quality of life questionnaires may allow for a more comprehensive evaluation of the progression of GA.31,32 Nonetheless, there is no consensus on the anatomic and functional evaluation of GA that takes into account the patient–reported outcome (PRO).
AMD can have a severe impact on the quality of life of patients. It is sometimes associated with depression due to the progressive loss of vision. In clinical practice, some psychological aspects and daily life difficulties have been neglected.33 There are very few studies centered on PRO measures to assess the influence of visual impairment on vision-related function and vision-related quality of life in patients with advanced AMD.34,35 The 25-item National Eye Institute Visual Function Questionnaire (NEI VFQ-25) test is the most often used in clinical trials, and is considered the gold standard to evaluate the impact of vision loss on quality of life in patients with AMD.5,32,36 Recently, the NEI VFQ-25 has been recognized as a valid and reliable measure of the impact of GA on visual function and vision-related quality of life.34 In addition to the NEI VFQ-25 test, the functional reading Independence (FRI) index is a new psychometric instrument for assessment of functional reading developed specifically for GA patients. The FRI Index score is correlated with GA lesion size and VFQ-25 score.37 However, it does not measure aspects of visual function and vision-related quality of life as they are measured with VFQ-25 test.34 The purpose of this study was to analyze the association between the different tests of visual function and the scores of the NEI VFQ-25 in subjects with GA as compared to normal controls to better elucidate the broad-ranging effects of GA based on the PRO.
Methods
Ethics Statement
This study was approved by the Committee of the Sanitary Research Institute La Fe. The research followed the tenets of the Declaration of Helsinki. Written informed consent was obtained from all individual participants included in the study after explanation of the nature and possible consequences of the study.
Study Population
Study subjects with GA and non-AMD controls were identified from the population at the La Fe University Hospital of Valencia. Inclusion criteria for participants with GA were: age greater than or equal to 50 years with the ability to provide consent to participate, Snellen Visual Acuity of 20/200 (0.1 logMAR) or better, GA secondary to AMD, and no prior or active choroidal neovascularization (CNV). Exclusion criteria were: previous diagnosis of inherited retinal disease/retinal or macular dystrophy, retinal detachment, uveitis, glaucoma, non-glaucomatous optic neuropathy, epiretinal membrane, diabetes mellitus, or any other condition disease that, in the view of the investigators, could confound the study results. Inclusion criteria for control subjects were the same for age, but with Snellen VA of 20/20 and no signs of AMD.
Clinical Tests and Image Analysis
All participants underwent the psychophysical tests of visual function during the study visit. Best corrected visual acuity (BCVA) and low luminance visual acuity (LLVA) were measured with the Early Treatment Diabetic Retinopathy Study (ETDRS) chart illuminated with a negatoscope that provided the standardized illumination of the optotypes (equipped with two 20 watt daylight fluorescent bulbs) at 4 meters and at 1 meter only if unable to read at least 19 letters at 4 meters, in which case +0.75 diopter lens was added and the test performed at 1 meter. Standard LLVA was measured using a log 2.0 neutral density filter Kodak Wratten (Kodak, Rochester, NY) that reduces the luminance 100 times. For each participant, standardized protocol refraction was performed first followed by BCVA and then LLVA. Low luminance deficit (LLD) was calculated as the difference (in logMAR units) between the BCVA and LLVA. Near visual acuity (NVA) was measured with the test SOSH Low Vision Chart (Pennsylvania College of Optometry, Pennsylvania) at 40 centimeters in photopic conditions (111.45 ± 5.83 cd/m2 Tektronix J17 LumaColor (Tektronix, Beaverton, Oregon, U.S.A.)), the reading add used was +2.50D. Contrast Sensitivity Function (CSF) was tested in photopic conditions (85 cd/m2) with the test presented in the screen of the Topcon CC-100 (Topcon España S.A., España). The test is made up of circular sheets on a grey background with sinusoidal waves in 5 frequency levels and 8 contrast levels. The patient should be able to distinguish the direction of the sinusoidal waves and the answers were recorded as a curve; the CSF curve of each patient was obtained. The measurement of reading speed was done with the Radner Reading Test measured as logarithm of the reading acuity determination (logRAD), formed of short sentence optotypes (14 words) with standardized word length, word location, lexical and syntactical difficulty. It was tested at 32 centimeters and started with the larger letter size. Only the sentences read in 20 seconds at most were recorded as valid. In addition to the reading speed, the critical point size (CPS) was calculated. CPS is defined as the minimum character that one can read with fast speed.
Macular integrity and fixation stability were evaluated with the Macular Integrity Assessment (MAIA, CenterVue, Padova, Italy). Ten degrees of visual field (space between sampling points < 1 degree) were assessed with 4 fixed sensitivity levels (0 dB, 5 dB, 15 dB, 25 dB). The fixation stability was quantified by the value of P1 (circle of one degree radius) and 95% bivariate contour ellipse area (BCEA). Stable fixation was defined as P1 percentage with greater than 75% of the fixation points inside the 2º diameter circle. Relatively unstable fixation was defined as P1 percentage with greater than 75% of the fixation points inside the 4º diameter circle, and unstable fixation as less than 75% of the fixation points inside the 4º diameter circle. The 95% BCEA value, expressed as an ellipse area in square degrees, contained 95% of the fixation points used by the patient throughout the test.
Multimodal imaging with spectral-domain optical coherence tomography (SD-OCT) and fundus autofluorescence (FAF) were obtained using the Heidelberg Spectralis HRA-OCT (Heidelberg Engineering, Heidelberg, Germany). GA lesion size was calculated using high-resolution (1536 x 1536 pixels) FAF and 30 x 30 degree field of images centered on the fovea. The GA areas were defined as areas of decreased autofluorescence (hypo-autofluorescence) and were measured using the Spectralis software version 5. In patients with multiple hypo-autofluorescent areas, all areas of more than 0.5 mm2 were summed.
Finally, all patients completed the NEI VFQ-25 Version 2000. This final version differs from the previous version in that it includes an extra driving item from the appendix of supplementary questions as a part of the base set of items. In addition to the 25 questions, 6 more questions related to near vision (A3, A4, A5) and distance vision (A6, A7, A8) were added, making a total of 31 questions.
Statistical Analysis
Statistical analysis was performed using IBM SPSS software version 24 (IBM-SPSS Inc, USA). Baseline demographic and clinical variables were summarized for each group. The continuous variables were expressed as the mean ± standard deviation (SD), whereas the categorical variables were expressed as the frequency and percentage. The Mann–Whitney U-test was used to compare continuous variables between both groups. Spearman rho (r) correlation was used to assess the relationship between the visual function tests and the NEI VFQ-25 scores. Preliminary analysis showed the relationship to be monotonic, as assessed by visual inspection of a scatter plot. Preliminary analysis showed that both variables were not normally distributed as assessed by Shapiro–Wilk test and p-value ˂ 0.05. The association between the visual function tests and questionnaire scores were explored by performing a stepwise forward multiple regression analysis with the visual function tests’ results as potential explanatory variables.
Results
A total of 63 eyes from 63 patients were included in the analysis. There were 32 eyes with GA (13 men and 19 women) and 31 eyes with normal macular health (14 men and 17 women). At baseline mean age was 78.53 ± 8.11 years for the GA group, and 65.42 ± 7.86 years for the macular health group. Demographics and study eye characteristics of the patients are shown in Table 1. The comparison of the results of the visual function tests between groups are shown in Table 2 and the NEI VFQ-25 scores in Table 3. Reading speed and contrast sensitivity results are presented in Figures 1 and 2. FAF and microperimetry from one representative GA patient is illustrated in Figure 3.
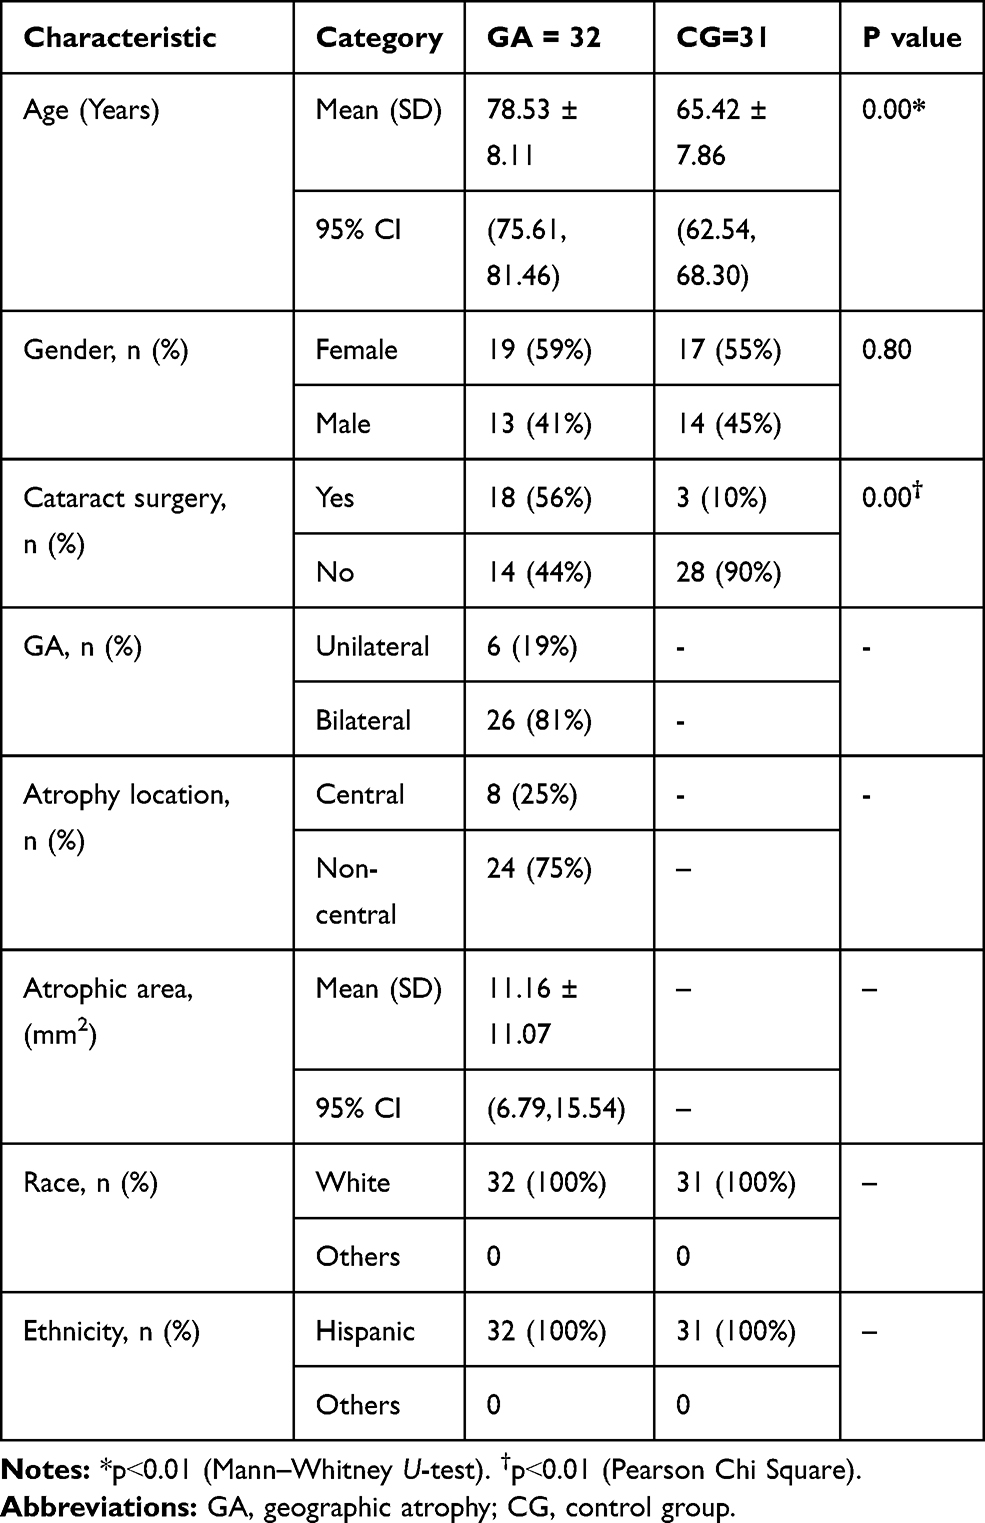 |
Table 1 Patient Baseline Demographics and Ocular Characteristics |
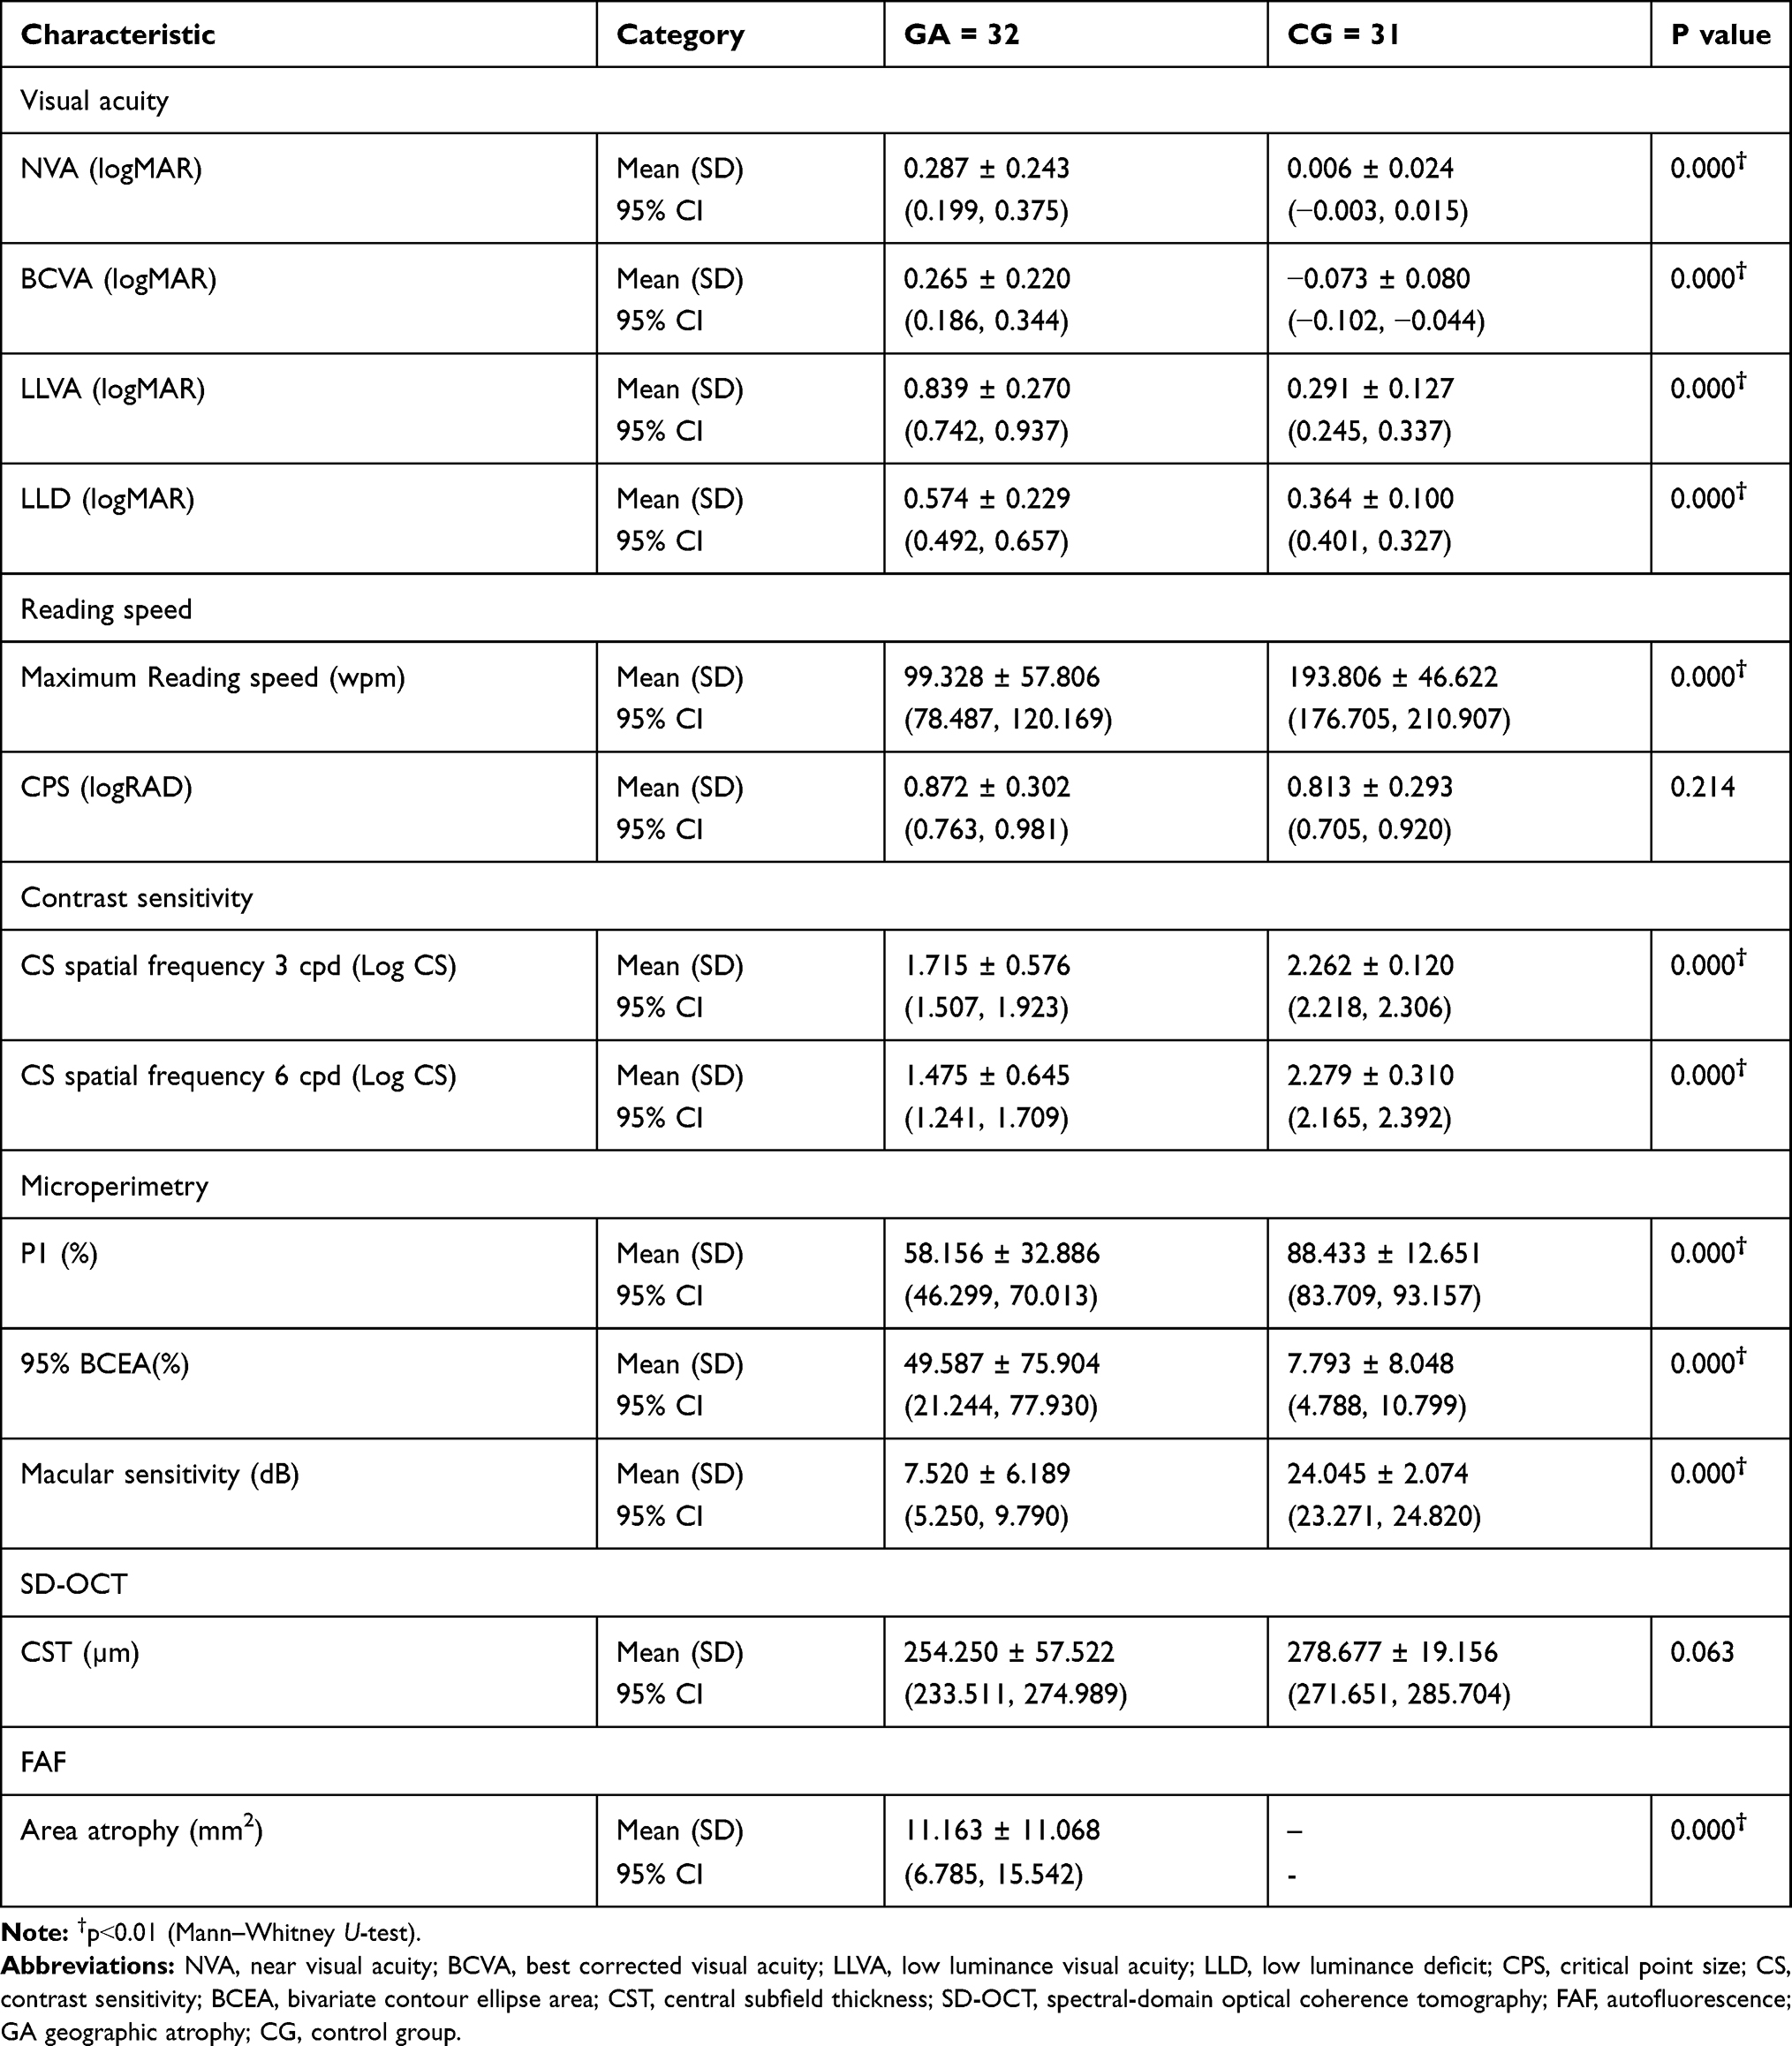 |
Table 2 Visual Testing |
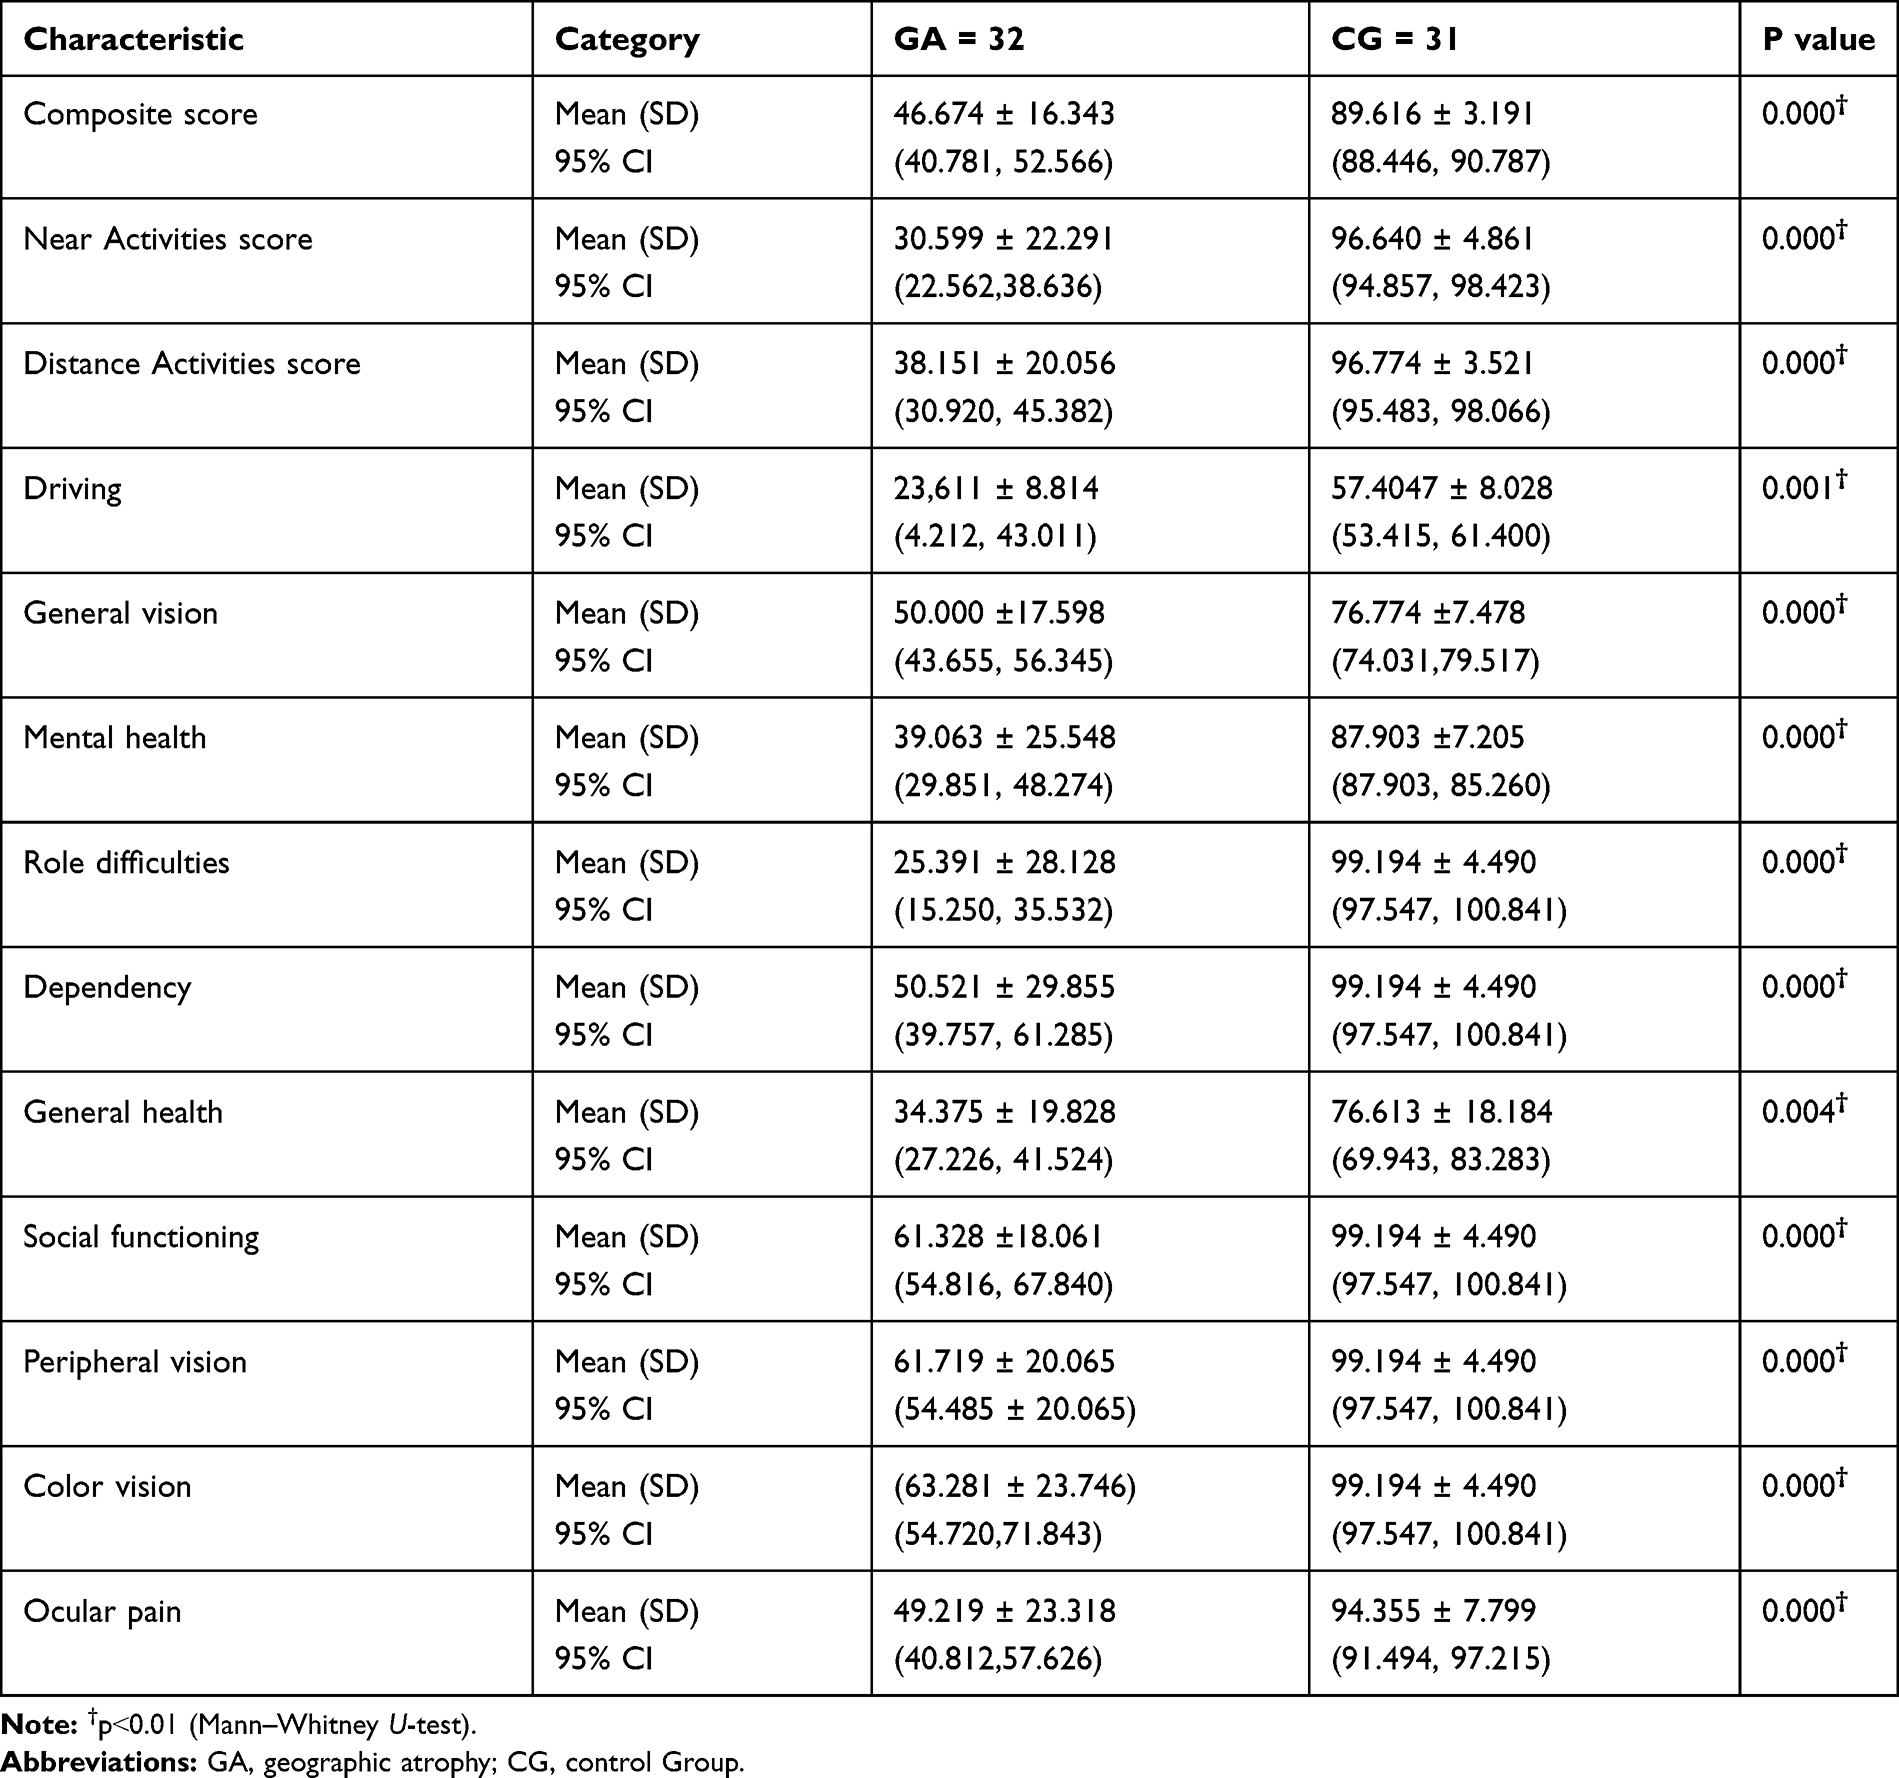 |
Table 3 NEI VFQ-25 |
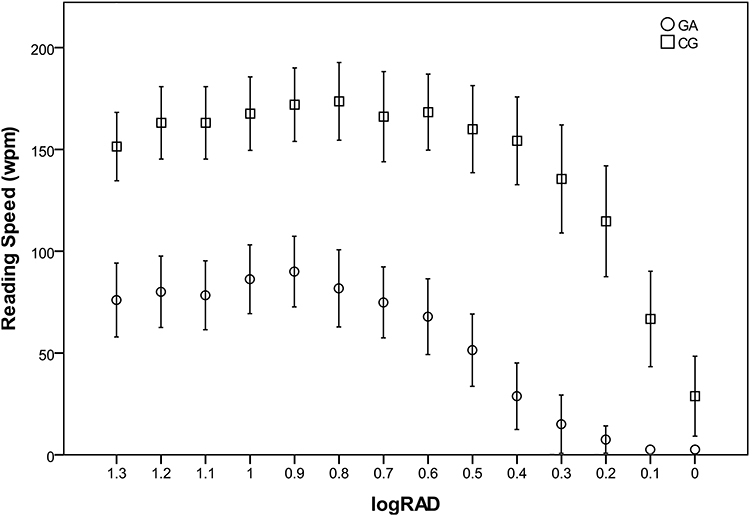 |
Figure 1 Reading speed in patients with geographic atrophy (GA) and control group (CG) Maximum reading speed (0.9 logRAD for GA and 0.8 logRAD for CG) corresponds to the critical point size (CPS). Error bars represent 95% confidence interval. |
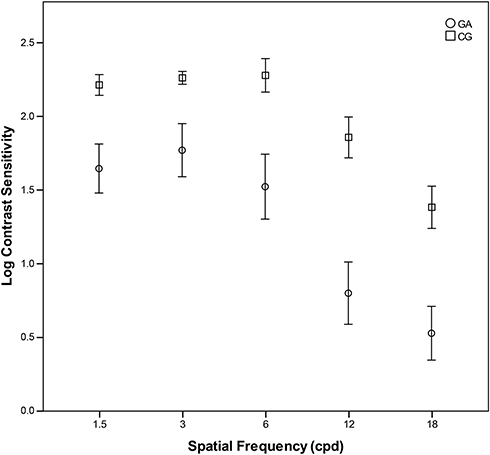 |
Figure 2 Contrast sensitivity in patients with geographic atrophy (GA) and control group (CG). Error bars represent 95% confidence interval. |
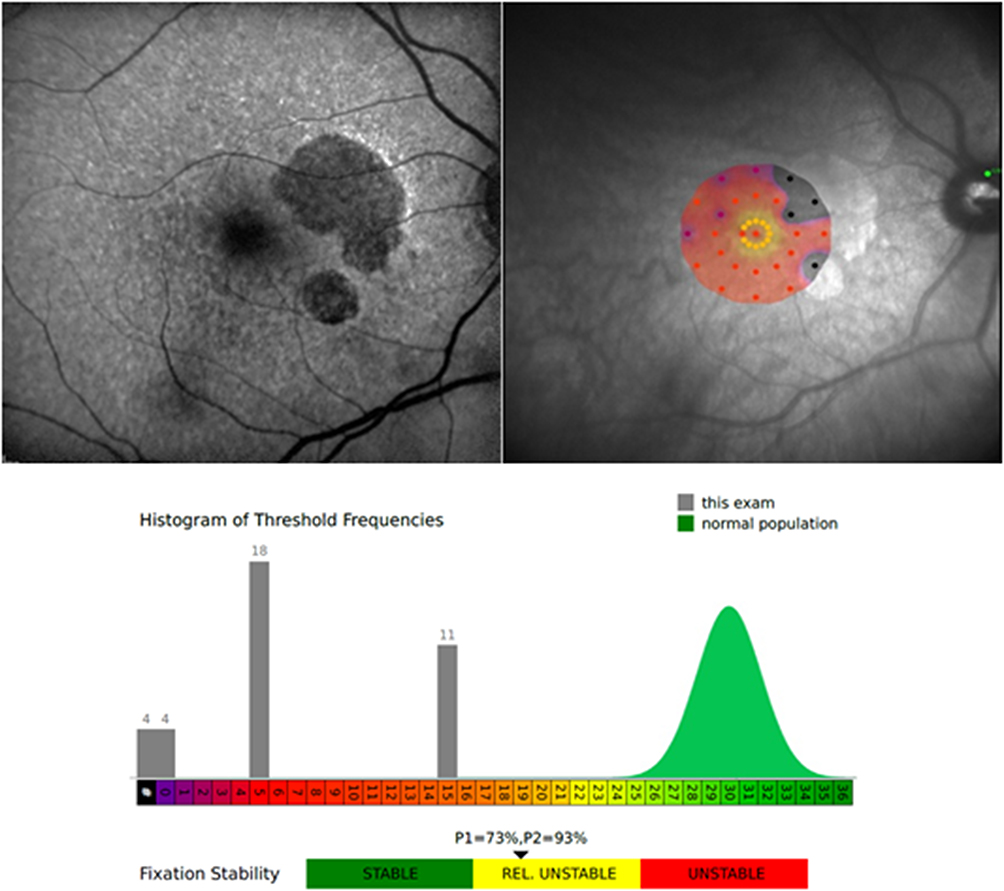 |
Figure 3 Autofluorescence in a patient with geographic atrophy (GA) (left), Microperimetry (right), and Histogram of Macular sensitivity and Fixation stability (below) from the same patient. There are dark areas of hypo-autofluorescence corresponding to GA on the left. On the right, the black points correspond to no sensitivity and the red points correspond to decreased sensitivity on the macular sensitivity map. There is central fixation but relatively unstable fixation (below). |
Tables 4, 5 and 6 show the correlation between the visual function tests and the NEI VFQ-25 composite score, near and distance activities score. Visual function tests of GA patients such as maximum reading speed, CS, fixation, macular sensitivity and atrophy area, correlated significantly with all NEI VFQ-25 scores (Table 4). The highest positive correlation was found between the maximum reading speed and the composite score r = 0.787 (p˂0.01), and the negative highest correlation was between the atrophy area and the composite score r = −0.689 (p˂0.01). Table 5 shows the only correlation found in the CG between NVA and distance activities score. When all patients were analyzed together as a group, all visual function tests showed correlation except central subfield thickness (CST) and CPS; results are illustrated in Table 6. The highest correlation was found between the macular sensitivity and distance activities score r = 0.827 (p ˂ 0.01) followed by composite score r = 0.818 (p ˂ 0.01).
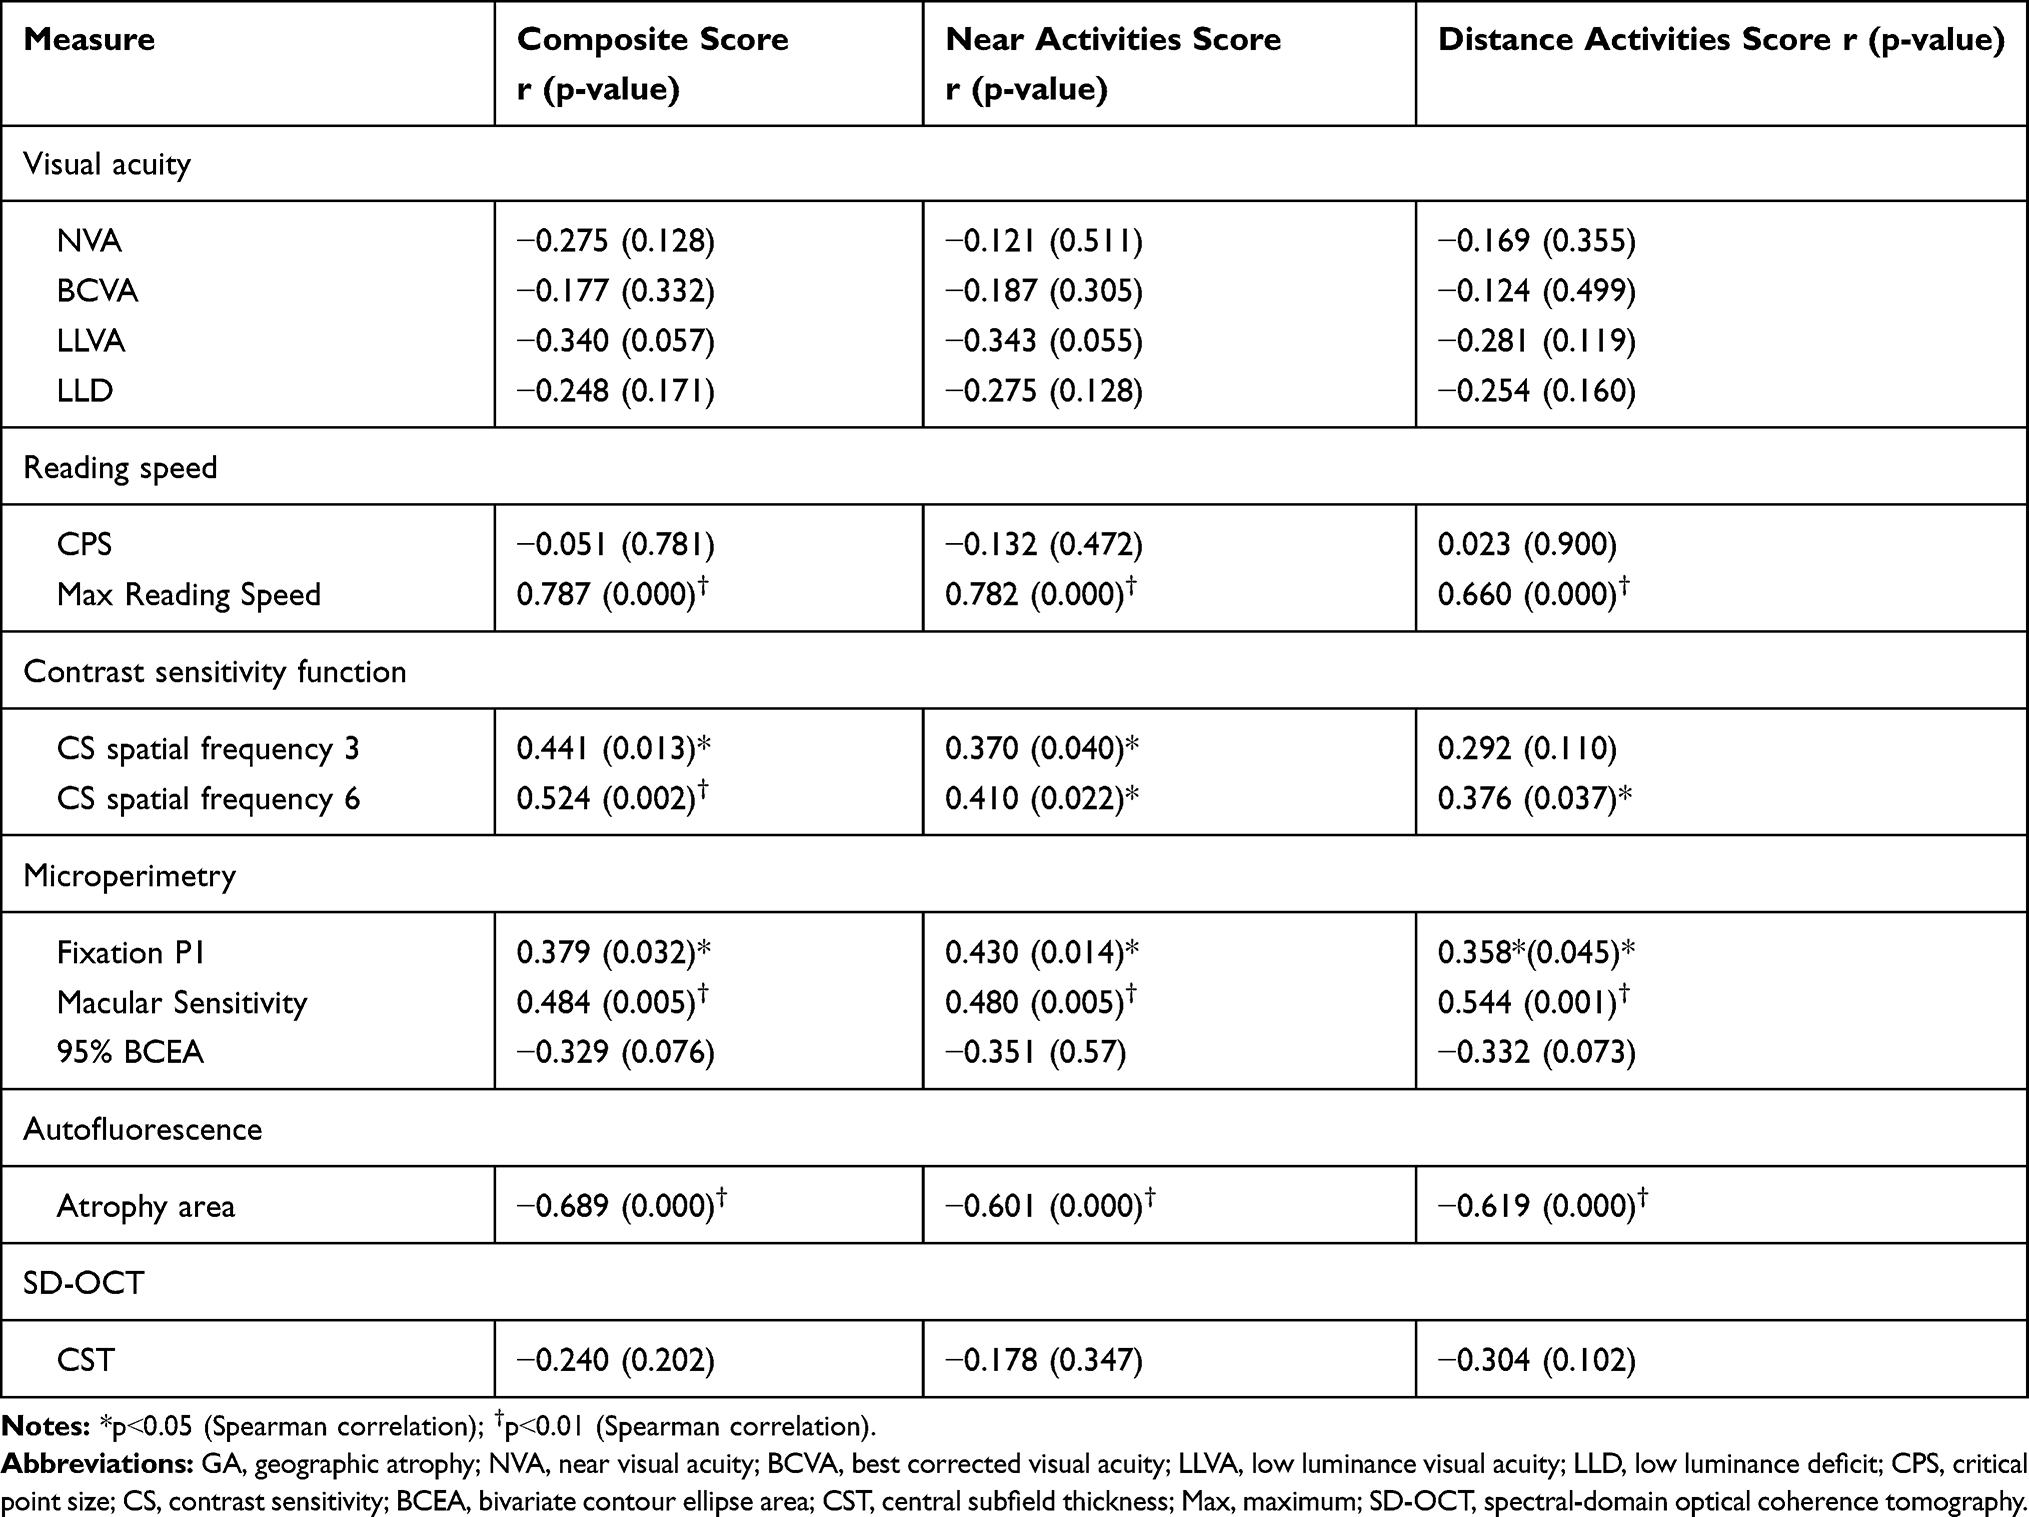 |
Table 4 Association Between Visual Function Tests and NEI VFQ-25 in GA Patients |
 |
Table 5 Association Between Visual Function Tests and NEI VFQ-25 in CG Patients |
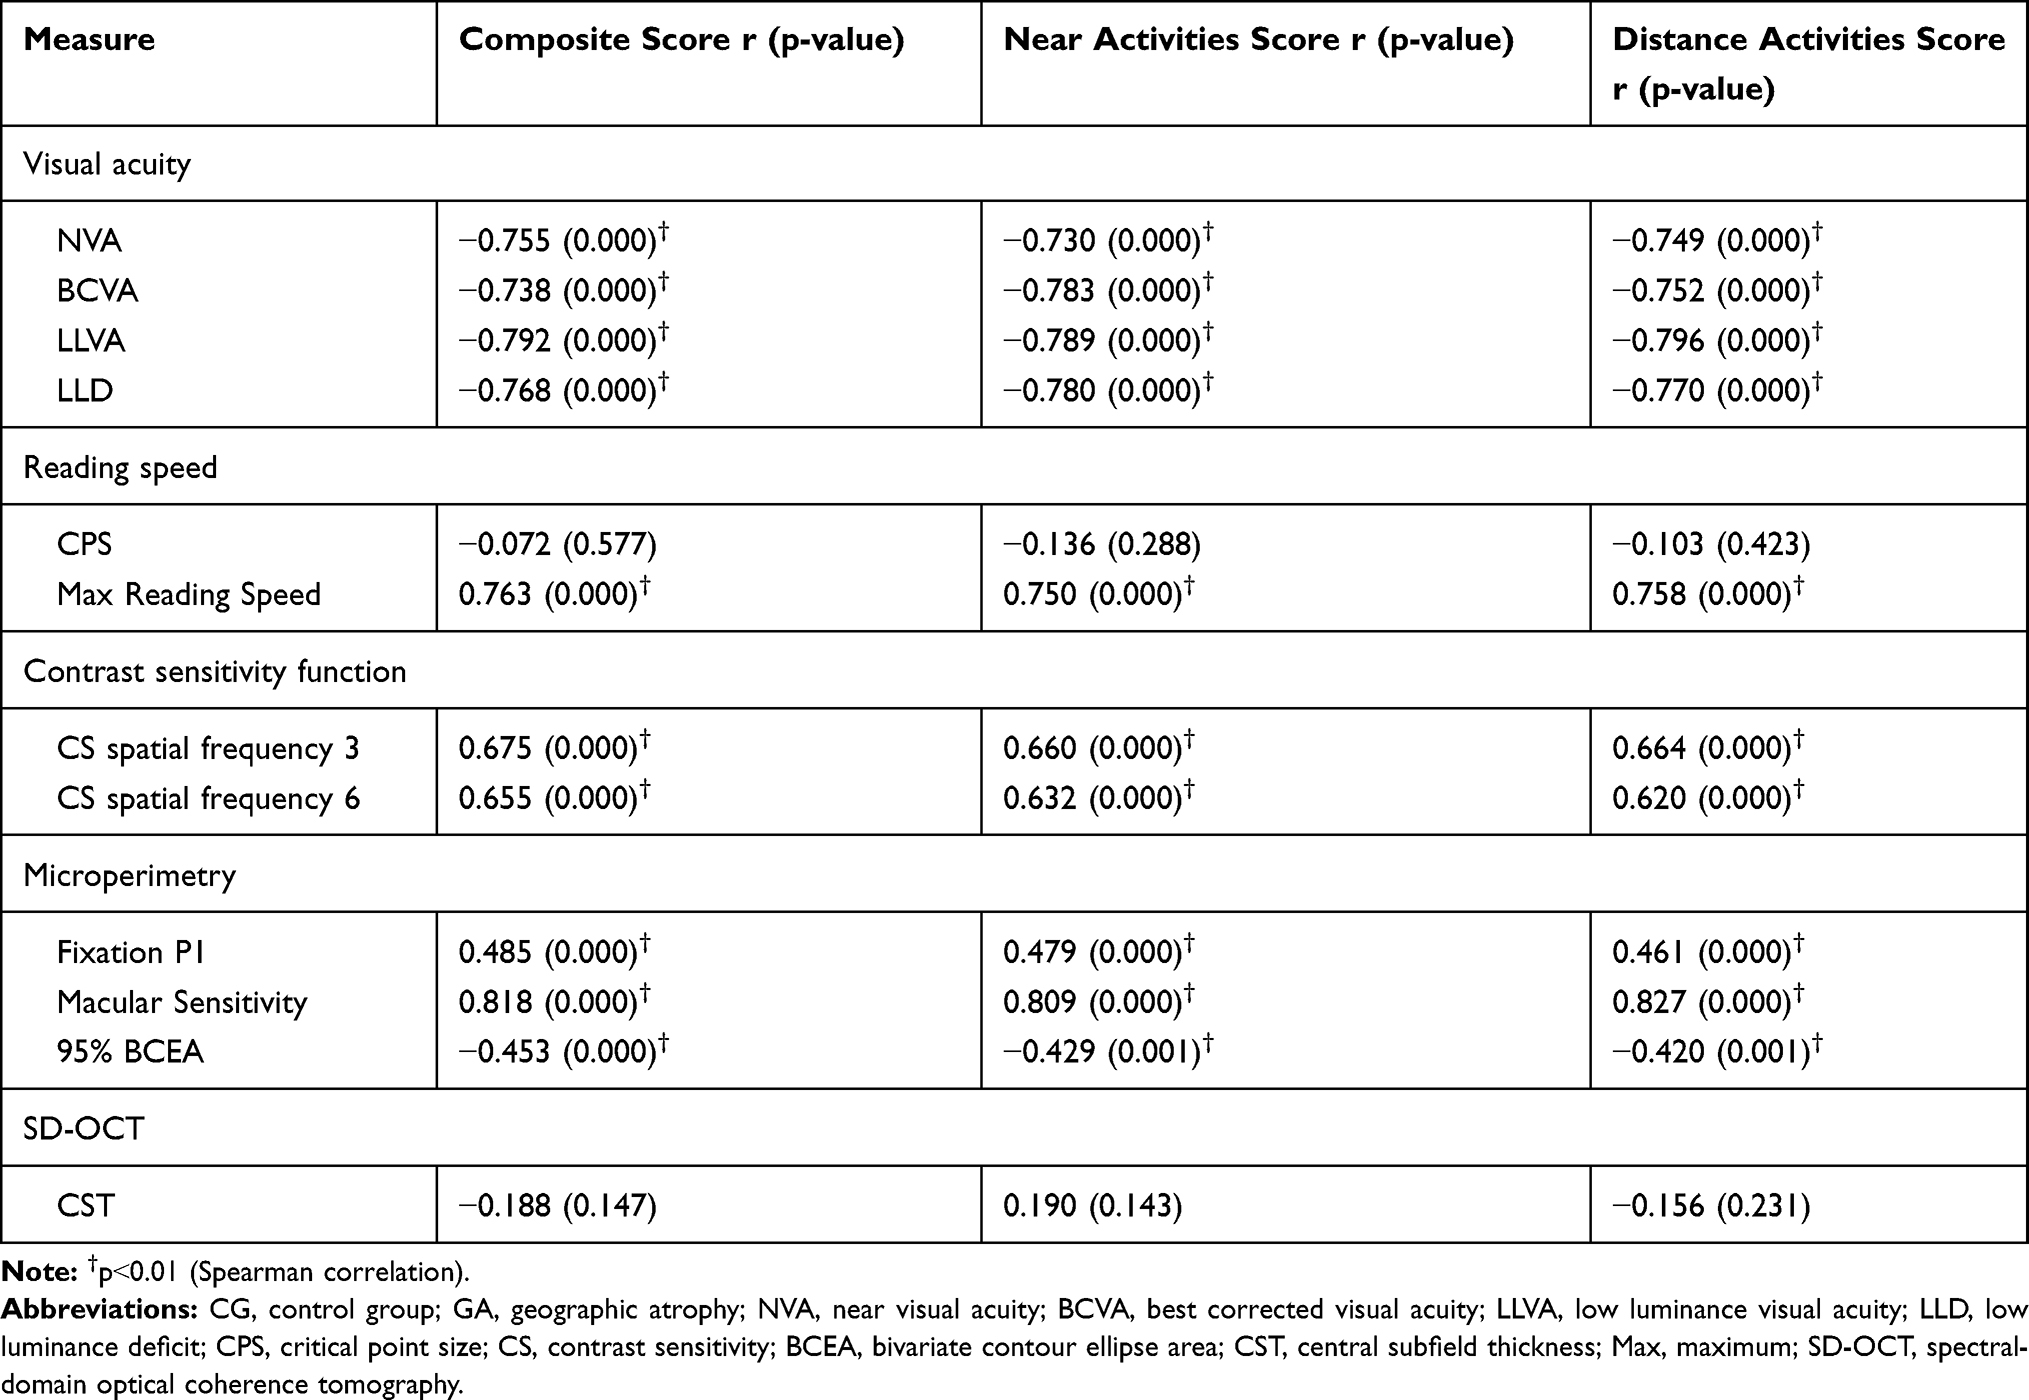 |
Table 6 Association Between Visual Function Tests and NEI VFQ-25 in CG and GA Patients |
The visual function tests with most variation in the NEI VFQ-25 composite score are maximum reading speed (R2 = 0.468, p ˂ 0.01) and atrophy area (R2 = 0.639, p ˂ 0.01). In the near activities score, most variation was noted in the maximum reading speed (R2 = 0.478, p ˂ 0.01) followed by atrophy area (R2 =0.594, p ˂ 0.05). In the distance activities score, the most variable were maximum reading speed (R2 = 0.335, p ˂ 0.01), atrophy area (R2 =0.527, p ˂ 0.01), and macular sensitivity (R2 = 0.602, p ˂ 0.05). Results are illustrated in Table 7. Age was not included as a factor in the analysis due to the fact that it did not correlate with any of the variables.
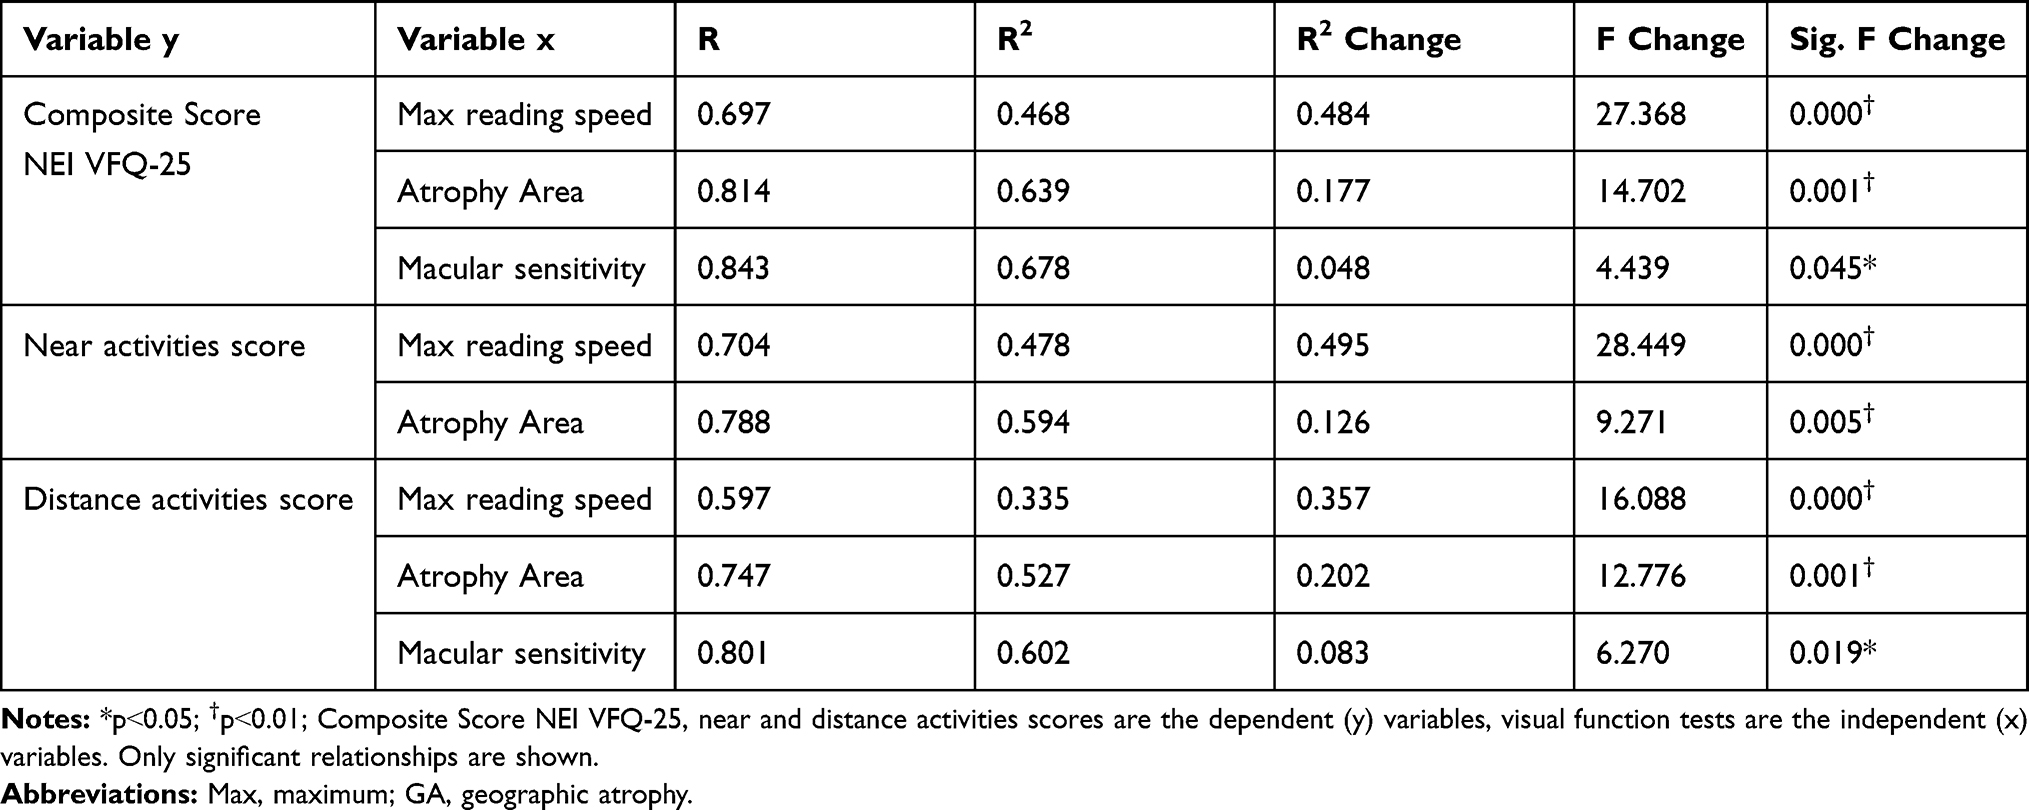 |
Table 7 Multiple Regression Analysis in GA Group |
Discussion
As the aging population continues to grow, geographic atrophy, the advanced form of dry AMD, looms large as a major cause of severe, central vision loss. Given the lack of treatment options to prevent GA, it is especially important to monitor closely for progression of GA and comprehensively evaluate visual function.38 The ultimate goal will be early intervention once an effective treatment is established. The consensus view on the combination of different metrics such as visual acuity, contrast sensitivity, reading speed, microperimetry, and psychometric questionnaires to assess visual impairment, has not been elucidated.32–34,39 Correlating visual function and multimodal imaging such as autofluorescence and SD-OCT is critically important in the clinical management of patients with dry AMD.8,31,40-43 We sought to comprehensively evaluate visual function in GA versus normal controls to better inform the evaluation of GA.
Visual Function Tests
Reductions in maximum reading rate, LLVA, and CS, and worse LLD, are considered significant predictors of subsequent vision loss. Furthermore, it has been suggested that these visual function measures be monitored more closely in patients with GA.17 As GA progresses, changes become evident in several visual functions before deterioration in BCVA occurs. We observed worse LLVA and BCVA in GA as compared to normal controls (p˂0.01) (Table 2). The average LLD was a reduction of 6 lines in patients with GA. LLVA and LLD are efficient measures to assess central cone-mediated function under conditions of reduced luminance.44 Deficits in LLVA are associated with higher rates of GA lesion progression.45
Patients with foveal-sparing GA may have scotomata encircling the fovea or in the parafoveal area but with fovea-involving GA, central scotomata may lead to eccentric fixation and PRL. Even though VA is reduced and some magnification is required, too much magnification will lead to some parts of the words within the atrophic area.46 We demonstrated the drop-off of the reading rate with letter size for eyes with GA compared to healthy eyes (p˂0.01) (Figure 1 and Table 2). Poor reading speed is a predictive marker of future deterioration in BCVA in patients with GA.17,19 Interestingly, critical point size (CPS) was similar in both groups - GA CPS = 0.9 logRAD (20/160) and CG CPS = 0.8 logRAD (20/125) (p = 0.214). Similar reading vision results (mean = 0.8 ± 0.2 logRAD) were found in patients with GA.47 The mean near visual acuity in GA was 0.29 ± 0.02 logMAR or 20/40 measured at 40 cm, which was better than the mean CPS of 20/160 measured at 32 cm. This result highlights that patients with GA are able to read small single letters but are more efficient reading with a larger size of letter (CPS). However, it has been reported that patients with GA can read newspaper print but they are unable to read large letters because they do not fit in the spare area.10 Due to the difficulties of the reading in patients with GA, there is a need to establish a recommended letter size. We demonstrated that the CPS is the best letter size for optimal visual efficiency. Some magnification is required but too much magnification causes difficulty with reading. Our results demonstrated that a reading letter size between 20/125 and 20/160 may be optimal for all patients – healthy eyes as well as those with geographic atrophy regardless of area of involvement.
The CSF allows us to measure visual impairment in eyes with GA.13–16 Patients with good VA may have poor CS, and it will be reflected in driving and reading difficulties, recognizing faces, and in dim-lit conditions.39 This study demonstrated a significant reduction of CS in patients with GA compared to healthy eyes (p ˂ 0.01) (Table 2 and Figure 2). Both CS and LLD are reliable measurements that detect abnormal visual function and help to determine the risk of VA loss in GA patients.17,48,49
The evaluation of macular function and retinal sensitivity,9,11,20-23 the measurement of extrafoveal fixation, PRL,24–27 and fixation stability28 by microperimetry are useful to simultaneously analyze anatomic and visual function in patients with GA. Microperimetric assessment of visual function has been significantly correlated to the progression of GA lesion area over two years.20 This study illustrated a decrease of macular sensitivity and fixation stability in eyes with GA as compared to healthy eyes (p˂0.01) (Table 2). Interestingly, a recent study demonstrated that visual rehabilitation via microperimetry may be effective in improving fixation stability, reading speed, and visual acuity after one week of training, but no improvement in retinal sensitivity was noted after training.50 Some studies reveal detail on changes in retinal sensitivity in the pathogenesis of GA. Regions of hyper-autofluorescence, large drusen, and over pigment abnormalities, have significantly lower sensitivity to light stimuli compared with regions of normal FAF.23 Hyper-autofluorescent regions outside the atrophic lesion represent areas of impaired photoreceptor function.49 We observed loss of retinal function together with a decrease of retinal sensitivity in areas with atrophic lesions, represented as dark areas of hypo-autofluorescence in the FAF (Figure 3).
Patient-Reported Outcome - NEI VFQ-25
This study demonstrated a decrease on the composite score in addition to a significant reduction in all subscales tested in the GA group compared with the control group (p ˂ 0.01) (Table 3). The composite score in the GA group was 46.7 (mean VA letter score 71, 20/40). Compared with NEI VFQ-25 composite scores in other studies such as: The Los Angeles Latino Eye Study 59.5 in late AMD (12 patients with GA, 17 patients with neovascular AMD), 79.4 for patients with early AMD and 80.7 for those without AMD,35 MARINA 69.3 (53.5 letters 20/80) and ANCHOR 69.9 (46.6 letters 20/125) in neovascular AMD,51 and last and uniquely GA patients the Phase 2 MAHALO study 61.7 (48 letters, 20/125),34 the composite score in our GA group was lower. Although our patients had better VA, the rest of the visual function measures showed worse results. They had better VA likely because 75% of the patients had foveal-sparing GA in our study. The control group composite score was 89.6 (20/16), which is comparable to other studies.35,52
Associations Between Visual Function Tests and NEI VFQ-25
In the GA group, moderate and strong correlations were found between the NEI VFQ-25 composite score, near and distance activities score with the atrophy area, maximum reading speed, maximum CS, fixation, and macular sensitivity (Table 4). In a previous trial, significant correlations between visual function tests and the vision-related quality of life test, vision core measure (VCM1), were identified in subjects with acquired macular disease.48 Recently, The Phase 2 MAHALO study reported correlations between NEI VFQ composite score and near and distance activities score, maximum binocular reading speed, and FRI index score in patients with GA.34 The highest correlation found was between the composite score and reading speed. This study was focused solely on GA and the most recent visual function tests used to evaluate progression and visual impairment in patients with GA: microperimetry, SD-OCT, FAF and the NEI VFQ-25, the gold standard quality of life test for AMD patients. Our study highlights expected deterioration in visual function with GA. With a larger area of GA, there is a greater reduction in reading speed, contrast sensitivity, macular sensitivity, and fixation stability, resulting in a poor score in the NEI VFQ-25, despite good central VA in many.
There were strong and moderate correlations in CG and GA groups together, for NEI VFQ-25 composite score, near and distance activities score with all visual function tests, except for the CST and CPS (Table 6). There is a lack of correlation between CST and the NEI VFQ-25 in both groups likely due to fovea sparing of GA until very advanced and due to generalized variability in CST. Surprisingly, there was no correlation identified for CPS. Although the GA group showed an important reduction in the reading speed measurements compared with CG, both were able to read a similar size of letter with maximum speed. Patients with GA may have a large area of atrophy but they would have less difficulty reading words if the words are of the CPS.
The results showed a strong relationship between the different scores and atrophy area. Reading speed tests results explained most of the variance in the NEI VFQ-25 composite score and near activities score, accounting for more than 48% (p ˂ 0.01) of the variance in each of these scores (Table 7). Difficulties in reading tasks are the most common complaints in patients with GA due to the critical importance of reading in varied daily activities. In addition to reading speed, macular sensitivity showed an important relationship with composite and distance activities scores; if we add macular sensitivity to the model, it would explain an additional 4.8% of the variation (p ˂ 0.05) in the composite score and 8.3% of the variation (p ˂ 0.05) in the distance activities score. Similar to our results, differences between self-reported visual performance and reading speed have been reported previously.48 The results showed that reading speed cannot be assumed to be the attribute on which readers base their perceived reading performance. In contrast to the study by Hazel et al, CS results did not reach significance in our regression analysis in the near activities score. This may be due to less specific reading questions in the NEI VFQ-25 than those used in the VCM1. In our study, there were 6 questions about reading whereas the VCM1 has 15 reading questions. The results of the CSF were not significant in the regression analysis; however we have demonstrated a strong correlation between the CSF and near activities in the GA group (Table 4). In the regression analysis, when the different variables were included progressively, the variability percentage did not increase with the inclusion of the CSF in the regression model likely because the other variables had a greater effect on the VFQ-25 than CS. Most of the clinical tests correlated highly with NEI VFQ-25 scores, but reading speed and atrophy area explained the majority of the variation in the GA patient-reported outcome.
Our study has several limitations. There was a notable difference in age between groups, as healthy patients who met the requirements and completed all tests, were younger than patients with GA. This was an observational study that did not prospectively and longitudinally evaluate the progressive decrease in the visual function. Longitudinal studies should be considered with all the metrics highlighted in this study to deeply assess the impact of GA progression on visual function. Some parameters differed from the definition used by the Age Related Eye Disease Study (AREDS) for GA. The current study did not divide GA into central and non-central atrophy groups. Another limitation of our study was the small cohort of patients; a larger cohort would allow us to obtain more robust results and divide GA into different groups based on FAF patterns. Despite these limitations, to the best of the authors’ knowledge, this is the first study to integrate the anatomic evaluation by OCT and FAF with the exhaustive functional evaluation including VA, LLVA, reading speed, CSF, macular microperimetry and quality of life questionnaire, in eyes with GA and normal, healthy eyes.
Conclusions
In conclusion, advanced AMD with GA causes a dramatic decrease of visual function and quality of life as a result of disease progression. The psychometric evidence supports that reading speed and macular microperimetry, in addition to the use of quality of life questionnaires, are useful measures in the evaluation and management of visual impairment in patients with GA. The typical evaluation with visual acuity testing and multimodal imaging may be inadequate to comprehensively evaluate the impact of GA on visual function.
Acknowledgments
Institute for Retina Research, Austin, Texas, United States - Provided material support. María Andreu-Fenoll, Ophthalmology Department, La Fe University Hospital, Valencia, Spain - Provided and cared for study patients. Néstor García-Marín, Ophthalmology Department, La Fe University Hospital, Valencia, Spain - Provided and cared for study patients.
Disclosure
No relevant financial or commercial relationship exists for any author.
References
1. Augood CA, Vingerling JR, de Jong PTVM, et al. Prevalence of age-related maculopathy in older europeans. the european eye study (EUREYE). Arch Ophthalmol. 2006;124(4):529–535. doi:10.1001/archopht.124.4.529
2. Buitendijk GHS, Rochtchina E, Myers C, et al. Prediction of age-related macular degeneration in the general population: the three continent AMD consortium. Ophthalmology. 2013. 120;12:2644–2655.
3. Nowak JZ. Amd-the retinal disease with an unprecised etiopathogenesis: in search of effective therapeutics. Acta Pol Pharm. 2014;71(6):900–916.
4. Rudnicka AR, Jarrar Z, Wormald R, Cook DG, Fletcher A, Owen CG. Age and gender variations in age-related macular degeneration prevalence in populations of european ancestry: a meta-analysis. Ophthalmology. 2012;119(3):571–580. doi:10.1016/j.ophtha.2011.09.027
5. Sacconi R, Corbelli E, Querques L, Bandello F, Querques G. A review of current and future management of geographic atrophy. Ophthalmol Ther. 2017;6(1):69–77. doi:10.1007/s40123-017-0086-6
6. Saksens NTM, Fleckenstein M, Schmitz-Valckenberg S, et al. Macular dystrophies mimicking age-related macular degeneration. Prog Retin Eye Res. 2014;39:23–57. doi:10.1016/j.preteyeres.2013.11.001
7. Spaide RF. Improving the age-related macular degeneration construct: a new classification system. Retina (Philadelphia, Pa). 2018;38(5):891–899. doi:10.1097/IAE.0000000000001732
8. Schmitz-Valckenberg S. The journey of “geographic atrophy” through past, present, and future. Ophthalmologica. 2017;237(1):11–20. doi:10.1159/000455074
9. Wu Z, Ayton LN, Guymer RH, Luu CD. Low-luminance visual acuity and microperimetry in age-related macular degeneration. Ophthalmology. 2014;121(8):1612–1619. doi:10.1016/j.ophtha.2014.02.005
10. Sunness J. Reading newsprint but not headlines: pitfalls in measuring visual acuity and color vision in patients with bullseye maculopathy and other macular scotomas. Retin Cases Brief Rep. 2008;2(1):83–84. doi:10.1097/IAE.0b013e31802fa25d
11. Hanout M, Horan N, Do DV. Introduction to microperimetry and its use in analysis of geographic atrophy in age-related macular degeneration. Curr Opin Ophthalmol. 2015;26(3):149–156. doi:10.1097/ICU.0000000000000153
12. Sunness JS, Gonzalez-Baron J, Applegate CA, et al. Enlargement of atrophy and visual acuity loss in the geographic atrophy form of age-related macular degeneration. Ophthalmology. 1999;106(9):1768–1779. doi:10.1016/S0161-6420(99)90340-8
13. Ginsburg AP. Contrast sensitivity and functional vision. Int Ophthalmol Clin. 2003;43(2):5–15. doi:10.1097/00004397-200343020-00004
14. Bansback N, Czoski-Murray C, Carlton J, et al. Determinants of health related quality of life and health state utility in patients with age related macular degeneration: the association of contrast sensitivity and visual acuity. Qual Life Res. 2007;16(3):533–543. doi:10.1007/s11136-006-9126-8
15. Monés J, Rubin GS. Contrast sensitivity as an outcome measure in patients with subfoveal choroidal neovascularisation due to age-related macular degeneration. Eye (Lond). 2005;19(11):1142–1150. doi:10.1038/sj.eye.6701717
16. McClure ME, Hart PM, Jackson AJ, Stevenson SM, Chakravarthy U. Br J Ophthalmol. 2000;84(3):244–250. doi:10.1136/bjo.84.3.244
17. Sunness JS, Rubin GS, Broman A, Applegate CA, Bressler NM, Hawkins BS. Low luminance visual dysfunction as a predictor of subsequent visual acuity loss from geographic atrophy in age-related macular degeneration. Ophthalmology. 2008;115(9):1480–1488. doi:10.1016/j.ophtha.2008.03.009
18. Sunness JS, Applegate CA, Haselwood D, Rubin GS. Fixation patterns and reading rates in eyes with central scotomas from advanced atrophic age-related macular degeneration and stargardt disease. Ophthalmology. 1996;103(9):1458–1466. doi:10.1016/S0161-6420(96)30483-1
19. Sunness JS, Rubin GS, Applegate CA, et al. Visual function abnormalities and prognosis in eyes with age-related geographic atrophy of the macula and good visual acuity. Ophthalmology. 1997. 104;10:1677–1691.
20. Meleth AD, Mettu P, Agrón E, et al. Changes in retinal sensitivity in geographic atrophy progression as measured by microperimetry. Invest Ophthalmol Vis Sci. 2011;52(2):1119–1126. doi:10.1167/iovs.10-6075
21. Midena E. Microperimetry. Arch Soc Esp Oftalmol. 2006;81(4):183–186.
22. Rohrschneider K, Bültmann S, Springer C. Use of fundus perimetry (microperimetry) to quantify macular sensitivity. Prog Retin Eye Res. 2008;27(5):536–548. doi:10.1016/j.preteyeres.2008.07.003
23. Schmitz-Valckenberg S, Bültmann S, Dreyhaupt J, Bindewald A, Holz FG, Rohrschneider K. Fundus autofluorescence and fundus perimetry in the junctional zone of geographic atrophy in patients with age-related macular degeneration. Invest Ophthal Vis Sci. 2004;45(12):4470–4476. doi:10.1167/iovs.03-1311
24. Crossland MD, Engel SA, Legge GE. The preferred retinal locus in macular disease. Retina. 2011;31(10):2109–2114. doi:10.1097/IAE.0b013e31820d3fba
25. Cheung S, Legge GE. Functional and cortical adaptations to central vision loss. Vis Neurosci. 2005;22(2):187–201. doi:10.1017/S0952523805222071
26. Fletcher DC, Schuchard RA. Preferred retinal loci relationship to macular scotomas in a low-vision population. Ophthalmology. 1997. 104(4):632–638.
27. Shima N, Markowitz SN, Reyes SV. Concept of a functional retinal locus in age-related macular degeneration. Can J Ophthalmol. 2010;45(1):62–66. doi:10.3129/i09-236
28. Luminita T, González E, Markowitz SN, Steinbach MJ. Fixation characteristics of patients with macular degeneration recorded with the MP-1 microperimeter. Retina. 2008;28(1):125–133. doi:10.1097/IAE.0b013e3180ed4571
29. Holz FG, Sadda SR, Busbee B, et al. Efficacy and safety of lampalizumab for geographic atrophy due to age-related macular degeneration: chroma and spectri Phase 3 randomized clinical trials. JAMA Ophthalmol. 2018;136(6):666–677. doi:10.1001/jamaophthalmol.2018.1544
30. Bandello F, Sacconi R, Querques L, Corbelli E, Cicinelli MV, Querques G. Recent advances in the management of dry age-related macular degeneration: a review. F1000Res. 2017;6:245. doi:10.12688/f1000research.10664.1
31. Fleckenstein M, Mitchell P, Freund KB, et al. The progression of geographic atrophy secondary to age-related macular degeneration. Ophthalmology. 2018;125(3):369–390. doi:10.1016/j.ophtha.2017.08.038
32. Finger RP, Fleckenstein M, Holz FG, Scholl HPN. Quality of life in age-related macular degeneration: a review of available vision-specific psychometric tools. Qual Life Res. 2018;17(4):559–574. doi:10.1007/s11136-008-9327-4
33. Slakter JS, Stur M. Quality of life in patients with age-related macular degeneration: impact of the condition and benefits of treatment. Surv Ophthalmol. 2005;50(3):263–273. doi:10.1016/j.survophthal.2005.02.007
34. Sivaprasad S, Tschosik E, Kapre A, et al. Reliability and construct validity of the NEI VFQ-25 in a subset of patients with geographic atrophy from the phase 2 mahalo study. Am J Ophthalmol. 2018;190:1–8. doi:10.1016/j.ajo.2018.03.006
35. Choudhury F, Varma R, Klein R, Gauderman WJ, Azen SP, McKean-Cowdin R. Age-related macular degeneration and quality of life in latinos: the los angeles latino eye study. JAMA Ophthalmol. 2016;134(6):683–690. doi:10.1001/jamaophthalmol.2016.0794
36. Mangione CM, Lee PP, Gutierrez PR, Spritzer K, Berry S, Hays RD. Development of the 25-item national eye institute visual function questionnaire. Arch Ophthalmol. 2001;119(7):1050–1058. doi:10.1001/archopht.119.7.1050
37. Kimel M, Leidy NK, Tschosik E, et al. Functional reading independence (FRI) index: a new patient-reported outcome measure for patients with geographic atrophy. Invest Ophthalmol Vis Sci. 2016;57(14):6298–6304. doi:10.1167/iovs.16-20361
38. Rosenfeld PJ. Preventing the growth of geographic atrophy: an important therapeutic target in age-related macular degeneration. Ophthalmology. 2018;125(6):794–795. doi:10.1016/j.ophtha.2018.02.027
39. Taylor D, Smith N, Binns A, Crabb D. The effect of non-neovascular age-related macular degeneration on face recognition performance. Graefes Arch Clin Exp Ophthalmol. 2018;256(4):815–821. doi:10.1007/s00417-017-3879-3
40. Ooto S, Suzuki M, Vongkulsiri S, Sato T, Spaide RF. Multimodal visual function testing in eyes with nonexudative age-related macular degeneration. Retina. 2015;35(9):1726–1734. doi:10.1097/IAE.0000000000000608
41. Lindner M, Nadal J, Mauschitz MM, et al. Combined fundus autofluorescence and near infrared reflectance as prognostic biomarkers for visual acuity in foveal-sparing geographic atrophy. Invest Ophthalmol Vis Sci. 2017;58(6):BIO61–BIO67. doi:10.1167/iovs.16-21210
42. Holz FG, Sadda SR, Staurenghi G, et al. Imaging protocols in clinical studies in advanced age-related macular degeneration: recommendations from classification of atrophy consensus meetings. Ophthalmology. 2017;124(4):464–478. doi:10.1016/j.ophtha.2016.12.002
43. Sayegh RG, Sacu S, Dunavölgyi R, et al. Geographic atrophy and foveal-sparing changes related to visual acuity in patients with dry age-related macular degeneration over time. Am J Ophthalmol. 2017;179:118–128. doi:10.1016/j.ajo.2017.03.031
44. Cocce KJ, Stinnett SS, Luhmann UFO, et al. Visual function metrics in early and intermediate dry age-related macular degeneration for use as clinical trial endpoints. Am J Ophthalmol. 2018;189:127–138. doi:10.1016/j.ajo.2018.02.012
45. Yehoshua Z, de Amorim Garcia Filho CA, Nunes RP, et al. Systemic complement inhibition with eculizumab for geographic atrophy in age-related macular degeneration. Ophthalmology. 2014;121(3):693–701. doi:10.1016/j.ophtha.2013.09.044
46. Sunness JS, Rubin GS, Zuckerbrod A, Applegate CA. Foveal-sparing scotomas in advanced dry age-related macular degeneration. J Vis Impair Blind. 2008;102(10):600–610. doi:10.1177/0145482X0810201004
47. Joussen AM, Joeres S, Fawzy N, et al. Autologous translocation of the choroid and retinal pigment epithelium in patients with geographic atrophy. Ophthalmology. 2007;114(3):551–560. doi:10.1016/j.ophtha.2006.08.016
48. Hazel CA, Petre KL, Armstrong RA, Benson MT, Frost NA. Visual function and subjective quality of life compared in subjects with acquired macular disease. Invest Ophthalmol Vis Sci. 2000;41(6):1309–1315.
49. Sadda SR, Chakravarthy U, Birch DG, Staurenghi G, Henry EC, Brittain C. Clinical endpoints for the study of geographic atrophy secondary to age-related macular degeneration. Retina. 2016;36(10):1806–1822. doi:10.1097/IAE.0000000000001283
50. Ramírez Estudillo JA, León Higuera MI, Rojas Juárez S, Ordaz Vera ML, Pablo Santana Y, Celis Suazo B. Visual rehabilitation via microperimetry in patients with geographic atrophy: a pilot study. Int J Retina Vitreous. 2017;3:21. doi:10.1186/s40942-017-0071-1
51. Suñer IJ, Kokame GT, Yu E, Ward J, Dolan C, Bressler N. Responsiveness of NEI VFQ-25 to changes in visual acuity in neovascular AMD: validation studies from two phase 3 clinical trials. Invest Ophthalmol Vis Sci. 2009;50(8):3629–3635. doi:10.1167/iovs.08-3225
52. Owen CG, Rudnicka AR, Smeeth L, Evans JR, Wormald RPL, Fletcher AE. Is the NEI-VFQ-25 a useful tool in identifying visual impairment in an elderly population? BMC Ophthalmol. 2006;6(1):24. doi:10.1186/1471-2415-6-24
 © 2020 The Author(s). This work is published and licensed by Dove Medical Press Limited. The
full terms of this license are available at https://www.dovepress.com/terms
and incorporate the Creative Commons Attribution
- Non Commercial (unported, 3.0) License.
By accessing the work you hereby accept the Terms. Non-commercial uses of the work are permitted
without any further permission from Dove Medical Press Limited, provided the work is properly
attributed. For permission for commercial use of this work, please see paragraphs 4.2 and 5 of our Terms.
© 2020 The Author(s). This work is published and licensed by Dove Medical Press Limited. The
full terms of this license are available at https://www.dovepress.com/terms
and incorporate the Creative Commons Attribution
- Non Commercial (unported, 3.0) License.
By accessing the work you hereby accept the Terms. Non-commercial uses of the work are permitted
without any further permission from Dove Medical Press Limited, provided the work is properly
attributed. For permission for commercial use of this work, please see paragraphs 4.2 and 5 of our Terms.