Back to Journals » Patient Preference and Adherence » Volume 20
Monetary Risk Preferences and Demand for Preventative Treatment: A Discrete Choice Experiment Among Individuals at High Risk for Lung Cancer
Authors Liu X ![]() , Smith IP
, Smith IP ![]() , Janssen EM
, Janssen EM ![]() , Mansfield C
, Mansfield C
Received 12 November 2025
Accepted for publication 28 January 2026
Published 11 February 2026 Volume 2026:20 576269
DOI https://doi.org/10.2147/PPA.S576269
Checked for plagiarism Yes
Review by Single anonymous peer review
Peer reviewer comments 2
Editor who approved publication: Dr Johnny Chen
Xiaoying Liu,1 Ian P Smith,2 Ellen M Janssen,3 Carol Mansfield4
1Population Studies Center, University of Pennsylvania, Philadelphia, PA, USA; 2Interventional Oncology, Johnson & Johnson External Innovation, New Brunswick, NJ, USA; 3Global Epidemiology, Janssen Research and Development, Titusville, NJ, USA; 4RTI Health Solutions, Research Triangle Park, NC, USA
Correspondence: Xiaoying Liu, Population Studies Center, 239 McNeil Building, University of Pennsylvania, 3718 Locust Walk, Philadelphia, PA, 19104-6298, USA, Email [email protected]
Purpose: People’s risk preferences may differ depending on the domain in which someone is taking the risk, influencing their demand for innovative medical treatment with uncertain future benefits. This study aims to examine how monetary risk preferences are associated with health risk preferences for a hypothetical lung cancer preventative treatment (one that reduces the chance of getting lung cancer) and the demand for other preventative treatments or measures.
Methods: A total of 803 individuals aged 50– 80 years at high risk of lung cancer completed a hypothetical investment exercise to measure monetary risk preference, as well as a discrete-choice experiment to measure health risk preference for lung cancer preventative treatment. They also answered questions about other preventative treatments or measures and screening tests they have taken.
Results: On average, respondents were willing to invest $67.40 (SD= $31.20) out of $100 in the hypothetical investment exercise. Given the presented levels of benefits and side effects of hypothetical treatment, 50.2% of the participants favored lung cancer preventative treatment, 29.2% were undecided, while 20.7% disliked it. Compared to those not willing to invest any amount, those willing to invest higher amounts were less likely to fall into the no-treatment group (OR=0.171 (p< 0.001) to 0.335 (p=0.049), depending on the investment amount category). Additionally, individuals who expressed greater willingness to invest were also more likely to have previously received other forms of preventative healthcare (OR=1.008, p=0.025).
Conclusion: Monetary risk preference is related with risk preferences in health and can predict demand for preventative treatments or measures.
Plain Language Summary: Monetary risk preference measures one’s tendency to make a risky investmentMonetary risk preference is associated with preference for a hypothetical preventative therapy for lung cancerMore monetary risk averse, less willing to try an innovative treatment and receive other preventative healthcare.
Keywords: risk aversion, risk perception, latent-class analysis, novel treatment
Introduction
Risk preference is important in shaping people’s behavior and decision-making.1 People’s willingness to accept risk can vary depending on the specific context or domain of the risk. In the financial domain, for example, it can refer to the tendency to engage in activities with greater variability in returns, such as investing in stocks or participating in lotteries.2 In the health domain, it may reflect a person’s willingness to undergo medical treatments with uncertain outcomes or to accept potential adverse events for the chance of clinical benefit. Understanding these health-related preferences is important when considering new treatments with limited evidence or preventative interventions where the risk of actually developing the condition is uncertain.
When an individual makes a health investment decision to follow a novel preventative treatment plan, they balance the expected benefits (including uncertainties in both the probability of developing the disease and the effectiveness of the treatment) against the potential risks of the treatment (which involve uncertainty of experiencing adverse events). As a result, the demand for preventative treatment depends on an individual’s risk preference and the uncertainties of both the treatment’s effectiveness and the probability of developing a disease. Using theoretical models, Picone et al proved that when a treatment is 100% effective, individuals’ demand for medical screening is positively correlated with their relative risk aversion.3 However, when a treatment is less effective, demand for the preventative screening test decreases as individuals’ relative risk aversion increases (ie, those who are more risk averse are less likely to use preventative screening tests). In a recent paper, Augeraud-Véron and Leandri also discuss the ambiguous effect of risk aversion on self-protection in facing uncertainty in the risk of disease and the conditions when risk aversion lowers self-protection and vice-versa.4 Therefore, the relationship between risk preference and demand for a novel preventative treatment is complex and remains an empirical question.
Although risk preference can be domain specific, research suggests that a general risk trait, alongside domain-specific attributes, may explain variance in risk preference across populations.2 General risk trait is defined as a latent, individual-level characteristic reflecting an individual’s overall propensity to engage in or avoid risk across contexts. This trait is assumed to be relatively stable over time and to influence decision-making in multiple domains, independent of domain-specific risk preferences.5 Risk perception, which is defined as an individual’s understanding of the risks and benefits associated with alternative courses of action,6 may not accurately reflect the true risk of an event and may differ across individuals and domains depending on one’s experience in any given domain. Attitude towards perceived risk reflects the degree of an individual’s inherent preferences for risk given the risk level that one perceives. After accounting for differences in domain-specific risk perception, attitudes towards perceived risk appear consistent across domains7 and may reflect an individual’s stable personality trait.
This paper aims to study if and how the demand for a novel preventative treatment is related to risk preference, or more specifically, monetary risk preference (ie, individual’s risk attitude specifically in monetary domain). We measure monetary risk preference by the amount an individual chose to invest in a hypothetical investment experiment and use it to proxy for general risk trait, since it represents the form of risk most familiar to individuals. We measure the demand for preventative treatment by asking if an individual would follow a novel plan that may reduce the likelihood of getting lung cancer in a Discrete Choice Experiment (DCE). The DCE method has been applied widely to elicit individuals’ preferences for medical treatment,8,9 preventative care in a health regime,10–12 and public health policy.13,14(see the paper by Soekhai et al15 for a review). In our DCE, individuals with a high risk of developing lung cancer were asked to choose among pairs of hypothetical preventative treatment profiles that can reduce the potential risk of developing lung cancer at the cost of upfront risks of adverse events, or to opt out of care and receive no preventative treatment. We also test if the monetary risk preference can explain the variation in respondents’ previous preventative measures they have received for other health problems. More specifically, we test the following two hypotheses:
Hypothesis 1. If an individual is more risk averse in monetary decision making, one is less likely to choose the hypothetical preventative treatment for lung cancer in the DCE. Hypothesis 2. If an individual is more risk averse in monetary decision making, one is less likely to have received other preventative treatment in real life.
Our study contributes to the literature studying the relationship between risk preference and preference for health care and treatment. The topic has received limited attention in the literature,16 with a few exceptions that examine how risk preference is correlated with screening tests.3,17 Studies suggest that more risk averse women are less likely to screen for breast cancer regularly17 and that less risk averse individuals are more likely to undergo testing.3 Lottery experiments have assessed how risk preferences correlate across health and financial domains.18,19 However, these lottery experiments involved dichotomous decisions between treatments characterized by only two possible outcomes (good vs bad health), each with different probability of good health days. This oversimplifies the complex tradeoffs patients face in real-life treatment options, which often involve a range of benefits and adverse events in different forms, and are better assessed using a DCE which can provide information about the heterogeneity of preference along a spectrum—for example, from definitely preferring treatment, to hesitancy, to definitely preferring no treatment. More broadly, this study may also help explain factors behind vaccine hesitancy, particularly toward the novel mRNA COVID-19 vaccines, for which global vaccine hesitancy rates are estimated at around 20–25%,20,21 largely driven by concerns related to their novelty22,23 and potentially affected by general risk tolerance.
Methods
Measurement of Monetary Risk Preference
Broadly speaking, risk preferences can be elicited using two types of methods:24 (1) self-reported questionnaire measures, such as single-item measures25 and domain-specific measures;7 and (2) incentivized experiments, mainly in the financial domain. Examples of incentivized experiments include lottery tasks, in which respondents decide between a set of lottery binary choices that can elicit both risk and time preferences,26,27 and investment tasks.24 We adopt a hypothetical investment task as in Gneezy and Potters (1997)24 to assess monetary risk preference. In this task, respondents were asked how much they would be willing to invest if given $100, assuming a 50% chance to earn 2.5 times the investment and a 50% chance to lose the entire investment. The probabilities and return rates in the experiment design are chosen so that the expected payoff from investment is higher than the payoff from zero investment. Time preference is not considered. Risk preference is measured directly by the invested amount as indicated by the respondent using a simple slider bar from $0 to $100. The smaller the investment amount one chooses, the more risk averse that person is.Moving away from 0 increases the gap in payoffs between win and loss, representing less risk aversion as it approaches 100 (Figure 1). The potential gain from investment and remaining money not invested were presented as the respondent moved the slider.
 |
Figure 1 Interface of the Investment Experiment. Notes: Figure 1 illustrates the interface a survey participant sees when answering the question how much they would like to invest in the investment experiment. In the online survey, respondents made investment choice by moving a cursor along a bar ranging from $0 to $100. For any investment amount chosen, the payment in each scenario (win vs lose) is shown at the top and the bottom of the cursor separately. The payment if winning equals to 100-x+2.5x, and the payment if losing equals to 100 – x, where x is the investment amount where the cursor is placed on the bar. For example, the above figure shows if a respondent chose $65, s/he would get $197.5 in the scenario of winning, and $35 in the scenario of loss. |
Measurement of Risk Preference in the Health Domain and Risk Perceptions
We elicit risk preference in the health domain using a DCE design with statistical properties including D-efficiency, attribute level balance, and orthogonality in SAS v9.4.28 Respondents were asked to make a binary choice among each of 8 pairs of hypothetical preventative treatment profiles that can reduce the potential risk of developing lung cancer at the cost of upfront risks of adverse events, or to opt out of care and receive no preventative treatment. The hypothetical treatments are defined by 4 attributes—the relative risk reduction of lung cancer, the risk of injection-site reaction, the risk of nonfatal serious infection, and the risk of death from serious infection – with varying levels (Table 1). These 4 attributes were chosen after conducting qualitative interviews with 23 participants of high risk of lung cancer, reviewing clinical trial reports, and evaluating stakeholders’ opinions. As part of the survey, respondents were randomly assigned to 1 of 3 assumed baseline risks of developing lung cancer: 6%, 10%, or 16% over 3 years, in order to explore impact of different levels of baseline risks for whom interception treatments might be developed according to expert opinion. Additional information on the DCE development and cognitive pre-testing can be found in a previously published manuscript.29
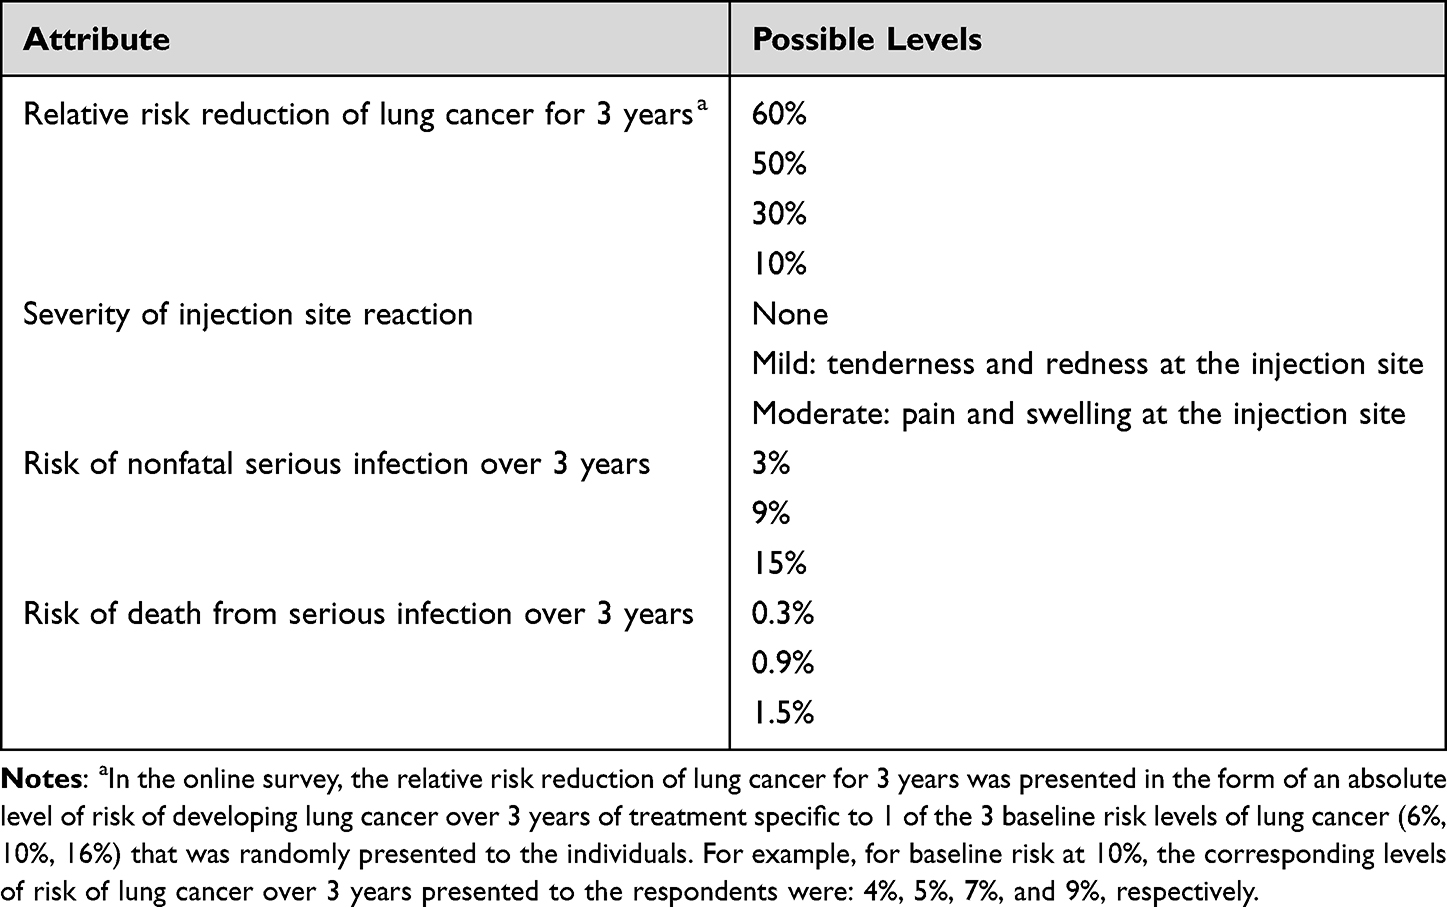 |
Table 1 Attributes and Levels for the Discrete-Choice Experiment Survey |
We also ask respondents about preventative measures they have received for other health problems, including screening tests for early detection of cancer (eg, mammograms to screen for breast cancer in females; prostate-specific antigen tests to screen for prostate cancer in males; colonoscopies or other colon screening tests), preventative treatments (eg, flu shots, the COVID-19 vaccine), or other measures to avoid contracting disease. In contrast to the hypothetical preventative treatment for lung cancer, these are the observed health behaviors that one has or has not undertaken.
Respondents also reported their perceived average risk of getting lung cancer caused by smoking, individual risk of getting lung cancer, and concerns about side effects of treatment. Perception of general harm caused by smoking is measured by asking how much a respondent agrees with the statement that smoking causes lung cancer, using a 5-point Likert scale (range:1 = strongly disagree, 5 = strongly agree). Perception of the individual’s risk of getting lung cancer is measured in 2 ways: an absolute risk of getting lung cancer, and a relative risk of getting lung cancer compared with the average smoker in the US. For the absolute risk, respondents were randomly assigned at the beginning of the survey to 1 of 3 baseline risks of developing lung cancer: 6%, 10%, or 16%. For the relative risk, respondents were asked to select 1 out of 4 categories: 1 = lower than average, 2 = same as the average, 3 = higher than the average, 4 = not sure. Concerns about each of side effects of the preventative treatment in the DCE (injection-site reaction, severe infection that leads to hospitalization, and risk of death) were measured using a 5-point Likert scale (range: 1 = not concerned at all, 5 = extremely concerned).
Table A.1 in Appendix A includes a summary of the definitions of all the above measures of monetary risk preference, risk preference in the health domain, and the perceived risks in the context, as well as the measurements used in this paper.
Statistical Methods
We conduct 2 analyses in this study. One is a latent-class model analysis on DCE data to explore heterogeneity on preventative treatment for lung cancer.30 The other is a series of logit analyses to explore whether monetary risk preference was associated with taking other preventative measures. All statistical analyses were conducted using Stata/MP version 17.
Latent-Class Model of DCE
To facilitate analysis, we first effect-code levels for all attributes in the DCE, with the mean of all the levels for each attribute normalized to be 0.31 We also include a treatment alternative specific constant (ASC), with 1 indicating a treatment option is chosen and 0 for status-quo. The dependent variable is the binary choice made within each pair of profiles: 1 if yes to choose the treatment, 0 otherwise. The utility function of each alternative is modelled as an additive sum of utility from each attribute. The model clustered respondents into classes representing different preference profiles that reflect common or shared preferences and tested if respondent characteristics including monetary risk preference was predictive of class association. We conducted simulated maximum likelihood estimation (Appendix A2).
Logit Analysis of the Association Between Other Preventative Care and Risk Preferences in the Financial Domain
Besides preferences for the hypothetical preventative treatment, we explore whether monetary risk preference can predict if a respondent has received other screening tests or preventative healthcare measures. We conduct logit analysis on each of these screening tests and preventative care measures, and a binary indicator if the respondent has ever received any in each category (ie, screening tests, preventative care, measures to avoid Covid-19). We include two sets of predictors. The first set includes individual monetary risk preference, and the demographic and socioeconomic characteristics. To test whether the association between preventative health measures and the individual’s monetary risk preference is robust after controlling for other health-related variables, we estimate a second model that includes other health-related variables (eg, personal history of other cancers or chronic obstructive pulmonary disease (COPD); health insurance; chronic health problems other than risk factors for lung cancer).
The study protocol was reviewed by the RTI International institutional review board and deemed exempt from full review. All survey respondents provided informed consent electronically.
Results
Data
A sample recruited from an online panel consisted of 803 individuals in the US considered at high risk of developing lung cancer and eligible for screening according to the US Preventive Services Task Force due to their age (50 to 80 years) and smoking status (20 pack-year smoking history and currently smoke or have quit within the past 15 years as high risk group for lung cancer, where a pack-year is the equivalent of smoking 1 pack per day for 1 year).32 All data were self-reported and stratified by respondents’ race and ethnicity, smoking status, and presence of other risk factors for lung cancer. Recruitment took place between July and September 2022. Originally a total of 838 individuals met the eligibility criteria and provided consent. Of those, 35 participants were excluded from the analysis, among whom 6 completed the survey in under 6 minutes, and 29 showed no response variability on the DCE question (consistently selecting either treatment A or treatment B). Respondents were current smokers (492 [61.3%]) or former smokers who quit smoking within the past 15 years (311 [38.7%]); to be eligible for the study, respondents had to have at least a 20-pack-year smoking history but no history of lung cancer. Among the 492 current smokers, 357 (72.6%) had tried to quit smoking at some point. The average pack-year count of the sample is 41.8 (standard deviation [SD], 22.7). The sample is racially and ethnically diverse, with half of the participants identifying as White, and the distribution among non-White participants closely mirroring that of smoking adults in the US.33,34 The sample has a mean age of 63 years (SD, 7.5), with 62% female. Basic data on respondents are described in Table 2. Additional statistics are provided in Table B1 in Appendix B.
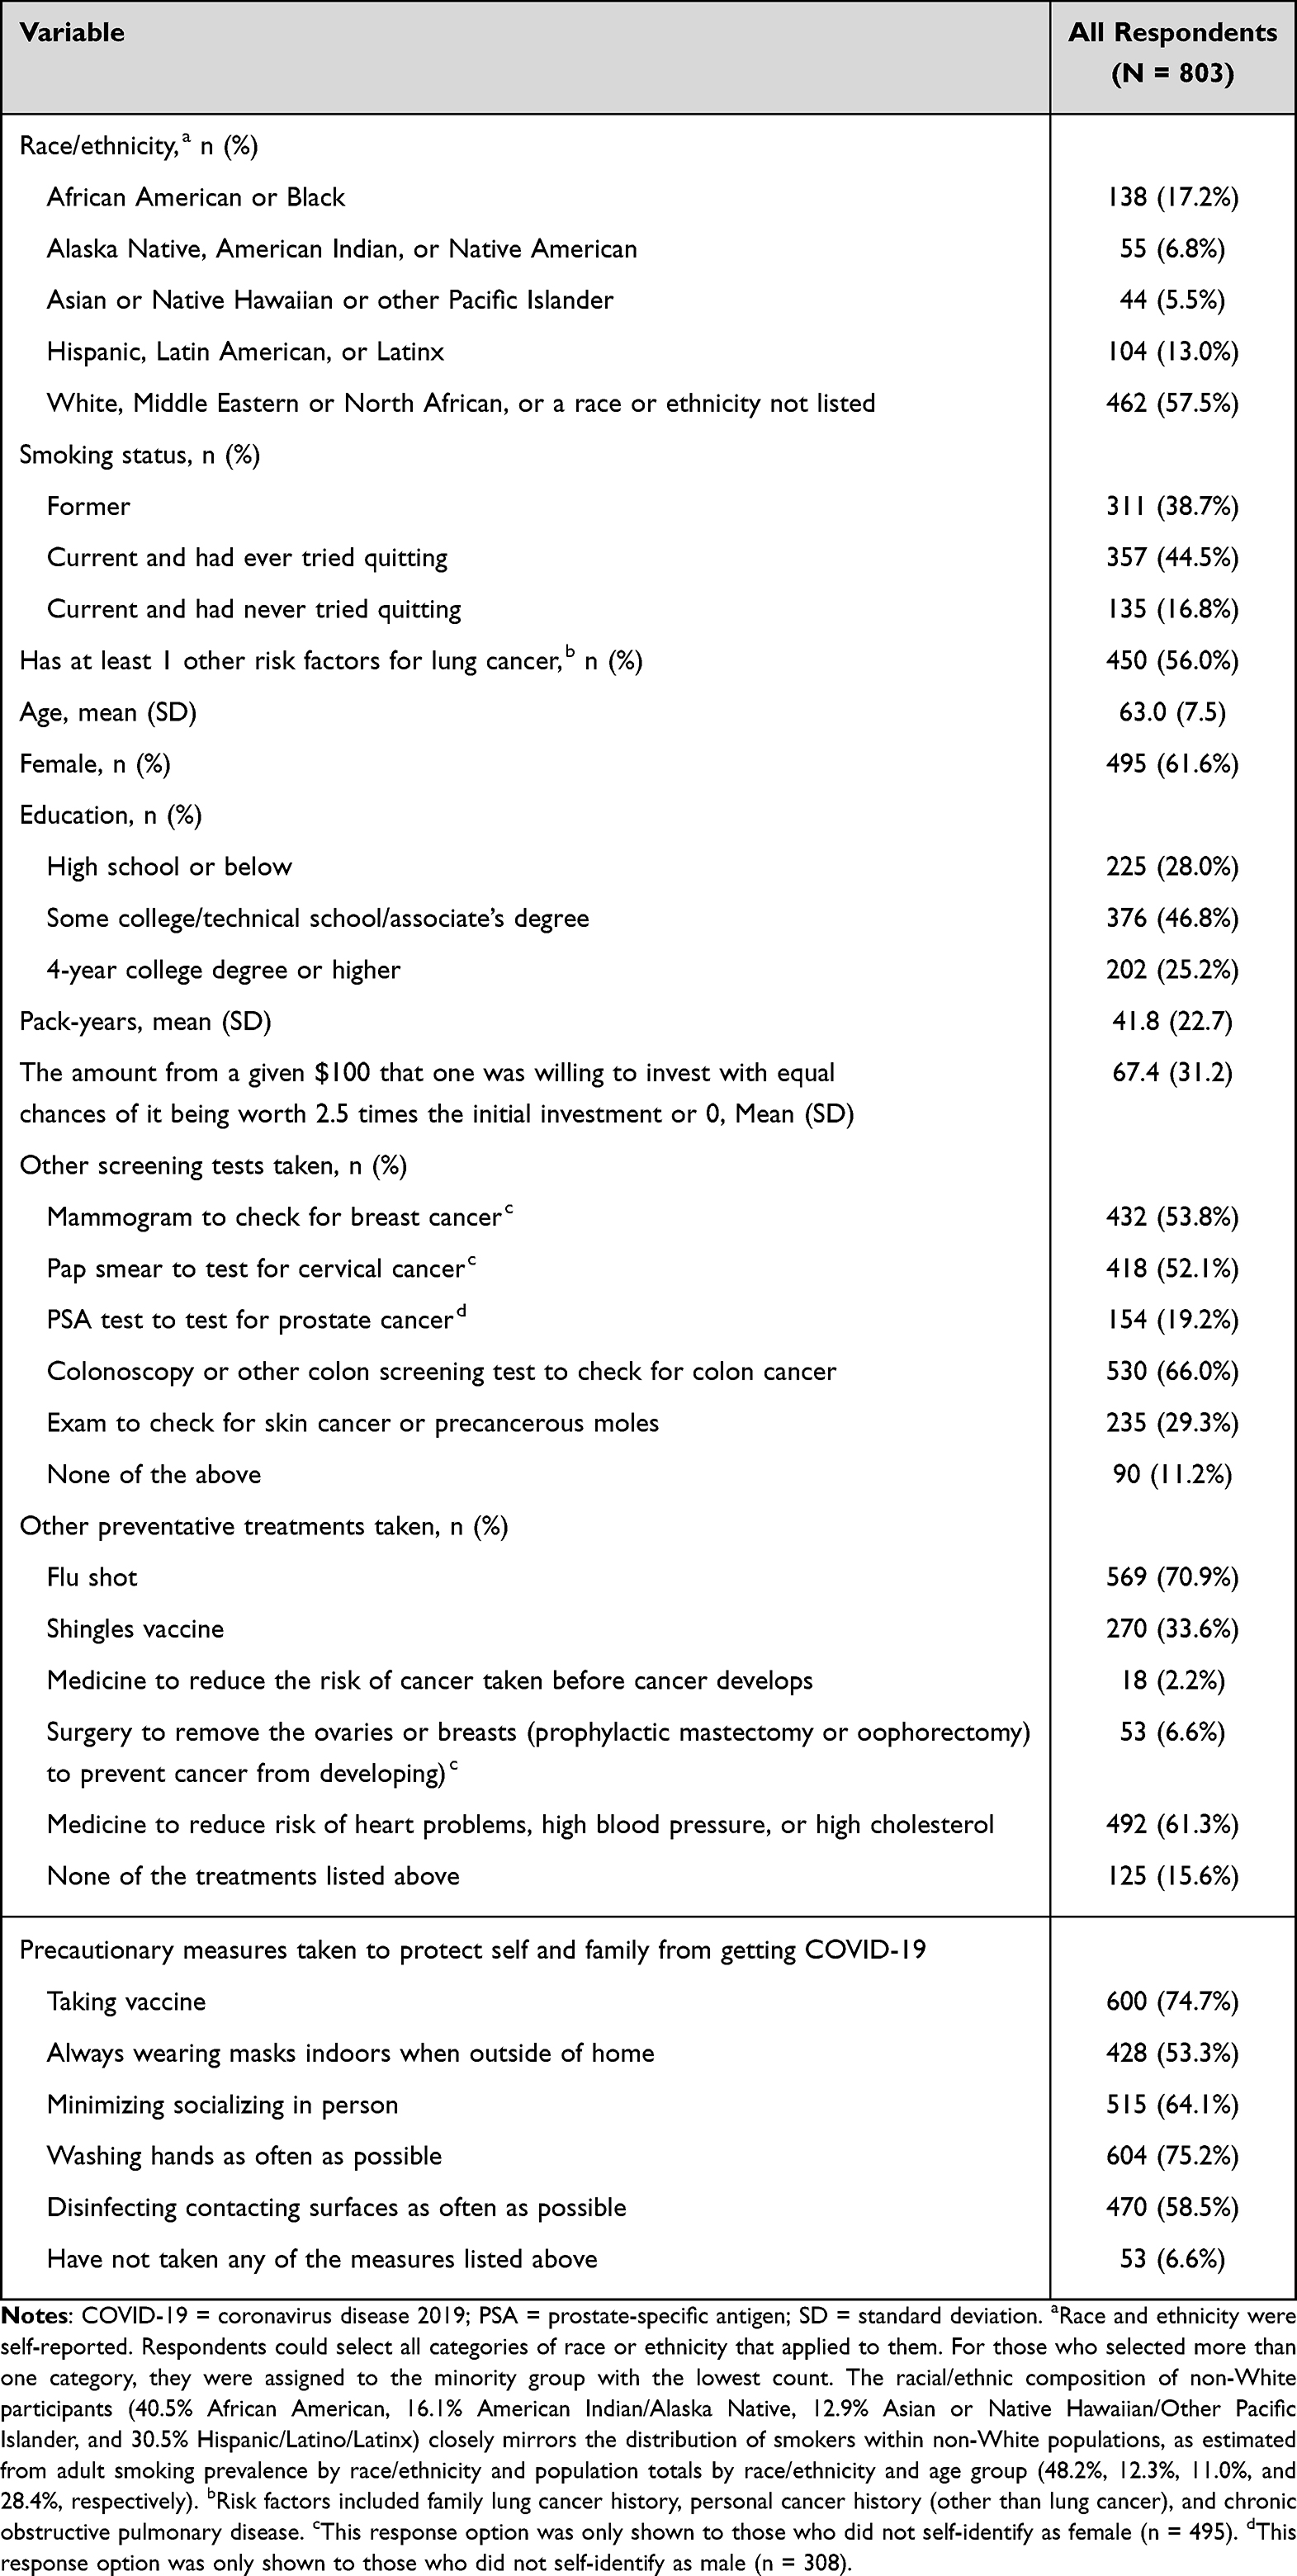 |
Table 2 Summary Statistics |
In terms of monetary risk preference, more than one-quarter of respondents chose to invest $100, which categorizes them as risk neutral/risk seeking. Given that investment amounts follow a trimodal distribution, with modes at $0, $50, and $100, and remaining values evenly distributed between these points (Figure 2), we categorize the sample into 5 groups with different monetary risk preferences: $0, $1 to $45, $46 to $55, $56 to $99, and $100. On average, respondents were willing to invest $67.40 (SD, $31.20).
 |
Figure 2 Distribution of the Investment Amount. Notes: This figure illustrates the distribution of the investment amount out of a given $100 that the survey respondents chose in the investment experiment. |
In terms of health risk perception, 84% of respondents agreed or strongly agreed that smoking causes lung cancer. Just over half (54%) thought they had the same risk of developing lung cancer as the average smoker in the US, while approximately 22% thought their risk was lower, and 13% thought their risk was higher.
Latent-Class Analysis of Preference for Preventative Treatment
Latent Classes and Preference Heterogeneity
Latent-class analysis of the DCE data grouped respondents into three classes based on preferences for attributes of a hypothetical preventative treatment, as determined by the Bayesian information criterion (BIC).35 According to the preference weights and relative importance of each attribute by class (Figure A.1a and Figure A.1b in Appendix B, and Appendix A3 for interpretation), these three classes can be identified as follows: Class 1 (“pro-treatment,” 50.2% of the sample) values treatment effectiveness most, being highly sensitive to risk reduction and willing to accept higher risks of adverse events for greater efficacy. Class 2 (“treatment-hesitant,” 29.2% of the sample) signals mild reluctance unless the benefit-risk profile is compelling; this group equally values treatment effectiveness and the risk of death from serious infection over three years. Class 3 (“no-treatment,” 20.7% of the sample) generally rejects the treatment, limiting insights into their benefit-risk tradeoffs or attribute priorities.
Class Membership Prediction
The results of the class membership prediction are presented in Figure 3 and Table B.2. Class 1 serves as the reference category, and the coefficients on the other classes are presented relative to the coefficients on Class 1. Covariates with positive coefficients are associated with increased likelihood of being in the class relative to Class 1. For example, older people would be more likely to be in Class 3 relative to Class 1 as age has a positive and significant effect.
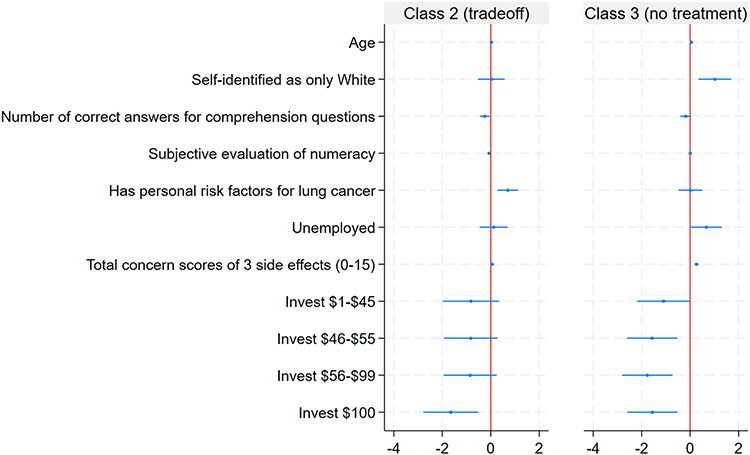 |
Figure 3 3-Class Latent-Class Model Membership Prediction Coefficients. Notes: This figure plots the coefficients that significantly predict at least one class membership (except the constant term) in the 3-class latent class analysis model. Class 1 (pro-treatment class) is used as the reference. Each coefficient represents the change in the probability of being in Class 2 (or Class 3) relative to Class 1 in association with 1 unit change in the independent variable. Dots represent the means of the coefficients and bars represent the confidence intervals at 95% significance level. Negative coefficients indicate that individuals with that characteristics were less likely to be assigned to the Class relative to Class 1. The complete results are presented in Table B.2 of Appendix B. |
Results indicate that perceived risks play a limited role in predicting the demand for preventative treatment. People with different perceived risks of getting lung cancer relative to the average smoker in the US (smaller, same, or larger) do not have different probabilities of preference class membership. Individuals who were randomly assigned to a 10% or 16% baseline risk of getting lung cancer without preventative treatment do not significantly differ in class membership prediction from those assigned a baseline risk of 6%. In addition, the belief that smoking causes lung cancer is not significantly associated with class membership at the 5% level. On the other hand, respondents who had greater concern about the side effects of the preventative treatment are more likely to be in Class 3 (the no-treatment class). In summary, risk perception of the likelihood of getting lung cancer does not predict the preference class membership for preventative care, while perceived risks of adverse events from the treatment are associated with individuals’ preferences.
Second, monetary risk preference is strongly significantly correlated with class membership, even after controlling for risk perception and other demographic and socioeconomic characteristics. Compared with those who are extremely risk averse ($0 investment), those who are less risk averse ($1-45, $46-55, or $56-99 investment groups) and those who are risk neutral or risk seeking ($100 investment) are less likely to be in Class 3 relative to Class 1, with coefficients on Class 3 membership prediction ranging from –1.093 (SD, 0.557) to –1.766 (SD, 0.532). In other words, compared to those who are not willing to invest any amount, the odds ratio of being in Class 3 for those who are willing to invest any positive amount are all significant and less than 1 (0.171–0.335, depending on the investment category). Moreover, the gradient of the monetary risk preference on the likelihood of being in Class 3 in general increases with the investment amount (ie, the coefficients on the higher investment amount category are generally larger). Those who are willing to invest $100 are also less likely to be in Class 2 relative to Class 1. In other words, compared with those who are risk averse, those who are risk neutral/risk seeking in the financial domain are more likely to be in the pro-treatment class, while those who are extremely risk averse are more likely to be in the no-treatment class.
Monetary Risk Preference and Other Healthcare Measures
Figure 4 and Table B.3 in Appendix B present the odds ratios from a series of logit models exploring how engaging in different types of preventative healthcare activities correlates with the continuous investment amount. For each dependent outcome variable, we control for demographic characteristics (specification 1) as well as other health status (specification 2).
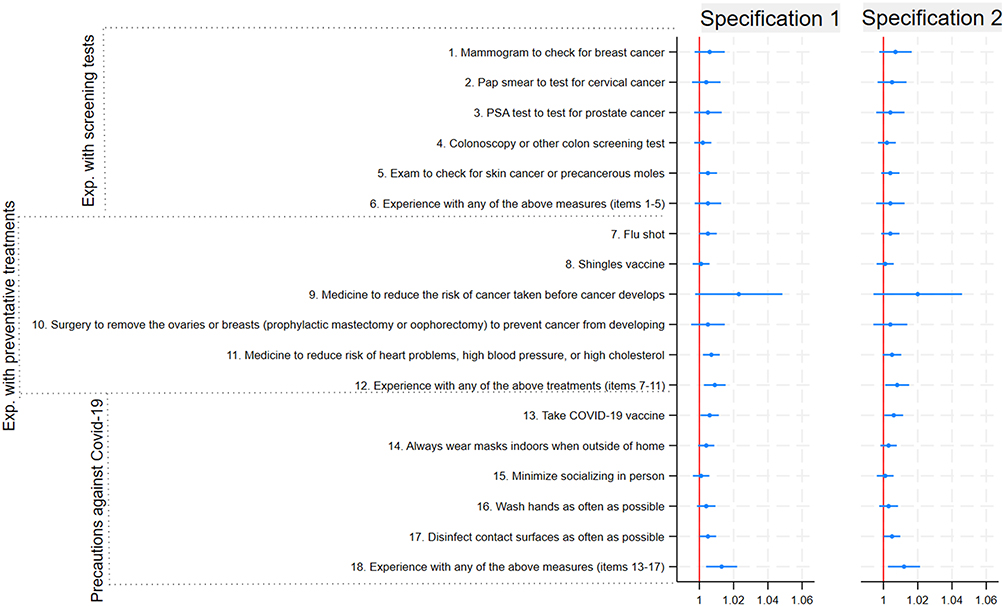 |
Figure 4 Odds Ratio of the Associations Between Monetary Risk Preference and Other Preventative Care Measures. Notes: Figure 4 plots the odds-ratios of a series of Logit regressions of other preventative care measures on monetary risk preference, while controlling for other confounders. Each coefficient represents the odds-ratio associated with a one-dollar increase in investment for undertaking the corresponding preventative measure. Dots represent the means of the odds-ratio and bars represent the confidence intervals at 95% significance level. Specification 1 controls demographic characteristics only, while specification 2 controls other health status besides the demographic characteristics included in Specification 1. The complete results are presented in Table B.3. of Appendix B. |
Results from the two specifications are similar. Those who are willing to invest more are more likely to have received other preventative care measures (OR, 1.008) and have taken measures to avoid getting COVID-19 (OR, 1.012). This means that each additional 10 dollars contributed is associated with a 1.05% higher probability of receiving other preventative care measures from the sample mean, and 0.73% of taking measures to avoid COVID-19. We also find that individuals with a higher investment amount are more likely to get COVID-19 vaccines (OR, 1.006, 1.13% higher in absolute probability per 10 dollars) and also more likely to take medicine to reduce risk of heart problems, high blood pressure, or high cholesterol (OR, 1.005, 1.18% higher in absolute probability per 10 dollars). These data support the idea that monetary risk preference is associated with risk preference in the health domain, not only for the hypothetical novel preventative treatment but also in decisions about the COVID-19 vaccine or other existing preventative treatments.
Discussion and Conclusion
This observational study explored the association between monetary risk preference and demand for a preventative treatment, using a DCE setting in which individuals made choices between receiving novel preventative treatments with uncertainties in both benefits and adverse events and choosing no treatment in hypothetical scenarios. We measure monetary risk preference using the amount one is willing to invest in a hypothetical investment experiment. We use a latent-class analysis for the DCE data to examine whether monetary risk preference predicts health preference class membership.
We find more risk-tolerant individuals in financial decision-making have higher demand for hypothetical preventative treatment for lung cancer in the DCE, and are more likely to take other types of preventative treatments in observational data. We also find risk perception of getting lung cancer (either in terms of randomly assigned baseline risk or in terms of the perceived relative likelihood compared to the average) is not significantly associated with the demand for preventative treatment, while the perceived risks of adverse events from the treatment are. Moreover, we also find that, after factoring out the risk perceptions, risk preference in the financial domain is still related to risk preference in the health domain. This provides evidence that there exists a stable personality trait that reflects one’s attitude towards risk irrespective of domain.5,19
From a public health perspective, in which the risk of developing a future health condition might the considered, the results of this study might seem counterintuitive. However, the relationship between monetary risk aversion and aversion to accept preventative treatment observed in this study is consistent with Picone et al’s prediction that individual’s demand for preventative treatment with uncertain benefits and risks decreases with relative risk aversion,3 especially for the preventative treatment in the study and Covid-19 vaccine that bear much higher uncertain benefits and risks than other conventional screening tests and flu shot. Risk-averse individuals may sometimes engage in less prevention, because they view investing in efforts that may not pay off as a risky proposition.4 Future research should examine these risk perceptions as potential explanatory factors to understand risk aversion.36
A limitation of our study concerns the lack of representativeness of the sample, which weakens the generalizability of our findings. First, the sample is composed of people who aged between 50 and 80. Although the relationship between risk aversion and age is not definite and there may exist a nonlinear relationship,37 older populations are generally more risk averse than younger individuals.1 Second, our sample consists of individuals who have a long smoking history (at least 20 pack-years) and have not been diagnosed with lung cancer. There may exist a survival bias: those who have been diagnosed with lung cancer (especially at an early stage) may have been more likely to take lung cancer screening tests than the ones in our sample. If they have systematically higher risk aversion, the association found in our study may be biased downward. Moreover, all the data, including smoking history, are self-reported. When we interpret the results, we should keep these limitations in mind.
The hypothetical investment experiment used in this study may oversimplify the measurement of risk preference in the financial domain. Respondents may have no incentive to report their investment decisions truthfully in this hypothetical scenario, which does not involve real payment. However, real payment would have made the survey too expensive to implement on such a large scale. There exist several different methods for eliciting risk preferences that have been applied in self-reported questionnaires, each with advantages and disadvantages (please refer to a study by Charness et al38 for a comprehensive review). Coppola compares 3 types of elicitation methods (11-point Likert scale, DOSPERT scale, and lottery tasks) for risk preference using the same set of data collected in a survey-based project and finds that all methods are valid and consistent with each other.39 Although in Coppola’s paper, lottery-based measures exhibit weak predictive validity in terms of five risk-related behaviors in four domains, smoking is the only risky behavior in the health domain included in the study.39 Our work complements the study by showing that an investment-based measure has predictive validity in terms of choices made in the health domain that involve risk. Moreover, due to methodological constraint, we could not distinguish between risk neutral and risk seeking individuals. Future research should try different measurements that can reflect risk preferences in a full spectrum.
In conclusion, risk preference in the financial domain is found to be associated with risk preference in the health domain and can predict preferences for a preventative treatment with an uncertain benefit. People who are less risk averse in the financial domain are more likely to receive other preventative healthcare and more willing to try a novel medical treatment with uncertain future benefits. Understanding individuals’ preferences for preventative treatments with greater uncertainty, and how these choices are made, can inform clinicians and policy-makers in personalizing treatment decisions and designing policies that increase the uptake of novel treatments and preventative care.40 More efforts should be directed to risk communication regarding the safety of the treatments and potential side effects, and tailor promotional campaigns to specific groups with a higher likelihood of early adoption, thereby generating momentum for a novel treatment.
Data Sharing Statement
Study data will not be shared.
Ethics Approval and Informed Consent
The study protocol was reviewed by the RTI International institutional review board and deemed exempt from full review. All survey respondents provided informed consent electronically.
Acknowledgments
The authors thank Anna Pierce for providing research support in data analysis and Kimberly Moon for overall project management.
Funding
The study design and data collection were funded by Johnson & Johnson External Innovation.
Disclosure
- Financial competing interests
Dr Liu was a full-time employee of RTI Health Solutions and compensation was unconnected to the projects on which Dr Liu worked during the conduct of the study. Dr Smith reported personal fees from Janssen Pharmaceutical outside the submitted work. Dr Janssen reported being a Johnson & Johnson employee during the conduct of the study; and being a Johnson & Johnson stockholder and employee outside the submitted work. Dr Mansfield was a full-time employee of RTI Health Solutions and compensation was unconnected to the projects on which Dr Mansfield worked during the conduct of the study. No other disclosures were reported.
Xiaoying Liu was an employee at RTI Health Solutions when the work was done for the manuscript.
References
1. Schildberg-Hörisch H. Are risk preferences stable? J Econ Perspect. 2018;32(2):135–13. doi:10.1257/jep.32.2.135
2. Mata R, Frey R, Richter D, Schupp J, Hertwig R. Risk preference: a view from psychology. J Econ Perspect. 2018;32(2):155–172. doi:10.1257/jep.32.2.155
3. Picone G, Sloan F, Taylor D. Effects of risk and time preference and expected longevity on demand for medical tests. J Risk Uncertain. 2004;28(1):39–53. doi:10.1023/B:RISK.0000009435.11390.23
4. Augeraud-Véron E, Leandri M. Optimal self-protection and health risk perceptions: exploring connections between risk theory and the health belief model. Health Econ. 2024;33(7):1565–1583. doi:10.1002/hec.4826
5. Frey R, Pedroni A, Mata R, Rieskamp J, Hertwig R. Risk preference shares the psychometric structure of major psychological traits. Sci Adv. 2017;3(10):e1701381. doi:10.1126/sciadv.1701381
6. Fischhoff B, Bostrom A, Quadrel MJ. Risk perception and communication. Annu Rev Public Health. 1993;14:183–203. doi:10.1146/annurev.pu.14.050193.001151
7. Weber EU, Blais AR, Betz NE. A domain-specific risk-attitude scale: measuring risk perceptions and risk behaviors. J Behav Decis Mak. 2002;15(4):263–290. doi:10.1002/bdm.414
8. Neal DE, Feit EM, Etzkorn JR. Patient preferences for the treatment of basal cell carcinoma: a mapping review of discrete choice experiments. Dermatol Surg. 2018;44(8):1041–1049. doi:10.1097/DSS.0000000000001564
9. Kowal M, Douglas F, Jayne D, Meads D. Patient choice in colorectal cancer treatment – a systematic review and narrative synthesis of attribute-based stated preference studies. Colorectal Dis. 2022;24(11):1295–1307. doi:10.1111/codi.16242
10. Mansfield C, Tangka FKL, Ekwueme DU. Stated preference for cancer screening: a systematic review of the literature, 1990–2013. Prev Chronic Dis. 2016;13. doi:10.5888/pcd13.150433
11. Harrison M, Spooner L, Bansback N, et al. Preventing rheumatoid arthritis: preferences for and predicted uptake of preventive treatments among high risk individuals. PLoS One. 2019;14(4):e0216075. doi:10.1371/journal.pone.0216075
12. Lieberz D, Bishop T, Rohde M, et al. Developing patient-centered preventative care to reduce mobility disability with aging: preferences from a discrete choice experiment. J Geriatr Phys Ther. 2024;47(1):36. doi:10.1519/JPT.0000000000000380
13. Nicolet A, Perraudin C, Wagner J, et al. Patient and public preferences for coordinated care in switzerland: development of a discrete choice experiment. Patient. 2022;15(4):485–496. doi:10.1007/s40271-021-00568-2
14. Regmi K, Kaphle D, Timilsina S, Tuha NAA. Application of discrete-choice experiment methods in tobacco control: a systematic review. PharmacoEconomics. 2018;2(1):5–17. doi:10.1007/s41669-017-0025-4
15. Soekhai V, de Bekker-Grob EW, Ellis AR, Vass CM. Discrete choice experiments in health economics: past, present and future. PharmacoEconomics. 2019;37(2):201–226. doi:10.1007/s40273-018-0734-2
16. Russo S, Jongerius C, Faccio F, et al. Understanding patients’ preferences: a systematic review of psychological instruments used in patients’ preference and decision studies. Value Health. 2019;22(4):491–501. doi:10.1016/j.jval.2018.12.007
17. Goldzahl L. Contributions of risk preference, time orientation and perceptions to breast cancer screening regularity. Soc Sci Med. 2017;185:147–157. doi:10.1016/j.socscimed.2017.04.037
18. Prosser LA, Wittenberg E. Do risk attitudes differ across domains and respondent types? Med Decis Making. 2007;27(3):281–287. doi:10.1177/0272989X07300602
19. Galizzi MM, Miraldo M, Stavropoulou C. In sickness but not in wealth: field evidence on patients’ risk preferences in financial and health domains. Med Decis Making. 2016;36(4):503–517. doi:10.1177/0272989X15626406
20. Lazarus JV, Wyka K, White TM, et al. Revisiting COVID-19 vaccine hesitancy around the world using data from 23 countries in 2021. Nat Commun. 2022;13(1):3801. doi:10.1038/s41467-022-31441-x
21. Lazarus JV, Wyka K, White TM, et al. A survey of COVID-19 vaccine acceptance across 23 countries in 2022. Nat Med. 2023;29(2):366–375. doi:10.1038/s41591-022-02185-4
22. Leong C, Jin L, Kim D, Kim J, Teo YY, Ho TH. Assessing the impact of novelty and conformity on hesitancy towards COVID-19 vaccines using mRNA technology. Commun Med. 2022;2(1):61. doi:10.1038/s43856-022-00123-6
23. Liu J, Kassas B, Lai J, Kropp J, Gao Z. Understanding the role of risk preferences and perceptions in vaccination decisions and post-vaccination behaviors among U.S. households. Sci Rep. 2024;14(1):3190. doi:10.1038/s41598-024-52408-6
24. Gneezy U, Potters J. An experiment on risk taking and evaluation periods. Q J Econ. 1997;112(2):631–645. doi:10.1162/003355397555217
25. Dohmen T, Huffman D, Schupp J, Falk A, Sunde U, Wagner GG. Individual risk attitudes: measurement, determinants, and behavioral consequences. J Eur Econ Assoc. 2011;9(3):522–550. doi:10.1111/j.1542-4774.2011.01015.x
26. Andersen S, Harrison GW, Lau MI, Rutström EE. Eliciting risk and time preferences. Econometrica. 2008;76(3):583–618. doi:10.1111/j.1468-0262.2008.00848.x
27. Eckel CC, Grossman PJ. Sex differences and statistical stereotyping in attitudes toward financial risk. Evol Hum Behav. 2002;23(4):281–295. doi:10.1016/S1090-5138(02)00097-1
28. Kuhfeld WF. Experimental design, efficiency, coding, and choice designs. Mark Res Methods Sas Exp Des Choice Conjoint Graph Tech. 2005:47–97.
29. Janssen EM, Smith IP, Liu X, et al. Patient preferences for lung cancer interception therapy. JAMA Network Open. 2023;6(11):e2342681. doi:10.1001/jamanetworkopen.2023.42681
30. Greene WH, Hensher DA. A latent class model for discrete choice analysis: contrasts with mixed logit. Transp Res Part B Methodol. 2003;37(8):681–698. doi:10.1016/S0191-2615(02)00046-2
31. Bech M, Gyrd-Hansen D. Effects coding in discrete choice experiments. Health Econ. 2005;14(10):1079–1083. doi:10.1002/hec.984
32. US Preventive Services Task Force. Screening for lung cancer: US preventive services task force recommendation statement. JAMA. 2021;325(10):962–970. doi:10.1001/jama.2021.1117
33. American Lung Association. Tobacco Use in Racial and Ethnic Populations. 2019. Available from: https://www.lung.org/quit-smoking/smoking-facts/impact-of-tobacco-use/tobacco-use-racial-and-ethnic.
34. United States Census Bureau. 2019 Population estimates by age, sex, race and hispanic origin. Census.gov. Available from: https://www.census.gov/newsroom/press-kits/2020/population-estimates-detailed.html.
35. Schwarz G. Estimating the dimension of a model. Ann Stat. 1978;6(2):461–464. Available from: https://www.jstor.org/stable/2958889
36. Shiloh S, Wade CH, Roberts JS, Alford SH, Biesecker BB. Associations between risk perceptions and worry about common diseases: a between- and within-subjects examination. Psychol Health. 2013;28(4):434–449. doi:10.1080/08870446.2012.737464
37. Outreville JF. Risk aversion, risk behavior, and demand for insurance: a survey. J Insur Issues. 2014;37(2):158–186. Available from: https://www.jstor.org/stable/43151298
38. Charness G, Gneezy U, Imas A. Experimental methods: eliciting risk preferences. J Econ Behav Organ. 2013;87:43–51. doi:10.1016/j.jebo.2012.12.023
39. Coppola M. Eliciting risk-preferences in socio-economic surveys: how do different measures perform? J Socio-Econ. 2014;48:1–10. doi:10.1016/j.socec.2013.08.010
40. Weyant C, Brandeau ML, Basu S. Personalizing medical treatment decisions: integrating meta-analytic treatment comparisons with patient-specific risks and preferences. Med Decis Making. 2019;39(8):998–1009. doi:10.1177/0272989X19884927
41. Zhou M, Thayer WM, Bridges JFP. Using latent class analysis to model preference heterogeneity in health: a systematic review. PharmacoEconomics. 2018;36(2):175–187. doi:10.1007/s40273-017-0575-4
42. Hilger J, Hanemann M. Heterogeneous preferences for water quality: a finite mixture model of beach recreation in southern california. Available from: https://escholarship.org/uc/item/0565c0b2.
43. Yoo HI. Lclogit2: an enhanced command to fit latent class conditional logit models. Stata J. 2020;20(2):405–425. doi:10.1177/1536867X20931003
44. McNaughton CD, Cavanaugh KL, Kripalani S, Rothman RL, Wallston KA. Validation of a short, 3-item version of the subjective numeracy scale. Med Decis Making. 2015;35(8):932–936. doi:10.1177/0272989X15581800
 © 2026 The Author(s). This work is published and licensed by Dove Medical Press Limited. The
full terms of this license are available at https://www.dovepress.com/terms
and incorporate the Creative Commons Attribution
- Non Commercial (unported, 4.0) License.
By accessing the work you hereby accept the Terms. Non-commercial uses of the work are permitted
without any further permission from Dove Medical Press Limited, provided the work is properly
attributed. For permission for commercial use of this work, please see paragraphs 4.2 and 5 of our Terms.
© 2026 The Author(s). This work is published and licensed by Dove Medical Press Limited. The
full terms of this license are available at https://www.dovepress.com/terms
and incorporate the Creative Commons Attribution
- Non Commercial (unported, 4.0) License.
By accessing the work you hereby accept the Terms. Non-commercial uses of the work are permitted
without any further permission from Dove Medical Press Limited, provided the work is properly
attributed. For permission for commercial use of this work, please see paragraphs 4.2 and 5 of our Terms.