Back to Journals » Medical Devices: Evidence and Research » Volume 18
Modelling and Simulation of the Pediatric Respiratory System with Endotracheal Tube During Pressure-Controlled Ventilation
Authors Bourti M ![]() , Younous S, Belaguid A
, Younous S, Belaguid A ![]()
Received 26 June 2025
Accepted for publication 23 September 2025
Published 30 September 2025 Volume 2025:18 Pages 461—475
DOI https://doi.org/10.2147/MDER.S549778
Checked for plagiarism Yes
Review by Single anonymous peer review
Peer reviewer comments 3
Editor who approved publication: Dr Scott Fraser
Mohamed Bourti,1 Said Younous,2 Abdelaziz Belaguid3
1Electronic Systems Sensors and Nanobiotechnology, National School of Arts and Crafts, Mohammed V University in Rabat, Rabat, Morocco; 2Polyvalent Intensive Care Unit, Child and Mother Hospital, Mohammed VIth Teaching Center, Cadi Ayyad University, Marrakech, Morocco; 3Department of Physiology, Faculty of Medicine and Pharmacy, Mohammed V University in Rabat, Rabat, Morocco
Correspondence: Mohamed Bourti, National School of Arts and Crafts, Mohammed V University in Rabat, Avenue de l’Armée Royale, Madinat Al Irfane BP 6207, Rabat, 10000, Morocco, Email [email protected]
Purpose: To evaluate the impact of pediatric endotracheal tube (ETT) size on airflow and tidal volume (VT) waveforms during pressure-controlled ventilation (PCV) by developing and validating linear and nonlinear respiratory system models that incorporate ETT resistance.
Methods: Five pediatric ETTs (inner diameters: 3.5– 5.5 mm) were analyzed using both linear (Poiseuille’s law) and nonlinear (Rohrer’s equation) mathematical models implemented in MATLAB Simulink. The models simulated PCV conditions and were validated against clinical data collected from nine pediatric ICU patients undergoing mechanical ventilation with ETTs in the same size range. Simulated signals for flow and tidal volume were compared with measured data using percentage differences and Student’s t-test.
Results: The nonlinear model closely approximated clinical data, with average percentage differences of 9.85% for tidal volume and 15.68% for peak flow, significantly outperforming the linear model (17.67% and 46.87%, respectively; p < 0.001). Simulation results also demonstrated that smaller-diameter ETTs substantially increased airflow resistance, reducing delivered VT and requiring longer expiratory times to avoid air trapping.
Conclusion: Incorporating nonlinear ETT resistance into respiratory system models improves prediction accuracy under PCV, particularly in pediatric patients with smaller airways. The findings emphasize the importance of ETT size in ventilator parameter adjustment to optimize ventilation efficiency and minimize lung injury. The validated model provides a useful clinical tool for predicting ETT-related effects and guiding safer ventilation strategies in pediatric intensive care.
Keywords: airway resistance, endotracheal tube, expiratory time, mathematical model, pressure-controlled ventilation
Introduction
Pressure controlled ventilation (PCV) is a mode of mechanical ventilation used to treat patients in a situation of respiratory distress.1 However, inappropriate PCV settings, particularly those neglecting the influence of endotracheal tube (ETT) size, can result in ventilator-induced lung injury (VILI), including barotrauma and dynamic hyperinflation.2–4 The resistance of the ETT (RETT) significantly affects airflow, tidal volume and expiratory time, making the choice of ETT size a critical factor in optimizing pressure-controlled ventilation (PCV) outcomes. This underscores the importance of considering ETT size in studies aimed at improving patient safety and ventilation efficacy. Smaller ETTs, commonly used in pediatric patients with high airway resistance, exacerbate resistance effects, increasing the risk of complications like hypoventilation and air trapping if not properly considered.
The RETT depends on the flow characteristics through the tube. At lower, laminar flow rates, RETT is described by Poiseuille’s law:5

Where  is the resistance to the airflow through a narrow and long tube, L is the length of the tube, r is the radius of the tubes and
  is the dynamic air viscosity flowing through the tubes. At high and turbulent flow rates, the RETT becomes nonlinear, and it is given by Rohrer’s equation:6

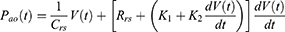
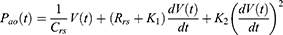
where K1 and K2 are constants related to the geometry of the tubes (K1 is the laminar flow component and K2 to the turbulent component) and  is the airflow rate.
While previous studies have developed models and algorithms to optimize PCV settings,7–10 few have incorporated the nonlinear resistance of ETT, which is critical for smaller tubes used in pediatric patients with obstructive airway conditions.
Several ventilatory parameters are essential to properly frame pressure-controlled ventilation (PCV). Inspiratory pressure (PIP) determines the peak pressure applied to the airways during inspiration and is directly related to tidal volume delivery. Respiratory frequency (FR) defines the number of cycles per minute and strongly influences alveolar ventilation. The inspiratory-to-expiratory ratio (Tin/Tex) specifies the relative duration of inspiration versus expiration and plays a critical role in preventing air trapping. Positive end-expiratory pressure (PEEP) maintains alveolar recruitment at the end of expiration, improving oxygenation and reducing atelectasis. Finally, the fraction of inspired oxygen (FiO2) reflects the oxygen concentration delivered to the patient and is adjusted to ensure adequate arterial oxygenation. These concepts are fundamental for understanding the equations and simulations presented in this study, as they directly link the mathematical model to clinical practice.
This study aims to highlight the importance of selecting the appropriate ETT size in PCV by developing a mathematical model that integrates both linear (Poiseuille’s law) and nonlinear (Rohrer’s equation) representations of ETT resistance. The model simulates PCV with pediatric ETT sizes (3.5–5.5 mm) to establish the impact of ETT size on ventilation parameters, such as tidal volume, peak flow and expiratory time. To validate the model, we used real-world data from a pediatric ICU setting with smaller ETTs (3.5–5.5 mm), where higher resistance amplifies nonlinear effects. This validation tests the model’s robustness in high-resistance scenarios, which are relevant to both pediatric patients requiring smaller ETTs or presenting with elevated airway resistance.
Additionally, during the model validation process, the resistance values taken from the ventilator screen were used as total respiratory system resistance. In the model, the ETT resistance was subtracted from this value to isolate the patient-specific airway resistance.
By comparing the linear and nonlinear models with practical measurements, this study demonstrates the superiority of nonlinear modeling for describing ETT resistance, particularly for smaller tubes. The findings underscore the need for informed ETT selection to optimize PCV parameters, such as respiratory frequency and inspiratory/expiratory time ratio, to minimize complications and improve outcomes across diverse pediatric populations. The validated nonlinear model provides a versatile tool for clinicians to predict the impact of ETT size on ventilation, ensuring safer and more effective PCV in pediatric settings.
Materials and Methods
The respiratory system model is formulated using a differential equation derived from the equation of motion that describes the respiratory system and the endotracheal tube. This model is coupled with a mathematical representation of the pressure waveform to simulate mechanical ventilation under PCV. The overall architecture of the combined models is illustrated in the block diagram presented in Figure 1, which includes the pressure waveform signal (Figure 1A), the simulation block solving the differential equations (Figure 1B), and the output display showing volume and flow results (Figure 1C).
 |
Figure 1 Schematic of the respiratory system model under pressure-controlled ventilation. (A) Prescribed airway pressure (P) profile. (B) Computational solver for the differential equation governing lung mechanics. (C) Resulting simulated flow and volume waveforms. |
Modeling PCV Signal
A barometric respirator generates a constant pressure in the inspiratory phase and then drop directly to the PEEP value during expiration;11 Therefore, the mathematical model of PCV signals must have the same description and the same representation of the behavior of signal generated by the respirator.
Figure 1A shows a typical waveform of controlled pressure signal generated by a PCV ventilator that should be represented by the mathematical model; it also clarifies the PCV cycle parameters such as the rise time  , the inspiratory and expiratory time (Tin and Tex), the respiratory period (Ttot), the positive end expiratory pressure (PEEP) and the inspiratory pressure (PIP).
The mathematical model for one cycle of the pressure-controlled ventilation signal was formulated to represent the expiration and inspiration activities, and reflect the input parameters during mechanical ventilation in PCV mode. The cycle is a continuous function represented by the equations (3), (4) and (5):
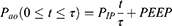


Where P is the PCV signal, Pao is the airway pressure. PIP is inspiratory pressure and PEEP is the positive end expiratory pressure.
In this study, the  and PEEP are chosen, respectively, 0.05 s and 0 cmH2O.
The respiratory frequency (Fr) given by  , with
  .
.
Endotracheal Tubes
This study investigates five pediatric ETTs with inner diameters (ID) ranging from 3.5 to 5.5 mm. The resistance of each ETT is characterized by experimental Rohrer’s constants K1 and K2 for nonlinear resistance12,13 and theoretical linear resistance determined by Poiseuille’s law, with the dynamic air viscosity 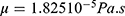 .14,15 Table 1 illustrates the resistance values of the five ETTs.
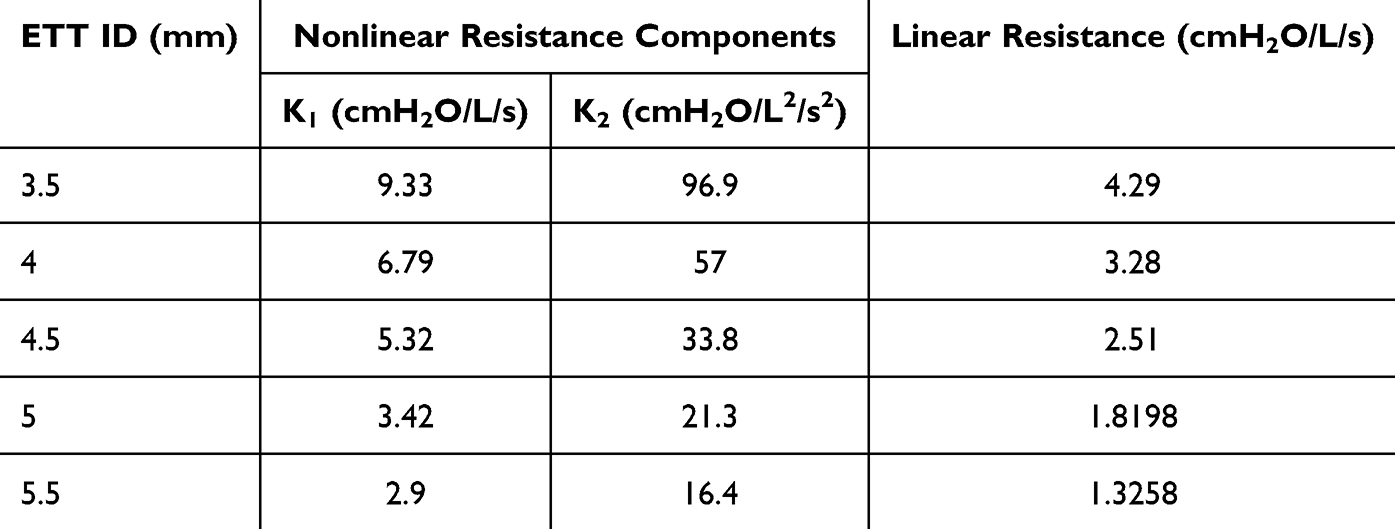 |
Table 1 Values of the Linear Resistance and Rohrer’s Constants K1 and K2 for the Nonlinear Resistance of Pediatric Endotracheal Tubes |
Model of the Respiratory System with Endotracheal Tube During Pressure-Controlled Ventilation
The single compartment resistor–capacitor (RC) model16 is the simplest model describing respiratory mechanics with endotracheal tubes and the most appropriate for describing the equation of motion where R describes the resistance of respiratory system (Rrs) and endotracheal tubes (RETT), and C describes the elastic properties of the lungs and chest wall (Crs). An equivalent electrical circuit of this model is the series connection of a capacitor C and a resistor R (Figure 2).17
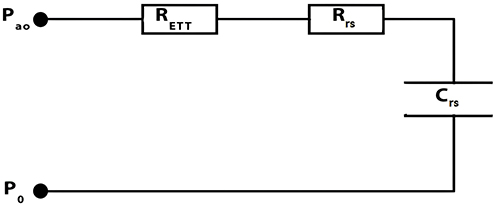 |
Figure 2 Electrical equivalent circuit of the respiratory system connected to the ETT. |
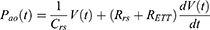
The equation of motion of the respiratory system is given by the equation (6):
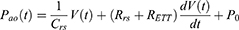
This equation represents the fundamental balance between pressure, resistance, and compliance in the respiratory system. In practice, it allows clinicians to predict how changes in inspiratory pressure or compliance will affect delivered tidal volume.
P0 is the sum of intrinsic and extrinsic pressure and considered equal to zero in our study.

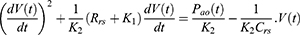
where RETT is given by Rohrer’s equation.
Dividing each side of equation (10) by K2 and rearranging, we find:
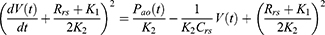
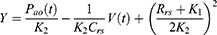
By introducing Y, the equation becomes easier to solve mathematically. The equation can have two solutions that depend on the Y sign:

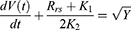

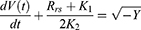
The two possible solutions reflect whether the flow is in the inspiratory or expiratory phase.
Simulator Design
The mathematical model of PCV signal created was combined with a function based on the differential equations (14) and (15) of the respiratory system with endotracheal tube to construct a simulator of the mechanical ventilation system (presented in Figure 3). This combination was constructed and simulated using Simulink tools in MATLAB platform.
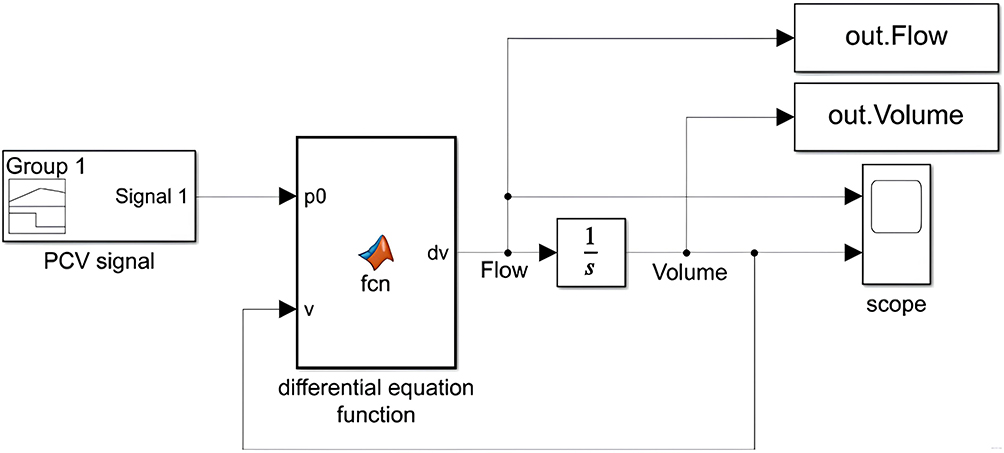 |
Figure 3 Block diagram of the created PCV simulator. |
Validation with Pediatric ICU Data and Statistical Analysis
For model validation, resistance values were obtained directly from the ventilator during pressure-controlled ventilation (PCV) in a pediatric ICU. These values represent the total respiratory system resistance, including the contribution of the ETT. To isolate the patient’s intrinsic airway resistance for comparison with the model—which independently accounts for the ETT—the estimated upper airway resistance was subtracted from the ventilator-reported values.
To evaluate the model’s ability to represent the respiratory system under pressure-controlled ventilation (PCV), simulated outputs—specifically flow rate and tidal volume—were compared with clinical measurements collected from nine pediatric patients admitted to the intensive care unit (ICU). These nine patients were included over three months, corresponding to all cases meeting the predefined inclusion criteria during this timeframe. All were ventilated exclusively in PCV mode with completely controlled settings, without any investigator intervention, adjustment of ventilator parameters, or modification of clinical management. The study was strictly observational: only output data displayed on the ventilator monitor (airway pressure, tidal volume, and flow) were recorded, without any direct interaction with the patients. This explains the limited sample size, which reflects the number of eligible cases available within the collection window.
The clinical conditions and ventilator settings used for these patients are summarized in Table 2. All patients were intubated with endotracheal tubes ranging from 4.0 to 5.5 mm in inner diameter, representing the range of airway sizes commonly encountered in pediatric critical care. Mechanical ventilation was administered in PCV mode, with inspiratory pressures set between 15 and 17 cmH2O and positive end-expiratory pressure (PEEP) level of 5 cmH2O. Respiratory rates varied from 17 to 32 cycles per minute, reflecting patient-specific clinical needs and age-related differences.
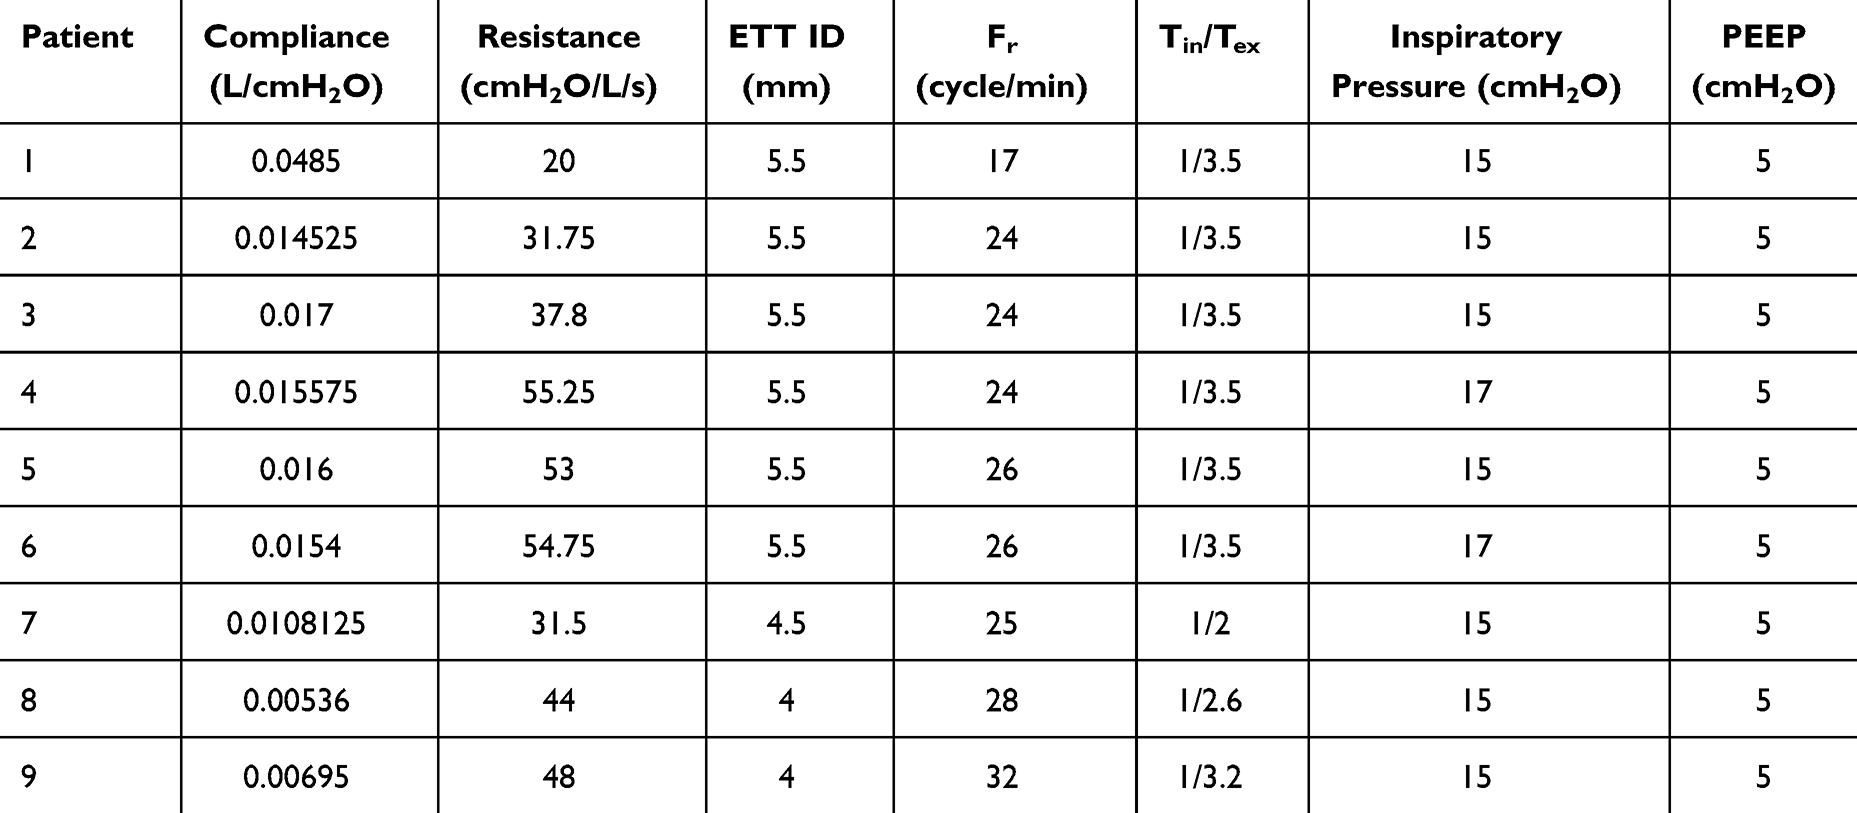 |
Table 2 Baseline Respiratory Parameters and PCV Settings for Pediatric Patients |
Physiological parameters, including respiratory system compliance and total respiratory system resistance, were also documented for each patient. Compliance values ranged from 0.0052 to 0.05 L/cmH2O, while total resistance values spanned from 20 to 56 cmH2O/L/s. This variability in patient profiles and ventilatory conditions provided a robust dataset for evaluating the model’s ability to replicate clinically observed flow and volume responses across a realistic spectrum of pediatric ICU scenarios.
Model validation was performed by comparing simulated and measured values using percentage differences ( ) and Student’ t-test in MATLAB, with statistical significance set at p < 0.05. This validation confirms the model’s reliability for assessing the impact of ETT on pressure-controlled ventilation outcomes across pediatric and adult populations.
Results
This section presents the simulation and validation results of the linear and nonlinear respiratory models under PCV conditions. The models were evaluated based on their ability to reproduce physiologically accurate flow and volume waveforms, predict tidal volume and peak flow in comparison to clinical data, and capture the effects of endotracheal tube size on ventilatory mechanics. The outcomes are organized into four subsections addressing waveform patterns, clinical validation, ETT size influence, and time required to evacuate 95% of VT.
Model Validation Based on Flow and Volume Signal Patterns
Figure 4 presents the simulated flow (A) and volume (B) signals generated by the linear (dashed line) and nonlinear (solid line) respiratory models under identical simulation conditions. Both models produce physiologically realistic waveform patterns consistent with those observed in mechanically ventilated pediatric ICU patients. The nonlinear model displays sharper transitions and a more gradual return to baseline, particularly during expiration. Notably, the nonlinear expiratory flow curve shows a concavity change—initially accelerating due to high flow-dependent resistance, then transitioning to a slower decay as resistance decreases—an effect not present in the linear model.
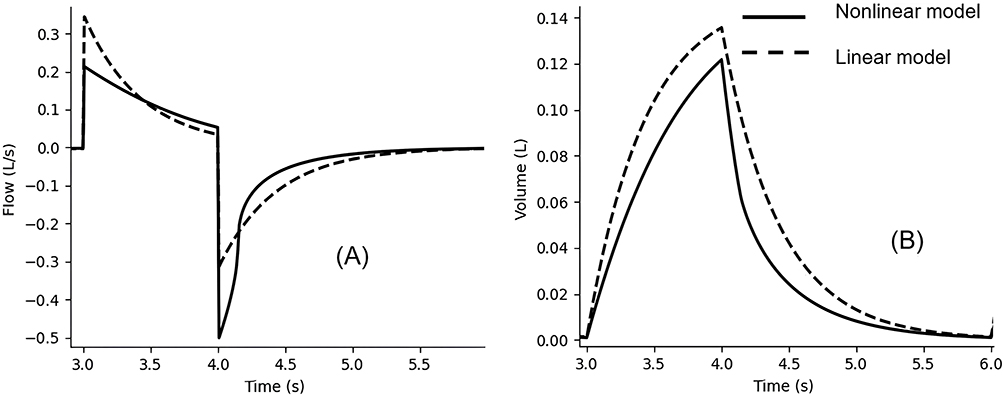 |
Figure 4 Simulated flow (A) and volume (B) signals generated by the linear (dashed line) and nonlinear (solid line) respiratory models. |
Measurements were conducted using the followings:
- An inspiratory pressure (PIP) of 15 cmH2O, representing the average of 30 individual measurements ranging from 14 to 16 cmH2O.
- A respiratory rate (Fr) of 25 cycle/minute.
- An inspiratory to expiratory time ratio of 1/2.
- Respiratory system resistance (Rrs) set based on the age of the simulated subject. For pediatric cases, Rrs = 40 cmH2O/L/s was used.
- A normal respiratory system compliance (Crs) of 1 mL/cmH2O was considered.
Validating Model Predictions of Inspiratory Flow and Tidal Volume with Pediatric ICU Data
Table 3 compares the predicted peak flow and tidal volume values of both models with clinical data from nine pediatric ICU patients intubated with ETTs of varying diameters (4.0–5.5 mm). The nonlinear model consistently yields lower mean percentage differences from clinical measurements than the linear model:
- Tidal Volume: Mean difference of 9.85% (nonlinear) vs 17.67% (linear)
- Peak Flow: Mean difference of 15.68% (nonlinear) vs 46.87% (linear)
 |
Table 3 Validation Summary of Linear and Nonlinear Model Predictions Against Pediatric ICU Measurements (ETT Sizes 4–5.5 mm) |
These results indicate improved predictive accuracy for the nonlinear model. Student’s t-tests confirmed that both models show statistically significant deviations from actual values (p < 0.001), though the nonlinear model is notably closer to clinical observations.
Effects of the Endotracheal Tube ID on Nonlinear Peak Flow and Tidal Volume
Table 4 summarizes the peak tidal volume and peak expiratory flow values produced by the nonlinear model for five different pediatric ETT sizes (ID 3.5 to 5.5 mm). The results show that as inner diameter of ETT increases, tidal volume and peak flow increase.
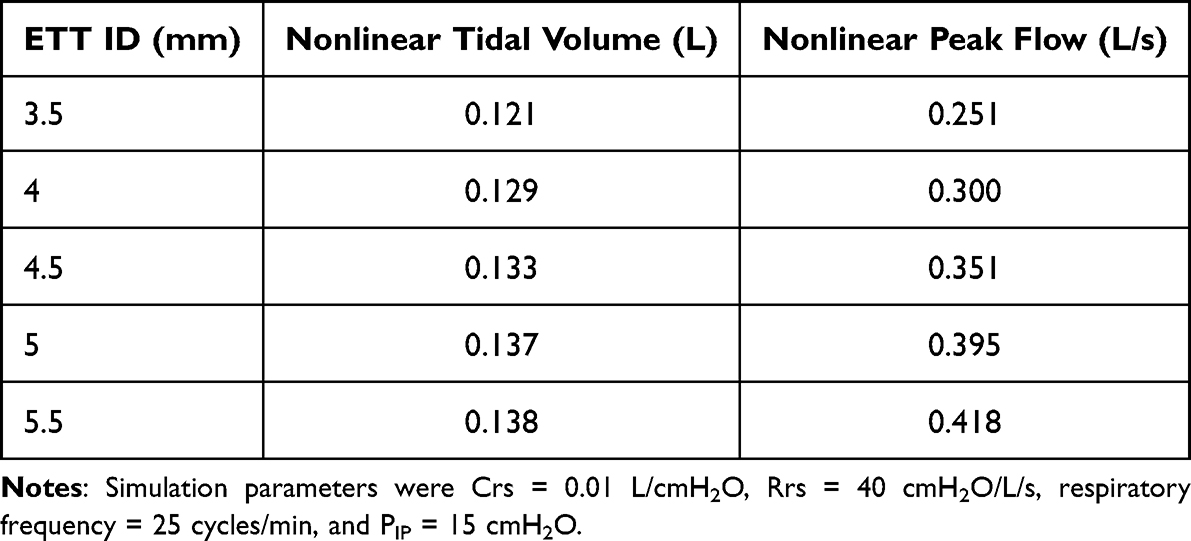 |
Table 4 Comparison of Tidal Volume and Peak Inspiratory Flow Across Five Pediatric Endotracheal Tube Sizes (3.5–5.5 mm) |
Figure 5 further illustrates these effects through simulated waveforms of tidal volume (A) and respiratory airflow (B) for each ETT size. As the ETT diameter increases, the amplitude of the volume and flow waveforms also increases. Narrower tubes impose higher resistance, reducing both airflow and delivered volume.
 |
Figure 5 Respiratory cycle of tidal volume (A) and respiratory airflow (B) resulting from the nonlinear model for five pediatric endotracheal tubes. |
Effects of the ID of the Endotracheal Tube on Choice of the Expiratory Time (Tex)
Figure 6 shows the time required to evacuate 95% of tidal volume (Tex) for the same five ETT sizes, assuming a fixed respiratory system resistance of 10 cmH2O/L/s. The results reveal a sharp increase in time required to evacuate 95% of VT as ETT inner diameter decreases. For example, Tex is shortest for the ID of 5.5 mm and significantly longer for the ID of 3.5 mm. This highlights the critical influence of ETT resistance on respiratory timing and the need for appropriate expiratory duration in pediatric ventilation settings.
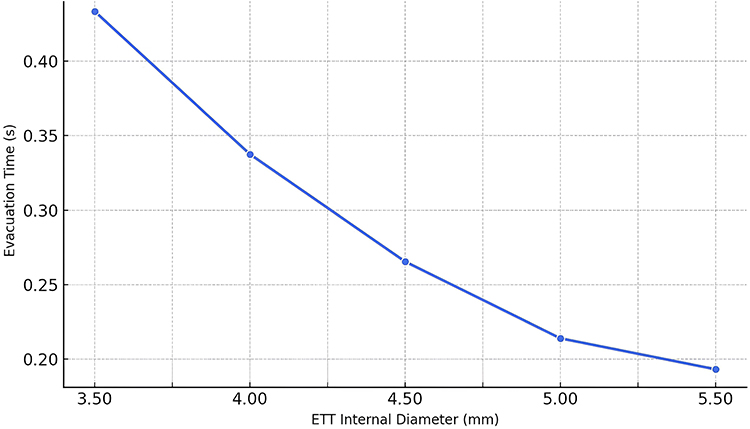 |
Figure 6 Time required to evacuate 95% of tidal volume through five pediatric endotracheal tube diameters, assuming a respiratory system resistance of 10 cmH2O/L/s. |
Discussion
Validity of the Electrical and Mathematical Model of the Respiratory System with the ETT
To assess the validity of our model (the linear and the nonlinear), we compared their output—tidal volume and airflow—with the equations that describe the behavior of the volume and airflow during inspiration and expiration.
The volume during the inspiratory time is given by equation (16):18
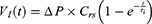
Where  is the inspiratory volume, ΔP is the difference between inspiratory pressure and PEEP,
  is the respiratory system compliance, t is time, and
  is the inspiratory time constant.
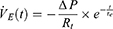
By deriving the equation (16) with respect to time, inspiratory airflow  ) is given by the equation (17):

Where Rt is the respiratory resistance.
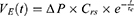
The maximum volume delivered to the lung ( ) at the end of inspiratory time is given by the equation (18):18

During expiratory time, the volume is given by the equation (19):
Where  is the expiratory time constant.
By deriving the equation (19) with respect to time, the expiratory airflow  is given by the equation (20):
The flow waveform resulting from the nonlinear model simulation (Figure 4A) shows that during inspiratory time, the flow rapidly increases, reaching its peak at the end of the rise time, before decreasing exponentially as described by equation (17). During expiration, the flow pattern in the nonlinear model exhibits two distinct phases separated by a noticeable inflection point, which was absent in the linear model. Initially, the expiratory flow increases in magnitude with a concave-down profile, reflecting the strong influence of flow-dependent resistance as described by Rohrer’s equation. As flow decreases, the resistance drops significantly, leading to a shift in the dynamics: the flow transitions to a more linear-like decay and follows the equation (20), similar to the pattern observed in the linear model. This change in concavity—absent in the linear model—is not a modeling artifact but rather an emergent feature of the nonlinear resistance formulation. Unlike Poiseuille’s law, which assumes constant resistance, Rohrer’s equation captures the dynamic interaction between airflow and resistance during expiration through an ETT.
It is important to note, however, that the use of a single-compartment model imposes certain limitations in accurately reproducing expiration dynamics. This modeling approach simplifies the lung as a single unit, failing to represent the heterogeneity of alveolar mechanics and neglecting nonlinearities in respiratory system compliance.19,20
Validation of predicted peak tidal volumes and peak flows against pediatric ICU data, (Table 3), revealed that the nonlinear model substantially outperformed the linear model in both metrics. The mean percentage error for peak tidal volume decreased from 17.67% (linear) to 9.85% (nonlinear), while the error for peak flow dropped from 46.87% to 15.68%. These findings confirm that incorporating flow-dependent resistance significantly improves the accuracy of respiratory system modeling under controlled ventilation, especially for pediatric airways where resistance plays a dominant role.
Effects of the ETT on the Flow and Volume
Tidal volume is determined by the pre-set inspiratory pressure but is also influenced by the inspiratory time, the compliance of the respiratory system, and airway resistance. Thus, inadequate settings of these parameters can lead to hypoxemia and hypoventilation.21
To investigate the influence of ETT size on respiratory mechanics, we performed simulations of the respiratory model under varying pressure levels (ranging from 14 to 16 cmH2O, with 30 measurements per ETT) and applied Student’s t-tests to compare tidal volume and inspiratory flow between each ETT pair. The comparisons were conducted using a two-tailed, two-sample unequal variance t-test, which is appropriate for independent simulations with potentially differing variances.
The results showed statistically significant differences (p < 0.001) in both peak flow and tidal volume between all ETT pairs for the nonlinear model (Table 4). These findings confirm that even subtle changes in ETT diameter can lead to measurable and consistent differences in respiratory outcomes across a range of pressure levels. Importantly, the significant p-values support the conclusion that ETT size has a non-negligible effect on both the volume delivered and the airflow dynamics during pressure-controlled ventilation.
These results reinforce the importance of incorporating accurate ETT modeling in respiratory simulations and highlight the need for clinicians to consider the mechanical implications of ETT size selection. Failure to do so may result in suboptimal ventilation, particularly in patients with high flow demands or reduced lung compliance.
Effects of the ETT on the Expiratory Time
The importance of studying the effects of ETTs on choice of inspiratory and expiratory times is to avoid air trapping and pulmonary barotrauma. An expiratory time of less time than necessary to inhale the most air volume from the lungs may lead to incomplete emptying of the lungs. This can increase the residual volume and the functional residual capacity and cause air trapping in the lungs. Here comes the importance of studying the effect of estimating the expiratory time and thus the ratio Tin/Tex according to the endotracheal tube used. Some clinicians consider that the use of 95% to 98% volume emptying level is good enough for exhalation21 which is corresponding, respectively, 3  e to 5
  e.
e.
Figure 6 shows that the time required to evacuate 95% of tidal volume decreases as the inner diameter of the ETT increases. Smaller ETTs increase airway resistance, leading to longer expiratory times, while larger ETTs decrease resistance and facilitate faster emptying.
This finding highlights the critical importance of selecting an appropriate ETT size to optimize expiratory duration and minimize complications such as pulmonary barotrauma related to air trapping in patients during PCV. A clear understanding of how ETT dimensions affect expiratory mechanics is essential for configuring ventilator settings that best meet individual patient requirements.
Clinical Implication Concerning the Optimization of the Setting the PCV
The main aim of mechanical ventilation is to maintain arterial partial pressures of carbon dioxide (PaCO2) and oxygen (PaO2) within their normal physiological ranges, which for PaCO2 should be between 35 and 45 mmHg and for PaO2 between 80 and 100 mmHg.22 The aim of maintaining PAO2 and PaCO2 within their normal values is to ensure good oxygenation and ventilation, respectively. These objectives will be achieved by proper adjustment and optimization of mechanical ventilation, while minimizing the risk of ventilator-induced lung damage.
These arterial blood gas levels directly reflect how well gas exchange happens in the alveoli. Therefore, understanding and controlling the alveolar partial pressure of carbon dioxide (PACO2) and oxygen (PAO2) is crucial. These alveolar pressures directly determine how much CO2 is removed and how much O2 is absorbed. Our model helps maintain these alveolar gas pressures near target arterial levels: around 40 mmHg for PACO2 and 80–100 mmHg for PAO2.22
A key ventilator setting is respiratory frequency (Fr), which is linked to expiratory time. Not allowing enough expiratory time can lead to “auto-PEEP” or air trapping in the lungs, increasing pressure inside the chest and raising the risk of lung injury. However, the challenge arises because an increase in expiratory time inherently leads to an increase in the total respiratory cycle time. Consequently, this leads to a decrease in the respiratory frequency Fr. The relationship between Fr and alveolar ventilation  is direct and crucial, as articulated by equation (21):
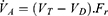
In this equation,  represents the tidal volume, and
  is the dead space volume—the portion of the inspired air that does not participate in gas exchange. This equation highlights that for a given tidal volume and dead space, alveolar ventilation is directly proportional to the respiratory frequency.
Therefore, a decreased Fr, necessitated by a prolonged Tex to prevent air trapping, invariably results in decreased alveolar ventilation. This reduction in the effective delivery and removal of gases to and from the alveoli has profound implications for PACO2. The relationship between alveolar ventilation and PACO2 is inversely proportional, as elegantly described by equation (22):23
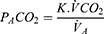
Where K is a constant that accounts for the physical conditions within the lungs (eg, air being warmed and humidified),24 and  represents the metabolic production of carbon dioxide. This equation illustrates that if alveolar ventilation (
 ) decreases, while carbon dioxide production remains constant, PACO2 will inevitably rise.
Beyond carbon dioxide, alveolar ventilation also critically influences the alveolar partial pressure of oxygen (PAO2). The relationship between PAO2 and PACO2, and by extension alveolar ventilation, is described by the alveolar gas equation (23):24
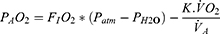
Here,  refers to the atmospheric pressure,
  to the partial pressure of water vapor,
  to the fraction of inspired oxygen and
  represents the metabolic consumption of oxygen. This shows that increased PACO2 leads to decreased PAO2 (hypoxemia).
Given these interdependencies, clinicians must constantly adjust several controllable parameters in pressure-controlled ventilation to manage alveolar ventilation and arterial blood gases. These include:25
- Inspiratory Pressure (PIP): This determines the peak pressure delivered to the airways during inspiration. Increasing PIP will increase the tidal volume, thereby increasing alveolar ventilation, assuming other parameters are constant. However, excessive PIP carries the risk of barotrauma.
- Respiratory Frequency (Fr): As discussed, adjusting Fr directly influences alveolar ventilation. Increasing Fr increases
 and thus tends to lower PaCO2, while decreasing Fr has the opposite effect. However, increasing Fr too much can reduce Tex and lead to air trapping.
 - Inspiratory to Expiratory Ratio (Tin/Tex): This ratio defines the proportion of the respiratory cycle spent in inspiration versus expiration. A longer inspiratory time (relative to expiratory time) can allow for more complete lung inflation and potentially better gas exchange, but it significantly reduces the available expiratory time, increasing the risk of air trapping (auto-PEEP), especially in patients with obstructive lung disease. Conversely, a shorter inspiratory time (and thus a longer expiratory time) helps prevent air trapping but may compromise gas delivery if it is too short. Careful adjustment of this ratio is crucial to balance optimal ventilation with lung protection.
- Positive End-Expiratory Pressure (PEEP): PEEP is the pressure maintained in the lungs at the end of exhalation. It is applied to recruit collapsed alveoli, improve oxygenation by increasing the functional residual capacity, and prevent alveolar collapse during expiration. While primarily influencing PaO2, PEEP can also indirectly affect PaCO2 by improving lung mechanics and ventilation-perfusion matching. However, excessive PEEP can also lead to barotrauma and hemodynamic compromise.
- Fraction of Inspired Oxygen (FiO2): This is the concentration of oxygen in the inspired gas mixture. FiO2 is primarily used to control PaO2. Clinicians aim to use the lowest FiO2 possible to achieve adequate oxygenation, typically targeting a PaO2 of 80–100 mmHg or an oxygen saturation (SpO2) of 92–98% to minimize oxygen toxicity.
Our mathematical model supports clinical decision-making by simulating the effects of these ventilator settings. Critically, our model addresses the significant role of the endotracheal tube (ETT) diameter in pediatric ventilation, a factor often overlooked but corroborated by previous work.26,27 Our findings show how different pediatric ETTs affect airflow and tidal volume, highlighting that narrower ETTs increase airway resistance, requiring higher pressures and potentially leading to air trapping. This comprehensive approach, incorporating ETT resistance, allows for more personalized ventilation strategies, helping clinicians optimize gas exchange, prevent complications, and ultimately improve patient outcomes.
Based on our findings, a simple guideline can be proposed to support clinical decision-making. For each pediatric patient, the recommended ETT size should first be chosen according to age and weight. When a smaller ETT (≤4.0 mm) is required due to anatomical constraints, clinicians should anticipate increased resistance, prolonged expiratory time, and a higher risk of air trapping. In such cases, ventilator settings should be adjusted by lengthening the expiratory time, reducing respiratory frequency if necessary, and carefully optimizing the Tin/Tex ratio. Conversely, when a larger ETT (≥5.0 mm) can be used, airflow resistance is reduced, allowing more efficient ventilation with lower risk of dynamic hyperinflation. This practical framework highlights how our model can help guide individualized ventilation strategies in pediatric intensive care.
Limitations and Future Work
The model’s predictions differ from experimental values mainly because the respiratory system is simplified into a single-compartment RC model, which assumes homogeneity and does not represent the heterogeneous distribution of compliance and resistance across different lung regions. This simplification also omits the contribution of ventilator circuit components such as tubing, filters, and humidifiers. Although this approach facilitates mathematical tractability and allows for initial validation, it inevitably limits physiological fidelity, particularly in complex clinical scenarios such as acute respiratory distress syndrome or obstructive lung disease. Nevertheless, the model remains valuable for analyzing ventilator performance and guiding parameter adjustment. Future work should aim to incorporate additional system components and develop multi-compartment models with nonlinear compliance and heterogeneous airway properties, thereby improving accuracy and broadening the clinical applicability of the simulation framework.
Another limitation of this study is that model validation was performed with a relatively small cohort of nine pediatric patients from a single center, using a narrow range of ventilator settings. While this dataset was sufficient to demonstrate proof-of-concept and highlight the advantages of nonlinear modeling, it may not capture the full variability of clinical practice. Therefore, caution is warranted when generalizing these findings. Broader validation across larger and more diverse patient groups—including older children, neonates with extremely small ETTs, and adults ventilated with pediatric-sized tubes—will be necessary to strengthen confidence in the model’s applicability. Expanding the validation to different disease states, such as acute respiratory distress syndrome or obstructive airway diseases, would also improve its clinical relevance.
Conclusion
In this research, we created and validated a respiratory system simulation model for pressure-controlled ventilation (PCV) incorporating both linear and nonlinear endotracheal tube (ETT) resistance. Validation against pediatric ICU data confirmed that the nonlinear model provided more accurate predictions of tidal volume and inspiratory flow than the linear model. These findings highlight the importance of ETT size in pediatric ventilation and support personalized strategies such as selecting the most appropriate ETT diameter, adjusting expiratory time to prevent air trapping, and tailoring ventilator settings (frequency, inspiratory pressure, and Tin/Tex ratio) to optimize gas exchange while minimizing lung injury. Beyond its role as a research framework, the model offers practical opportunities for clinical integration, including algorithm-guided ETT selection, real-time ventilator setting personalization, and the development of automated decision-support systems embedded into mechanical ventilators. Such applications would allow clinicians to predict the consequences of different ventilation strategies in advance, improve patient safety, and streamline critical care workflows. The model therefore provides not only a valuable tool for safer and more effective PCV in pediatric patients but also a foundation for future innovations in automated ventilatory management.
Ethical Statement
The validation of the model was conducted using retrospective data collected exclusively from ventilator monitors during routine clinical care. No interventions, no modifications of ventilator settings, and no patient identifiers were involved in the study. According to institutional and national regulations, this type of study did not require ethics committee approval.
Author Contributions
All authors made a significant contribution to the work reported, whether that is in the conception, study design, execution, acquisition of data, analysis and interpretation, or in all these areas; took part in drafting, revising or critically reviewing the article; gave final approval of the version to be published; have agreed on the journal to which the article has been submitted; and agree to be accountable for all aspects of the work.
Funding
This research received no external funding.
Disclosure
The authors declare no conflict of interest.
References
1. Garnero AJ, Abbona H, Gordo-Vidal F, Hermosa-Gelbard C. Pressure versus volume controlled modes in invasive mechanical ventilation. Medicina Intensiva. 2013;37(4):292–298. doi:10.1016/j.medine.2012.10.015
2. Boussarsar M, Thierry G, Jaber S, Roudot-Thoraval F, Lemaire F, Brochard L. Relationship between ventilatory settings and barotrauma in the acute respiratory distress syndrome. Intensive Care Med. 2002;28(4):406–413. doi:10.1007/s00134-001-1178-1
3. Anzueto A, Frutos-Vivar F, Esteban A, et al. Incidence, risk factors and outcome of barotrauma in mechanically ventilated patients. Intensive Care Med. 2004;30(4):612–619. doi:10.1007/s00134-004-2187-7
4. Dreyfuss D, Saumon G. Ventilator-induced lung injury: lessons from experimental studies. Am J Respir Crit Care Med. 1998;157(1):294–323. doi:10.1164/ajrccm.157.1.9604014
5. Hasan A. Physiological considerations in the mechanically ventilated patient. In: Hasan A, editor. Understanding Mechanical Ventilation: A Practical Handbook. Springer; 2010:19–69. doi:10.1007/978-1-84882-869-8_3
6. Rohrer F. Der Strömungswiderstand in den menschlichen Atemwegen und der Einfluss der unregelmässigen Verzweigung des Bronchialsystems auf den Atmungsverlauf in verschiedenen Lungenbezirken. Pflüger’s Arch. 1915;162(5):225–299. doi:10.1007/BF01681259
7. Sánchez-Ocampo M, Bonet I, López-Isaza S, Jiménez-Posada LD, Montoya-Goéz Y, Montagut-Ferizzola YJ. Nonlinear N – compartments model of respiratory mechanics considering viscoelasticity, inertia and surface tension properties. Respir Physiol Neurobiol. 2023;309:104001. doi:10.1016/j.resp.2022.104001
8. Gupta AK, Sharma J, Mukhopadhyay P. Optimisation method applied to the design of ventilators. Med Biol Eng Comput. 1978;16(4):387–396. doi:10.1007/BF02442656
9. Rudowski R, Bokliden A, Carstensen A, Gill H, Ludwigs U, Matell G. Multivariable optimization of mechanical ventilation. A linear programming approach. Int J Clin Monit Comput. 1991;8(2):107–115. doi:10.1007/BF02915544
10. Das A, Menon PP, Hardman JG, Bates DG. Optimization of mechanical ventilator settings for pulmonary disease states. IEEE Trans Biomed Eng. 2013;60(6):1599–1607. doi:10.1109/TBME.2013.2239645
11. Kreit JW. Ventilator modes and breath types. In: Kreit JW, editor. Mechanical Ventilation. Oxford University Press;2013. doi:10.1093/med/9780199773947.003.0004
12. Flevari AG, Maniatis N, Kremiotis TE, et al. Rohrer’s constant, K2, as a factor of determining inspiratory resistance of common adult endotracheal tubes. Anaesth Intensive Care. 2011;39(3):410–417. doi:10.1177/0310057X1103900311
13. Sly PD, Brown KA, Bates JHT, Spier S, Milic‐Emili J. Noninvasive determination of respiratory mechanics during mechanical ventilation of neonates: a review of current and future techniques. Pediatr Pulmonol. 1988;4(1):39–47. doi:10.1002/ppul.1950040109
14. Edge E, Llc EE. Viscosity of air, dynamic and kinematic. Available from: https://www.engineersedge.com/physics/viscosity_of_air_dynamic_and_kinematic_14483.htm.
15. Houston WV. The Viscosity of Air. Phys Rev. 1937;52(7):751–757. doi:10.1103/PhysRev.52.751
16. Bates JHT, editor. The linear single-compartment model. In: Lung Mechanics: An Inverse Modeling Approach. Cambridge University Press; 2009:37–61. doi:10.1017/CBO9780511627156.004
17. Schmidt M, Foitzik B, Hochmuth O, Schmalisch G. Computer simulation of the measured respiratory impedance in newborn infants and the effect of the measurement equipment. Med Eng Phys. 1998;20(3):220–228. doi:10.1016/S1350-4533(98)00006-X
18. Tamburrano P, Sciatti F, Distaso E, Di Lorenzo L, Amirante R. Validation of a Simulink model for simulating the two typical controlled ventilation modes of intensive care units mechanical ventilators. Appl Sci. 2022;12(4):2057. doi:10.3390/app12042057
19. Jandre FC, Carvalho ARS, Pino AV, Giannella-Neto A. Effects of filtering and delays on the estimates of a nonlinear respiratory mechanics model. Respir Physiol Neurobiol. 2005;148(3):309–314. doi:10.1016/j.resp.2005.02.009
20. Ochs M, Nyengaard JR, Jung A, et al. The number of alveoli in the human lung. Am J Respir Crit Care Med. 2004;169(1):120–124. doi:10.1164/rccm.200308-1107OC
21. Davies SP, Carruthers H, Reardon M. Chapter 7 - Adult spontaneous and conventional mechanical ventilation. In: Porter SB, editor. Tidy’s Physiotherapy.
22. Ambrosino N. Principles and practice of mechanical ventilation. Second Edition. Eur Respir J. 2006;28(6):1293. doi:10.1183/13993003/erj.28.6.1293.1
23. Davies A, Moores C. Ventilation of the respiratory system: the importance of its lack of uniformity in disease. In: Davies A, Moores C, editors. The Respiratory System.
24. Sherwood L. Human Physiology: From Cells to Systems. Cengage Learning; 2012.
25. Schranz C, Becher T, Schädler D, Weiler N, Möller K. Model-based setting of inspiratory pressure and respiratory rate in pressure-controlled ventilation. Physiol Meas. 2014;35(3):383–397. doi:10.1088/0967-3334/35/3/383
26. Bourti M, Belaguid A. The effect of endotracheal tube resistance and respiratory frequency on PCO2 management during pressure-controlled ventilation: a modelling study. In: Ezziyyani M, Kacprzyk J, Balas VE, editors. Lecture Notes in Networks and Systems. Vol. 905. Nature Switzerland: Springer; 2024:11–19.
27. Bourti M, Belaguid A. Modeling Endotracheal Tube Resistance in Respiratory System and its Effects on Gas Exchange during Pressure-Controlled Mechanical Ventilation. In:
 © 2025 The Author(s). This work is published and licensed by Dove Medical Press Limited. The
full terms of this license are available at https://www.dovepress.com/terms
and incorporate the Creative Commons Attribution
- Non Commercial (unported, 4.0) License.
By accessing the work you hereby accept the Terms. Non-commercial uses of the work are permitted
without any further permission from Dove Medical Press Limited, provided the work is properly
attributed. For permission for commercial use of this work, please see paragraphs 4.2 and 5 of our Terms.
© 2025 The Author(s). This work is published and licensed by Dove Medical Press Limited. The
full terms of this license are available at https://www.dovepress.com/terms
and incorporate the Creative Commons Attribution
- Non Commercial (unported, 4.0) License.
By accessing the work you hereby accept the Terms. Non-commercial uses of the work are permitted
without any further permission from Dove Medical Press Limited, provided the work is properly
attributed. For permission for commercial use of this work, please see paragraphs 4.2 and 5 of our Terms.