Back to Journals » Medical Devices: Evidence and Research » Volume 18
Mobile Application for Visualization and Analysis of Impedance Cardiography Signals
Authors Chołuj MN, Śmigielski BT, Cybulski G ![]()
Received 6 May 2025
Accepted for publication 1 November 2025
Published 1 December 2025 Volume 2025:18 Pages 615—625
DOI https://doi.org/10.2147/MDER.S538764
Checked for plagiarism Yes
Review by Single anonymous peer review
Peer reviewer comments 2
Editor who approved publication: Dr Scott Fraser
Milena Natalia Chołuj, Bartosz Tomasz Śmigielski, Gerard Cybulski
Warsaw University of Technology, Faculty of Mechatronics, Institute of Metrology and Biomedical Engineering, Warsaw, Poland
Correspondence: Gerard Cybulski, Warsaw University of Technology, Faculty of Mechatronics, Institute of Metrology and Biomedical Engineering, sw. A. Boboli 8, Warsaw, 02-525, Poland, Email [email protected]
Background: Bioimpedance measurement is a noninvasive diagnostic method that enables the assessment of the condition of internal organs and their activity by recording changes in impedance of the examined body area. One of the bioimpedance techniques that allows the evaluation of cardiac mechanical activity, including the estimation of stroke volume, is impedance cardiography (ICG).
Purpose: The aim of this project was to create a computer program written in widespread Java, a versatile language, valued for its reliability, scalability, and built-in features that optimize application performance. The application dedicated to mobile devices, written using the Android Studio environment, enables visualization of ICG signals simultaneously with one channel of electrocardiographic signal (ECG) and allows the preliminary analysis of basic hemodynamic parameters.
Methods: The signal analysis included determination of heart rate (HR), stroke volume (SV), cardiac output (CO), and left ventricular ejection time (LVET).
Discussion and Conclusions: The program allows the user the quick visual check of the recorded signal quality, browse the traces and manually select the characteristic points on the ECG and ICG waveforms, which are then used to calculate the ICG-derived cardiac parameters. It may be used to visualize ECG and ICG signals by anyone, who could enter ICG data formatted in three text columns where each row reflects a sample of ECG, first derivative of ICG signal (dz/dt) and basic impedance (Z0).
Keywords: mobile application, impedance cardiography, cardiac output
Introduction
Bioimpedance measurement is a non-invasive diagnostic method that enables the assessment of the condition of internal organs and their activity by recording the changes in impedance of the examined body area. One of the bioimpedance techniques that allows the evaluation of cardiac mechanical activity, including the estimation of stroke volume, is impedance cardiography (ICG). This method is based on physical measurement and analysis of changes in the impedance of a subject’s chest over time.1–8
There is an increasing tendency to use dedicated mobile applications to display the parameters obtained from medical tests. Smartphones often have capabilities similar to those of classic notebook computers. Their advantage is that, among other properties, their size is exceptionally small compared to conventional equipment and their use is intuitive.
Despite ubiquitous applications dedicated to portable computers or smartphones for displaying medical data, we were not able to find a program designed for ICG data visualization and analysis on mobile devices. However, several programs have been developed for non-mobile computers. A good example is the PhysioFlow Enduro designed for on MS-Windows™ (Windows 10 or newer operating system) provided by the Manatec Biomedical company. This software enables visualization of the one channel of electrocardiographic signal and dZ/dt signals on a computer screen, and allows the determination of 13 hemodynamic parameters during rest or physiological exercise tests.6
The controversies around the verification of ICG resulted in a skeptical approach by health authorities to this technique. According to our knowledge there is only one device commercially available with FDA clearance (PhysioFlow Enduro). However, this technique seems to us as a very promising, especially in mobile applications, as the only method which is able to continuously monitor hemodynamics outside the laboratory or clinic. Since in our lab we have been collecting a large number of ICG data saved in specialized format of ReoMonitor9 system it was decided to develop a handy program allowing fast access to them. Thus, the aim of this project was to create a mobile application, written in Java with use of the Android Studio environment, which enables the visualization of impedance cardiography signals (ICG) and one channel of electrocardiographic signal (ECG), as well as approximate estimation of four cardiac parameters. These parameters were heart rate (HR), stroke volume (SV), cardiac output (CO), and left ventricular ejection time (LVET), which were calculated using points manually selected on the graphs by the user. The application should also allow to acquire the files from the ReoMonitor9 and convert the data into three-columns text format (ECG, dz/dt, Z0). Ability to acquire three-column text data would allow other users not having ReoMonitor system to use the application.
Generally, the analysis of the ICG signals is performed automatically and off-line, with a visualization of trends. But, when the recording is going on it is it very useful for operator to check, from time to time, the quality of the signal, especially when the subject is exercising (e.g. on cycloergometer or treadmill etc). This might be done by Bluetooth connection. We expect that operator is familiar with the ICG signal pattern. Thus, we decided to give a nice tool to verify some cardiac parameters changes using the manual pointing the characteristic points and calculate the cardiac parameters, especially, when a specific cardiovascular reaction to the exercise stimuli or arrhythmia events occurs.
Methods
Impedance Cardiography
The impedance cardiography (ICG) method is based on monitoring the changes in the current conductivity of the chest. Compared to other tissues, blood and plasma are very good conductors; therefore, the measurement of the changes in body segment conductivity mainly reflects the modification in body fluid impedance. Its dynamic changes (ΔZ) are primarily caused by blood ejection into the large, expandable arteries. The ICG signal showed changes in impedance of this volume over time (dZ/dt).8–10
ECG signals were simultaneously acquired and recorded during ICG monitoring. It serves as a reference for the ICG waveform, allowing the estimation of several hemodynamic parameters for each cardiac cycle.11 Particularly, it is important to detect the onset of the QRS complex, which reflects the beginning of depolarization of the ventricles of the heart muscle.12
ECG and ICG waveforms are used to determine various hemodynamic parameters, including HR, SV, CO. Stroke volume is defined as the volume of blood pumped into the aorta during one heart cycle.6 It can be calculated using Kubick’s formula (1).13

where ρ is the blood resistivity [Ω · cm], L0 is the distance between the receiving electrodes [cm], Z0 is the impedance of the segment limited by the receiving electrodes [Ω], ET (or LVET) is the ejection time from the left ventricle [s], and (dZ/dt)max is the maximum amplitude of the first derivative of the ICG signal.
The value of blood resistivity is assumed to be constant at approximately 150 Ω·cm,12 whereas the distance between the receiving electrodes is usually approximately 20 cm, and depends on the size of the subject’s chest, and those data are set as default with an extra option to change. Information regarding the value of the ET parameter and (dZ/dt)max was obtained from the characteristic points on the ICG curve, whereas Z0 was determined from the signal of the basic impedance (Figure 1). The electrodes topography is presented on the right part of Figure 1 which also visualizes L0 interpretation.
 |
Figure 1 On the left: ICG and one channel of ECG waveforms with marked characteristic points (based on14) Q wave in the tested cycle is labeled as Q1, Q wave in the next cycle is labeled as Q2, opening of aortic valve is labeled as B, maximum systolic flow is labeled as C and closing of pulmonal valve is labeled as X. The electrodes topography and L0 definition is presented on the right side. A and R denotes application and receiving electrodes, respectively. |
Cardiac output (CO) is defined as the volume of blood pumped by the heart into the aorta within one minute. It was determined as the product of SV and HR (2):14

Original Program Description
Our mobile application was created using the Java programming language in Android Studio, an integrated development environment (IDE) offers advanced tools to support the software design for Android devices. Additionally, the MPAndroidChart library was used for data visualization and chart generation, thereby improving the clarity of the displayed information.15 The selection of the Java programming language was primarily driven by its status as one of the two principal languages employed in the development of applications for the Android operating system. Furthermore, Java possesses broader recognition and a more extensive user base compared to Kotlin, the alternative language utilized in Android application development.
Data Format and Decoding
The files obtained using the ICG device ReoMonitor were saved in the specific, dedicated format presented in Figure 2. Originally, data were saved in 4096 bytes sections with 4 bytes header and in 4092 sections containing alternating ECG and dZ/dt data bytes. The header begins with 0, then is the ID of the recording (0–255), the third byte is reserved for presenting the occurrence of the patient marker, and the fourth byte contains information on the basic impedance level (Z0). Originally, Z0, which is a slowly changing value, was acquired every 2046 ECG and ICG sample pairs, corresponding to approximately 5 s (assuming 200 Hz sampling frequency). Data should be converted from an unsigned character type into text format using UTF-8 encoding.
 |
Figure 2 ReoMonitor data format (according to16). |
Calibration of the Signal
The first data section of the file contains 4096 bytes collected during the calibration procedure, which are used to set the proper level of the signal amplitudes.
The maximum value in the calibration section is used to calibrate the dZ/dt signal. Subsequently, the most frequently occurring value in the same section was determined to establish a reference level. Once these two values are obtained, a subtraction operation is performed to determine the difference between them. Finally, the entire signal in the remaining sections was divided by this value, allowing for data normalization and enabling further analysis.
At the beginning of each recording the calibration signal is created as a reference also for Z0 calculations. It is equivalent to 20 Ω. The value of present Z0 (which is changing during examination) is calculated as a division of the current signal level by the reference value, obtained for 20 Ω calibration signal and multiplied by 20 Ω.16
Statistical Analysis
The results from two independent observers were compared to assess the consistency and repeatability of the calculations obtained using the application. Both observers marked six sets of characteristic points for two positions: tilted (12 participants: 6 Male, 6 Female) and supine (11 participants from the same group, 5M, 6F). We used data acquired, analyzed, and described in another study,17 collected from young, healthy individuals (age range: 23–33). The results were evaluated using correlation plots, the coefficient of determination R2, and the Bland-Altman method (agreement interval ±1.96 SD).
Algorithm and User Interface
The designed and developed program allows uploaded data to be displayed on two graphs: single-channel ECG and ICG. The traces can be moved simultaneously to allow the data to be browsed. It is also possible to manually mark some characteristic points on the graphs to perform calculations of basic heart parameters, such as HR, SV, and CO, using formulas implemented in the code and individualized subject’s parameters entered by the user.
To decode data from the ReoMonitor, it is necessary to import and store the data in the phone’s internal memory. In the first step, the user selects an appropriate file to be decoded. The user then has the option to save the decoded data to the memory of the device, display it for browsing and preliminary analysis, or choose another file for decoding. The decoded data are saved in a text file with the same name as the original file but with the additional label “-converted.” This file contains three columns: the first column corresponds to ECG values, the second column shows dZ/dt, and the third column contains Z0 values.
When the user enters the blood resistivity value (expressed in ohms multiplied by centimeters) and the distance between the receiving electrodes (expressed in centimeters) or approves default values (Figure 3), the display data on the charts are enabled.
 |
Figure 3 Input fields of the blood resistivity, the distance between the receiving electrodes values and confirmation button – screen image. Default values of blood resistivity (150 Ohm·cm) and electrodes spacing (20 cm) are automatically filled. |
Once these parameters were confirmed, two charts showing calibrated ECG and ICG signals appeared. The user can determine the instantaneous values of SV, HR, and CO by interacting with the chart and marking the corresponding characteristic points (Figure 4).
 |
Figure 4 ECG and ICG charts with marked characteristic points – screen image. |
A characteristic point is marked by clicking on the selected spot on the chart, which places a marker (visible as crossing of vertical and horizontal lines). If the user deems the chosen spot correct, it should be confirmed by pressing the button assigned to that particular characteristic point (Q1, Q2, B, C, and X). The proper manual selection of Q/B/X points depends on the experience of the operator. It might be assumed as a point on ascending slope of dz/dt signal occurring after Q in ECG and positioned at the level of 15% ICG amplitude. The problem of correct B identification (manual or automatic) was discussed in the Lozano’s et al18 study. The X point is defined as the lowest ICG signal value occurring after C.
The position of the marked point can be modified any number of times because the cardiac parameters are calculated only after the positions of all points are confirmed using a separate “CONFIRM MARKERS” button. The values of SV, HR, and the resulting CO parameters are presented in the following units: [mL], [1/min], and [l/min].
The general scheme of the application is presented in the Figure 5.
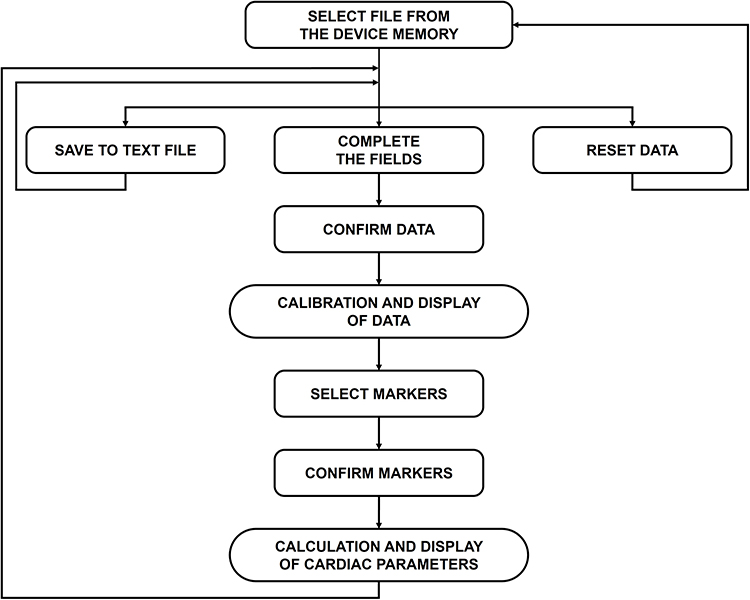 |
Figure 5 Block scheme of the designed application. |
Results
The results of the statistical analysis of the program for the supine and tilted positions are shown in Figures 6–8. The values changed between positions: HR decreased, SV increased, and CO decreased slightly in the tilted position. These changes agreed with the approach presented in the literature.18,19
 |
Figure 6 Heart rate values obtained for supine position ((a) correlation plot, (b) Bland-Altmann plot) and tilted position ((c) correlation plot, (d) Bland-Altmann plot). Plots (e and f) present both supine and tilted position datasets combined ((e) correlation plot, (f) Bland-Altmann plot). The data labeled “HR I” were obtained from measurements conducted by the first observer, whereas the label “HR II” refers to data derived from measurements performed by the second observer. |
 |
Figure 7 Stroke volume values obtained for supine position ((a) correlation plot, (b) Bland-Altmann plot) and tilted position ((c) correlation plot, (d) Bland-Altmann plot). Plots (e and f) present both supine and tilted position datasets combined ((e) correlation plot, (f) Bland-Altmann plot). The data labeled “SV I” were obtained from measurements conducted by the first observer, whereas the label “SV II” refers to data derived from measurements performed by the second observer. |
 |
Figure 8 Cardiac output values obtained for supine position ((a) correlation plot, (b) Bland-Altmann plot) and tilted position ((c) correlation plot, (d) Bland-Altmann plot). Plots (e and f) present both supine and tilted position datasets combined ((e) correlation plot, (f) Bland-Altmann plot). The data labeled “CO I” were obtained from measurements conducted by the first observer, whereas the label “CO II” refers to data derived from measurements performed by the second observer. |
Figure 6 shows the set of correlations and Bland–Altman plots for the HR values obtained by independent observers. The data labelled “HR I” were obtained from measurements conducted by the first observer, whereas the label “HR II” refers to data derived from measurements performed by the second observer. For the supine position, the R2 value calculated for the data collected by independent observers was 0.9955. The bias in this dataset is 0.257±1.258%. For the tilted position, the R2 value was 0.9959 and the bias was −0.003±1.073%. For both datasets combined, the R2 value was 0.9982 and the bias was 0.011±1.212%.
Figure 7 shows the set of correlations and Bland–Altman plots for the SV values obtained by independent observers. The data labelled “SV I” were obtained from measurements conducted by the first observer, whereas the label “SV II” refers to data derived from measurements performed by the second observer. For the supine position, the R2 value calculated for the data collected by independent observers, was 0.9929. The bias in this dataset was 0.968±3.884%. For the tilted position, the R2 value was 0.9873 and the bias was 0.138±4.515%. For both datasets combined, the R2 value was 0.9957 and the bias was 0.212±4.395%.
Figure 8 shows the set of correlations and Bland–Altman plots for the CO values obtained by independent observers. The data labelled “CO I” were obtained from measurements conducted by the first observer, whereas the label “CO II” refers to data derived from measurements performed by the second observer. For the supine position, the R2 value calculated for the data collected by independent observers was 0.9883. The bias in this dataset was 1.544±3.707%. For the tilted position, the R2 value was 0.9867 and the bias was 0.065±4.713%. For both datasets combined, the R2 value was 0.9908 and the bias was 0.063±4.737%.
Discussion and Conclusions
We developed a computer program written in Java using the Android Studio environment that enables visualization of impedance cardiography signals (ICG) and one channel of electrocardiographic signals (ECG). It is dedicated to mobile devices and allows the preliminary analysis of basic hemodynamic parameters. This application allows data to be entered using a file previously recorded in the ReoMonitor and imported into memory. Although this system (ReoMonitor) is not widely distributed, we hope that application might be used to visualize ECG and ICG signals by anyone, who could enter ICG data formatted in three text columns where each row reflects a sample of ECG, first derivative of ICG signal (dz/dt) and basic impedance (Z0), respectively. The application has a preset sampling frequency to 200 Hz (which is used in ReoMonitor9), however, it may be easily modified to other values. The primary aim of the work was to create a program for mobile phone which could change it into a handy viewer for checking the signal quality during the outside the laboratory tests. However, the program allows also the user to manually select characteristic points on the ECG and ICG waveforms, which is essential for obtaining ICG-derived cardiac parameters. The signal analysis included heart rate (HR), stroke volume (SV), cardiac output (CO), and left ventricular ejection time (LVET). To the best of our knowledge, there are no commercially available mobile applications for the presentation and analysis of ICG data that offer similar functions.
Hemodynamic parameters constitute a mathematical description of the physical processes that occur in the body and are related to the functioning of the circulatory system. Thus, these parameters, especially their changes, allow determination of the subject’s heart activity. The monitoring of hemodynamic parameters enables the detection of abnormalities in the functioning of the cardiovascular system and may contribute to faster treatment.
The developed application facilitates easy browsing of ICG data on mobile device and apply fast calculations of basic cardiac parameters using previously recorded data on ReoMonitor system.9,16 The obtained results depend on the precision of characteristic points selection by the user. However, this characteristic property of many indirect measurement methods. However, the ability of the operator to mark these points gives the user full supervision of skipping the noisy signal with artifacts, which is difficult to omit during the automatic calculations.
The program was verified by evaluating the reproducibility of HR, SV, and CO calculations performed after the selection of characteristic points by two independent operators. We are aware of the problem of Q/B/X points proper identification. There are several methods of B and X selection especially using the programs for automatic calculations which were described in the source papers and summarized in monograph.16 The proper manual selection of Q/B/X points depends on the experience of the operator. In our study both operators had theoretical knowledge about ICG and similar, above the beginners level, experience with Q/B/X points identification. We have to insist that the application is not a measurement device but only a handy viewer with rough estimation of SV, CO and ET.
We are aware that the group of subjects is relatively small, but the data obtained were not used to draw physiological conclusions but only to illustrate the correct operation of the program. All obtained R-squared values of the linear regression between the calculated parameters were no lower than 0.9867. The mean difference of all results was 0.362%, and the mean standard deviation was 1.672%. These results demonstrate that the easy-to-use application enables repeatable ICG calculations with high accuracy that are independent of the moderate experienced operator.
Acknowledgments
This study was supported by the Warsaw University of Technology.
Disclosure
The authors report no conflicts of interest in this work.
References
1. Wentao Y, Yumiao W, Luanluan Y, Xin L, Xiaopei C. Impedance cardiography parameters reflecting left ventricular function are markers of pulmonary arterial hypertension. Front Cardiovasc Med. 2025;12:1526471. doi:10.3389/fcvm.2025.1526471
2. Zhang Y, Bu F, Qi Y, Zhang D, Zhang H, Cui X. Impedance cardiography is a potent non-invasive method in cardiac output measurement and pulmonary arterial hypertension risk assessment. Anatol J Cardiol. 2025;29(7):347–354. doi:10.14744/AnatolJCardiol.2025.5108
3. Viera AJ, Hart L, Gomez Altamirano P, Tuttle B, Price A, Sherwood A. Use of impedance cardiography to guide blood pressure lowering medication selection: systematic review of randomized controlled trials. Am J Hypertens. 2024;37(11):916–923. doi:10.1093/ajh/hpae090
4. Zhao X, Zhou R, Ning L, Guo Q, Liang Y, Yang J. Atrial fibrillation detection with single-lead electrocardiogram based on temporal convolutional Network-ResNet. Sensors. 2024;24(2):398. doi:10.3390/s24020398
5. Chołuj MN, Śmigielski BT, Cybulski G. Impedance cardiography - determined parameters and their application in assisting patient diagnosis: a review. Acta Phys Pol A. 2024;4:553–557. doi:10.12693/APhysPolA.146.553
6. PhysioFlow website. Available from: https://www.physioflow.com/products_physioflow.php.
7. Little WC, Braunwald E. Assessment of cardiac function. In: Heart Disease: A Text Book of Cardiovascular Medicine. Philadelphia, PA: W.B. Saunders; 1997:421–460.
8. Krzesiński P, Gielerak G, Kowal J. Impedance cardiography – a modern tool for monitoring therapy of cardiovascular diseases. Kardiol Pol. 2009;67:65–71.
9. Cybulski G, Książkiewicz A, Łukasik W, Niewiadomski W, Pałko T. Ambulatory monitoring device for central hemodynamics and ECG signals recording on PCMCIA flash memory cards. In:
10. Lange RA, Davis L. Assessment of Cardiovascular Function. Baltimore: Williams & Wilkins A Waverly Company; 1997:480–516.
11. Sherwood A, Allen MT, Fahrenberg J, Kelsey RM, Lovallo WR, van Doornen LJ. Methodological guidelines for impedance cardiography. Psychophysiology. 1990;27(1):1–23. doi:10.1111/j.1469-8986.1990.tb02171.x
12. Qureshi F, Krishnan S. Wearable hardware design for the Internet of Medical Things (IoMT). Sensors. 2018;18(11):3812. doi:10.3390/s18113812
13. Kubicek WG, From AH, Patterson RP, et al. Impedance cardiography as a noninvasive means to monitor cardiac function. J Assoc Adv Med Instrum. 1970;4(2):79–84.
14. Vincent JL. Understanding cardiac output. Crit Care. 2008;12(4):174. doi:10.1186/cc6975
15. GitHub website. Available from: https://github.com/PhilJay/MPAndroidChart.
16. Cybulski G. Ambulatory impedance cardiography. The systems and their applications. In: Lecture Notes in Electrical Engineering. Vol. 76.
17. Cybulski G, Michalak E, Koźluk E, Piątkowska A, Niewiadomski W. Stroke volume and systolic time intervals: beat-to-beat comparison between echocardiography and ambulatory impedance cardiography in supine and tilted positions. Med Biol Eng Comput. 2004;42:707–711. doi:10.1007/BF02347554
18. Lozano DL, Norman G, Knox D, et al. Where to B in dZ/dt. Psychophysiology. 2007;44(1):113–119. PMID: 17241147. doi:10.1111/j.1469-8986.2006.00468.x
19. Kubicek WG, Karenegis JN, Patterson RP, Witsoe DA, Mattson RH. Development and evaluation of an impedance cardiac output system. Aerospace Med. 1966;37:1208–1212.
 © 2025 The Author(s). This work is published and licensed by Dove Medical Press Limited. The
full terms of this license are available at https://www.dovepress.com/terms
and incorporate the Creative Commons Attribution
- Non Commercial (unported, 4.0) License.
By accessing the work you hereby accept the Terms. Non-commercial uses of the work are permitted
without any further permission from Dove Medical Press Limited, provided the work is properly
attributed. For permission for commercial use of this work, please see paragraphs 4.2 and 5 of our Terms.
© 2025 The Author(s). This work is published and licensed by Dove Medical Press Limited. The
full terms of this license are available at https://www.dovepress.com/terms
and incorporate the Creative Commons Attribution
- Non Commercial (unported, 4.0) License.
By accessing the work you hereby accept the Terms. Non-commercial uses of the work are permitted
without any further permission from Dove Medical Press Limited, provided the work is properly
attributed. For permission for commercial use of this work, please see paragraphs 4.2 and 5 of our Terms.