Back to Journals » Cancer Management and Research » Volume 12
MicroRNA-146a as a Prognostic Biomarker for Esophageal Squamous Cell Carcinoma
Authors Sadegh Shesh Poli M, Khajeniazi S, Behnampour N, Kalani MR ![]() , Moradi A, Marjani A
, Moradi A, Marjani A
Received 31 August 2019
Accepted for publication 22 January 2020
Published 11 February 2020 Volume 2020:12 Pages 973—980
DOI https://doi.org/10.2147/CMAR.S229397
Checked for plagiarism Yes
Review by Single anonymous peer review
Peer reviewer comments 3
Editor who approved publication: Professor Seema Singh
Maryam Sadegh Shesh Poli,1 Safoura Khajeniazi,2 Nasser Behnampour,3 Mohammad Reza Kalani,4 Abdolvahab Moradi,5 Abdoljalal Marjani6
1School of New Technologies, Golestan University of Medical Sciences, Gorgan, Iran; 2Medical Cellular and Molecular Research Center, Golestan University of Medical Sciences, Gorgan, Iran; 3Health Management and Social Development Research Center, Gorgan, Iran; 4Molecular Medicine Research Center, Golestan University of Medical Sciences, Gorgan, Iran; 5Gastroenterology and Hepatology Research Center, Golestan University of Medical Sciences, Gorgan, Iran; 6Abdoljalal Marjani Metabolic Disorders Research Center, Department of Biochemistry and Biophysics, Faculty of Medicine, Golestan University of Medical Sciences, Gorgan, Iran
Correspondence: Abdolvahab Moradi
Gastroenterology and Hepatology Research Center, Golestan University of Medical Sciences, Gorgan 4934174515, Iran
Tel +98 9111772107
Email [email protected]
Abdoljalal Marjani
Metabolic Disorders Research Center, Department of Biochemistry and Biophysics, Faculty of Medicine, Golestan University of Medical Sciences, Gorgan, Golestan Province 4934174515, Iran
Tel +98 171 4421651
Fax +98 171 4440225
Email [email protected]
Background and Aims: MicroRNAs including miR146a have a regulatory role on the expression of genes and act with binding to 3ʹ-UTR region of the genes. Cyclooxygenase-2 (COX-2) is involved in carcinogenesis as an inflammatory marker, and microRNA-146a (miR-146a) as a negative regulatory factor. We aimed to evaluate miR146a expression as a prognostic or diagnostic biomarker for esophageal squamous cell carcinoma (ESCC) and also an association between miR146a and COX2 expression.
Materials and Methods: We quantified the level of miR-146a and COX-2 expression in cancerous and adjacent normal tissue samples obtained from 34 patients with ESCC, using real-time–PCR. Statistical analyses were conducted using one-sample t-test. Receiver-operating characteristic (ROC) curve and Kaplan–Meier analysis were applied to assay miR146a as a diagnostic and prognostic marker, respectively, during 4 years of the study. Furthermore, the Cox regression model was performed to assay the hazard ratio (HR). The association between miR-146a and COX2 expression level in ESCC patients was evaluated by nonparametric Spearman’s rho analysis.
Results: The results revealed a reduction of miR-146a expression in 50% of cancerous tissue when compared with adjacent normal regions (P-value=0.127). COX-2 expression in 80% of ESCC patients was higher than in the controls (P-value=0.001). Overall, in 60% of cases, direct association was seen between microRNA-146a and COX-2 expression level (correlation coefficient= 0.438, P-value=0.011). COX2 can be considered as a diagnostic biomarker (AUC=0.834, sensitivity=72%, specificity =83%, P-value< 0.0001) but miR146a cannot be considered as a diagnostic biomarker (AUC=0.553, sensitivity=88%, specificity =28%, P-value=0.453). Survival analysis by Kaplan–Meier method showed miR146a and COX2 expression can be probably considered as prognostic biomarkers for ESCC because patients with high expression of miR146a had 7 months shorter life span and patients with low expression of COX2 had 8 months shorter life span.
Conclusion: COX2 expression is a diagnostic biomarker. MiR-146a and COX2 expression can probably be considered as prognostic biomarkers for survival in ESCC.
Keywords: miR-146a, cyclooxygenase-2, esophageal cancer
Introduction
Esophageal cancer is the eighth most common cancer worldwide and the sixth cause of mortality due to cancer. The overall 5-year survival is 15% to 25% in patients with esophageal cancer.1 Early diagnosis was shown to be promising to improve overall 5-year survival in more than 90% of the ESCC cases. Therefore, the finding of early diagnostic, as well as prognostic biomarkers is important for ESCC to predict the survival and effectiveness of treatment in patients. MicroRNAs have been introduced as a biomarker in different cancers.2
MicroRNAs (miRNA) are belonging to small non-coding regulatory RNA inhibit the expression of specific genes. MicroRNAs prevent protein expression by cleavage of the genes’ mRNA after binding to their3ʹ-UTR or translational inhibition of the mRNA.3 Nowadays, more than 9000 microRNAs have been known in plants, animals, and viruses.4 Over 700 microRNAs have been detected in humans.5,6 MicroRNAs can regulate most of the cellular processes (eg, cellular proliferation, differentiation, and apoptosis) via mRNA degradation or protein synthesis distribution functions.7–9 MiRNAs may play an important role as a tumor suppressor or as oncogenes.10–14 Recent studies reported microRNAs and COX-2 involvement in esophageal cancer.15–19 Mir-146a was shown to have roles in the development of breast, lung, pancreatic, esophageal squamous and gastric carcinomas. Up- and down-regulation of miRNA-146a are reported in the mentioned cancers.20–23
Numerous microRNAs were observed in esophageal cancer patients including miR-145, miR-133a, miR-133b, miR-375, miR-21, miR-184, miR-221 and mir-146a. Each of them acts in the specific pathways in the pathogenesis of esophageal cancer.24,25 There were two copies of the genes encoding miR-146, so-called miR-146a and miR-146b.26 MiR-146a directly binds to 3ʹ-UTR COX-2 gene and has a key regulatory role on COX-2 expression. Deletion of miR146a by antagomiR (complementary sequence of miR-146a that cut off binding miR146a to 3′ UTR COX-2) or existence of mutation in 3ʹ-UTR COX2 upregulated COX2 and subsequently prostaglandin that control cell proliferation.27 Polymorphism in 3ʹ-UTR COX2 may delete the miR-binding site and upregulatesCOX2 expression.28 In this study, we assessed miR-146-a and COX-2 expression level in the patients with ESCC who 44% had 8473 SNP in 3ʹ-UTR COX2. Furthermore, we analyzed miR146a and COX2 expression levels as a diagnostic or prognostic biomarker.
Materials and Methods
Samples
We collected fresh cancerous and adjacent noncancerous marginal tissues from 34 ESCC patients during 2015–2017. Patients had informed consent to sampling in this study as well as long-term follow-up for the evaluation of the prognosis.
RNA Isolation
Total RNA was extracted from the tissue by Trizole reagent by the manufacturer’s protocol. RNA was treated with DNase-I (Thermo scientific) to reduce or eliminate DNA debris and was incubated 30 min at 37°C. Consequently, the DNase-I was inactivated by adding 1 μL 0.5M EDTA and heating at 80°C for 2 min.
Poly (A)/cDNA Synthesis Reaction
Mir-X miRNA First-Strand Synthesis Kit (Clontech Laboratories, Inc. cat.no.638515) was applied for cDNA synthesis. According to the manufacturer, 5µL mRQ Buffer (2x), 3.75 µL RNA sample (0.25–8 μg), 1.25 µL mRQEnzyme (including polyA polymerase and Reverse Transcriptase) were mixed and incubated for 60 mins at 37°C. The enzymes were inactivated at 85°C for 5 min, and the final volume was reached to 100mL by adding 90 μL ddH2O.
Quantification of miRNA146a and U6 by Real-Time–PCR
Real time-PCR (using a “sequence detection system the ABI Prism 7300, Applied Biosystems”) condition for mir146a expression was set as following by 12.5 μl2X qPCR Master Mix Green high Rox (Amplicon, Denmark), 0.5 μL miR-specific primer (10 μM) (MystiCq® microRNAs qPCR Assay Primer, hsa-miR-146a-5p, MIRAP00182, Sigma Aldrich, Manchester, UK), 0.5 μL mRQ 3ʹ Primer, 9.5μldd H2O, 2 μL cDNA. We used the U6 gene as the internal control. The qPCR conditions were set as 95°C 15min, 40 Cycles: 95°C 15 sec, 60°C 1 min. The expression of mir146a was determined relative to the expression of U6 in tumor and normal tissues, using 2−ΔΔCt formula.29
Quantification of COX2 and GAPDH by Real-Time –PCR
The real time-PCR condition for COX2 was set the same as mir146 expression evaluation. GAPDH gene was used as internal control. Initially, 1μg of total RNA was used for the synthesis of first-strand cDNA, using the “cDNA synthesis kit” (Thermo Fisher Scientific, USA). Consequently, COX2 mRNA-specific fragments were amplified by the specific primers (Table 1). The expression of COX-2 was determined relative to the expression of GAPDH in tumor and normal tissues, using 2−ΔΔCt formula.30
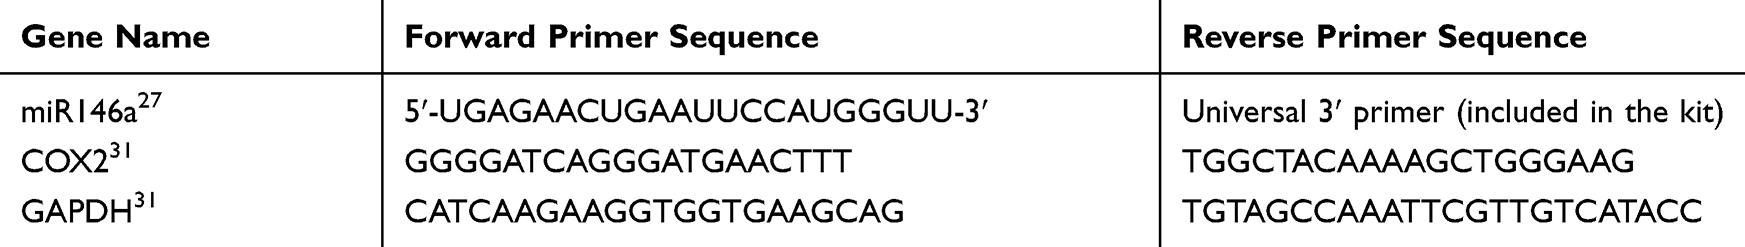 |
Table 1 The Primer Sequences Were Used for Real-Time PCR |
Statistical Analysis
We applied one-sample t-test for evaluating miR146a and COX2 expression levels between cases and controls. The association between miR-146a and COX2 expression level in ESCC patients was evaluated by nonparametric Spearman’s rho analysis and the correlation coefficient was assayed. Pearson Chi-Square test was used to evaluate the association between clinicopathologic variables including age, gender, smoking and histological grade with the expression of miR-146a in tumor tissue samples. ROC and survival analysis were applied to assay miR-146a as a diagnostic or prognostic marker, respectively. These statistical analyses were performed using the SPSS software (version 16.0; SPSS, Chicago, IL, USA).
Results
MicroRNA-146a Expression
The Student’s t-test was used to determine differences in miR-146a level between ESCC and adjacent paracancerous tissue. The miR-146a expression was increased in 50% cancerous tissue rather and decreased in other 50% cancerous tissue than adjacent normal tissue (fold change mean ±SE: 7.68 ± 2.92, P-value=0.127; Figure 1).
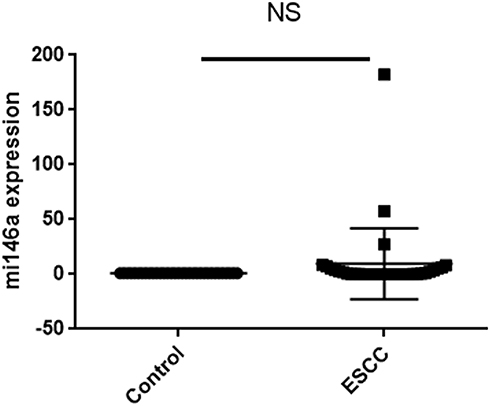 |
Figure 1 MiR-146a expression in cancerous tissue and marginal normal tissue. |
In our work, 44% of the patients had 8473 T>C polymorphism in 3ʹ-UTR COX2 and miR146a expression was lower in patients with 8473 TC (heterozygote) and CC (mutant) genotypes than TT wild type genotype (Table 2). This result was not reported in any of the previous studies.
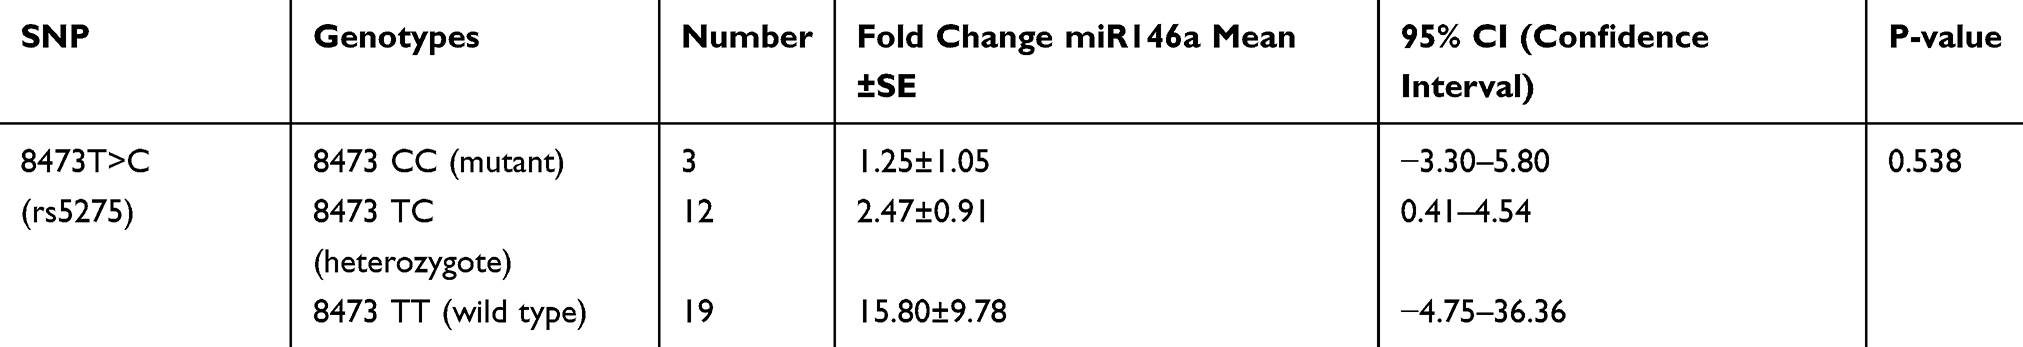 |
Table 2 The Association of Mir146a Expression and 8473 T>C Polymorphism in ESCC |
COX2 Expression
The COX-2 expression level was significantly increased in 80% esophageal cancerous tissues rather than adjacent normal tissues with fold change (mean ± SE: 9.51± 2.42, P=0.001; Figure 2).
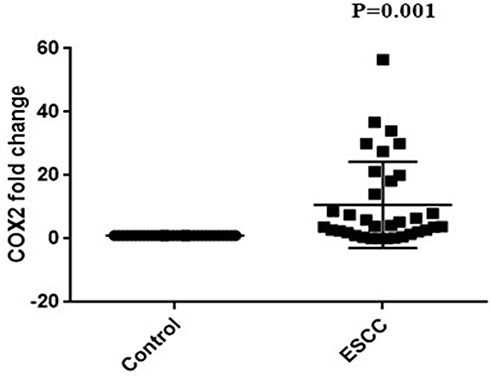 |
Figure 2 COX2 expression in cancerous tissue and marginal normal tissue. |
The Association Between miR-146a and COX2 Expressions
There was a direct association between miR-146a and COX2 expression level in ESCC patients by nonparametric Spearman’s rho test and the correlation coefficient was 0.438 (P-value=0.011, [95% confidence interval (0.1013–0.6850)]; Figure 3, Table 3.
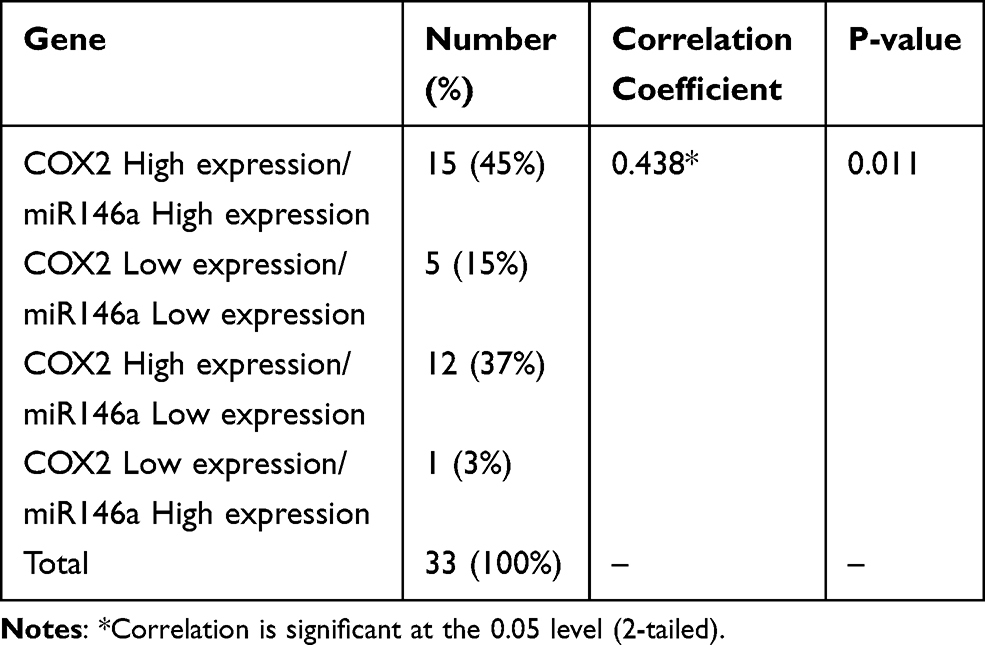 |
Table 3 The Association Between Mir146a and COX2 Expression |
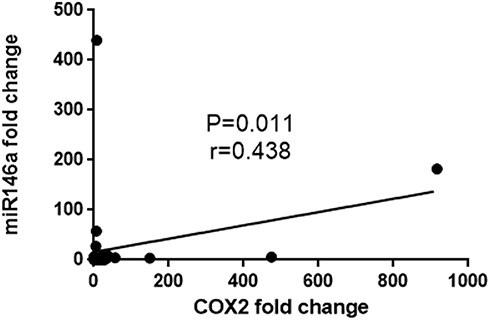 |
Figure 3 Correlation between miR146a and COX2 expression. |
The Association Between miR-146a Expression with Clinicopathologic Variables
Pearson Chi-Square and Spearman ҆ s rho tests were conducted to evaluate the association of age, gender, smoking and histological grade variable with the expression of miR-146a in tumor tissue samples. It seems that miR-146 expression was more increased in age≥65 (P-value=0.09). MicroRNA-146a expression had no association with gender, smoking and histological grade (Table 4).
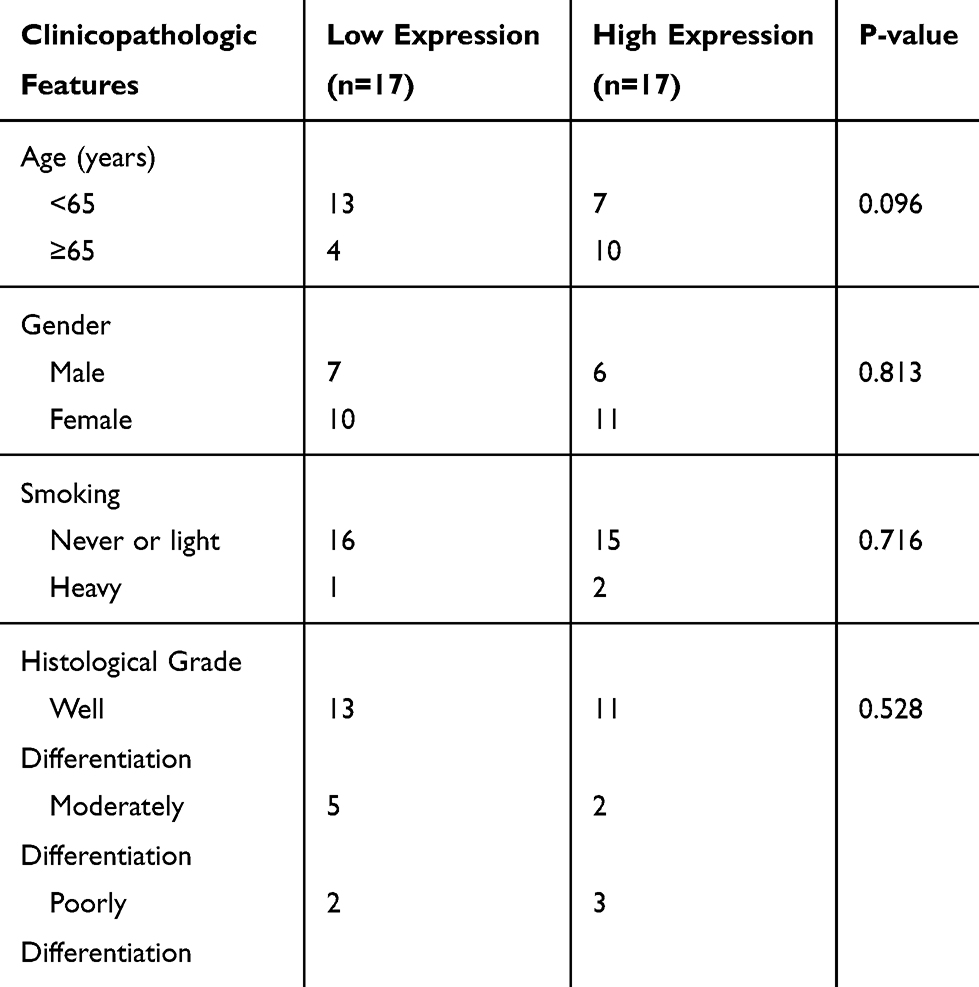 |
Table 4 The Association of miR-146a Expression with Clinicopathologic Variables |
The Association of COX2 Expression and Clinicopathologic Variables
Pearson Chi-Square and Spearman ҆s rho test was conducted to evaluate the association of age, gender, smoking and histological grade variable with COX2 expression in tumor tissue samples. It seems that COX2 expression was more increased in age<65 (P-value=0.031). COX2 expression had no significant association with gender, smoking and histological grade (Table 5).
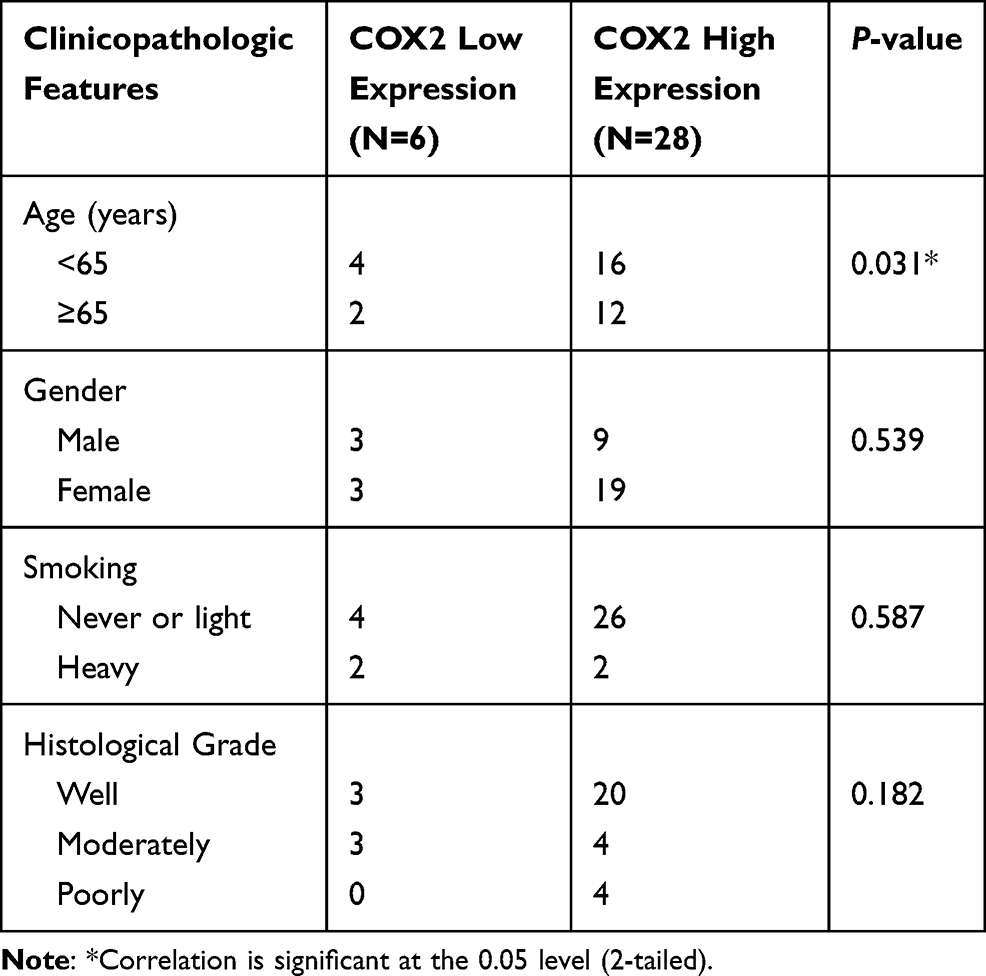 |
Table 5 The Association of COX2 Expression with Clinicopathologic Variables |
ROC Curve for miR146a
MicroRNA-146a expression was increased in 50% cancerous tissue compared with marginal normal tissue (P=0.127). MicroRNA-146a expression cannot be considered as a diagnostic biomarker for ESCC, because it has no sufficient specificity (AUC = 0.553, sensivity=88%, specificity=28%, 95% CI=0.413–0.692, P-value=0.453) (Figure 4).
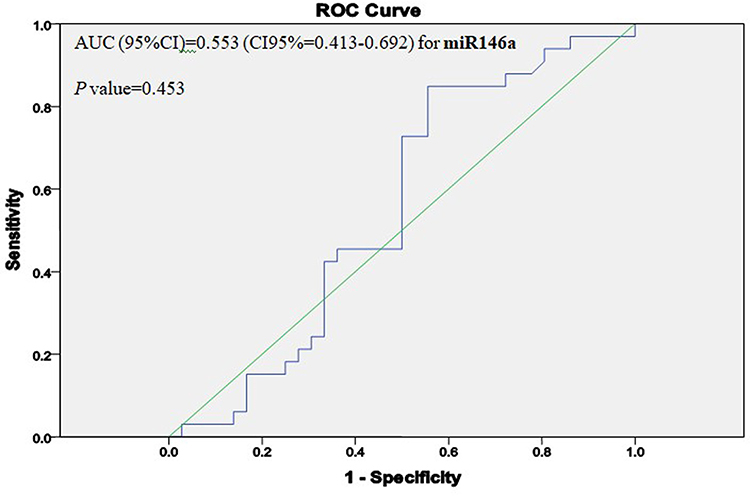 |
Figure 4 The ROC curve shows that miR146a cannot be a diagnostic biomarker for ESCC (P-value=0.453). (AUC=area under the curve). |
ROC Curve for COX2
COX2 expression was increased in 80% cancerous tissue compared with marginal normal tissue (P=0.001). COX2 expression can be considered as a diagnostic biomarker for ESCC (AUC = 0.834, sensivity=72%, specificity=83%, 95% CI=0.736 −0.932, P-value<0.0001) (Figure 5).
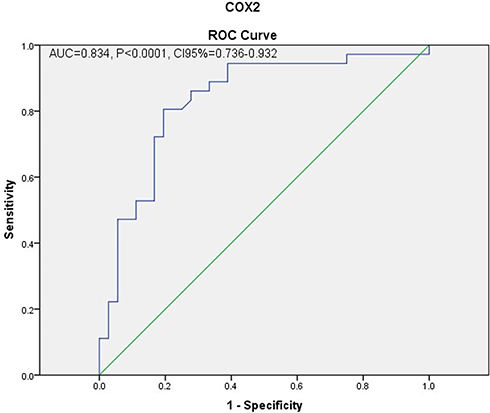 |
Figure 5 The ROC curve shows that COX2 can be a diagnostic biomarker for ESCC (P-value<0.0001). (AUC= area under the curve). |
Survival Analysis Based on miR146a
Kaplan–Meier curve revealed that individuals with high expression of miR146a had a worse overall survival (OS) rather than who have miR146a low expression. Therefore, miR-146a expression can be an independent prognostic factor for overall survival in ESCC (Table 6, Figure 6). The mean overall survival time of patients was 24.4 months (95% CI: 19.09–29.7 months). Eleven patients (30.6%) were alive and 23 patients (63.9%) died and two patients were missed (5.6%) during our follow-up period of 4 years. Furthermore, univariate Cox survival analysis was used to assess the hazard ratios (HRs). Hazard ratio (HR) in patients with high expression miR146a was 1.59 [95% CI=0.66–3.62, P-value=0.269] which represents a higher risk when miR146a expression is higher.
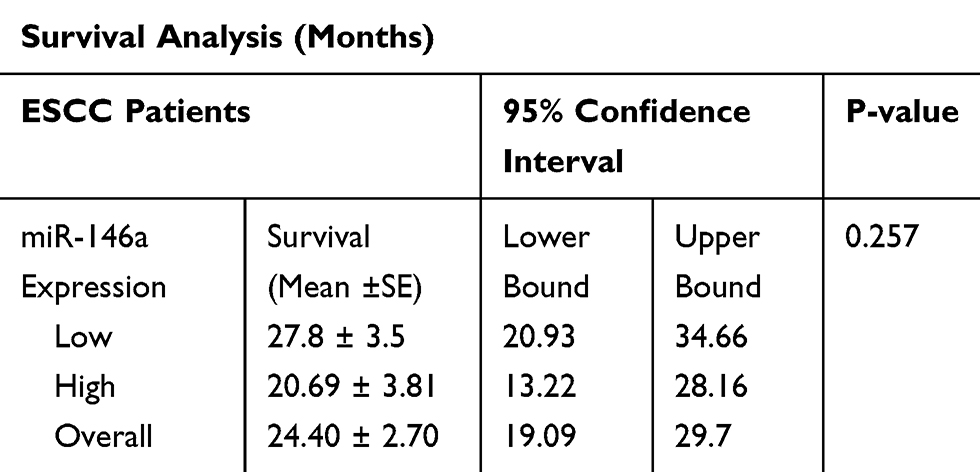 |
Table 6 Survival Analysis for miR146a |
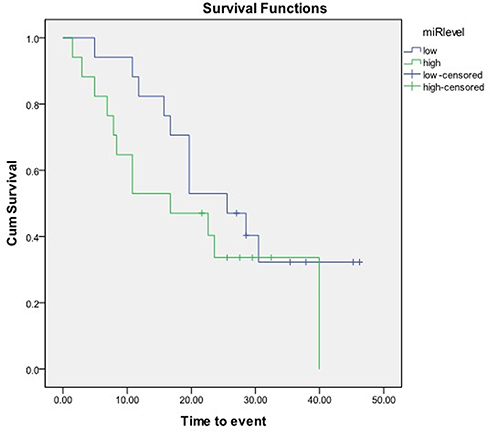 |
Figure 6 Kaplan–Meier curve revealed that individuals with high expression of miR146a had a worse survival rather than low expression. |
Survival Analysis Based on COX2 Expression
Survival analysis based on COX2 expression showed patients with low expression COX2 had 8 months shorter life span than high expression (P-value= 0.125) (Table 7, Figure 7).
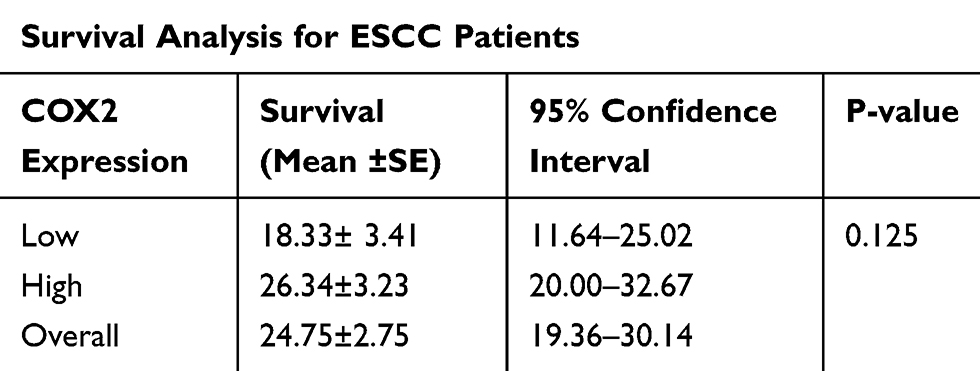 |
Table 7 Survival Analysis for ESCC Based on COX2 Expression |
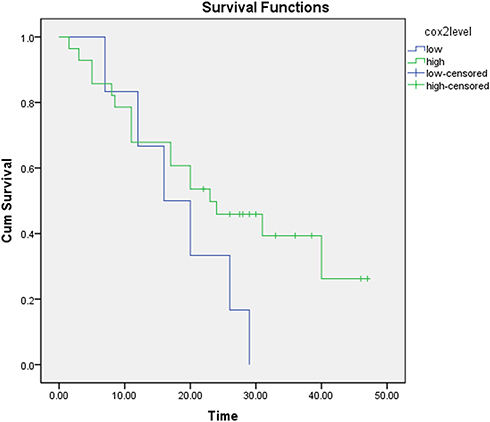 |
Figure 7 Kaplan–Meier curve revealed that individuals with low expression of COX2 had a worse survival rather than low expression. |
Discussion
In this study, we evaluated levels of miR-146a and COX-2 expression in 34 cancerous and marginal normal tissues with ESCC. The expression level of miR-146a was approximately associated with age and was upregulated in 75% men and 70% women age 65 and above. Therefore, age≥65 can be a risk factor for ESCC. But, there was no association between miR146a expression and other clinicopathologic variables including gender, smoking and histological grade. Both miR146a and COX2 expression were upregulated in 45% cases and downregulated in 15% cases. Despite our expectation, patients who had high expression miR146a, they had high expression COX2 as well. This may be described by having a +8473 (TC/CC) SNP (into 3′-UTR COX2) in 44% of the samples, based on our previous project.32
Researchers have previously described that miR-146a directly binds into 3′-UTR COX2 and downregulate COX2 expression and subsequently decreased prostaglandin level. However, the mutation in 3ʹ-UTR COX2 disrupts the miR-binding site somehow prevents the regulatory effect of miR146a on COX2.27 Notably, Ashley et al found an inverse relationship between miR146a and COX-2 expression.27 Wise versa, the direct correlation between miR146a with COX2 expression in our results may discuss based on the presence of 8473 TC/CC SNPs at 3ʹ-UTR COX2 which eliminates miR-146a binding site and subsequently its inhibitory effect. As a result, prostaglandin E2 levels increase and probably the risk of ESCC.
Wong et al reported MiR146a was significantly downregulated in cancerous tissue and serum of ESCC patients. They introduced miR146a as a prognostic and diagnostic biomarker for ESCC.1 Other research mentioned that miR-21 and miR-375 can be used as prognostic biomarkers in esophageal cancer. MicroRNAs expression level can help us the detection of high-risk subjects and designing of sufficient treatment.33 MicroRNAs expression level can help us design drugs against transcription of microRNA or select appropriate therapies for ESCC.34
In our study, the Kaplan–Meier curve demonstrated a worse overall survival (OS) for individuals with high expression of miR-146a so they had 7 months shorter life span rather than patients with low expression miR146a that our results are reversed to Wang et al1. Furthermore, survival analysis based on COX2 expression showed patients with low expression COX2 had 8 months shorter life span than the high expression that our results are not in line with Nozoe et al35. These results probably suggest a high miR-146a level and low COX2 level as a worse prognostic biological marker for ESCC. ROC curve analysis revealed miR146a cannot be a diagnostic biomarker for ESCC but ROC curve analysis showed COX2 expression can be considered as a diagnostic biomarker for ESCC.
Notably, there are computational models to predict the association of miRNAs with diseases and also as a biomarker for the detection of diseases.36–38 Therefore, we suggest using system biology because of decrease cost and time for the detection of ESCC.
Conclusions
MiR146a expression levels cannot be a diagnostic biomarker but COX2 expression can be considered as a diagnostic biomarker for ESCC. MiR146a and COX2 expression may be considered as prognostic biomarkers for ESCC.
Ethics and Consent
This study was approved by the institutional ethics committee; the ethical number is ir.goums.rec.1394.146. All patients provided written informed consent. The study was conducted in accordance with the Declaration of Helsinki.
Acknowledgments
We give great thanks to Dr Sabah Mayahi and Dr Naeme Javid and all patients, physicians, and experts who helped us.
Funding
This work was supported by the “Deputy of Research and Technology” of the Golestan University of Medical Sciences (Gorgan, Iran) under approval number 94063116.
Disclosure
The authors declare no conflicts of interest.
References
1. Wang C, Guan S, Liu F, et al. Prognostic and diagnostic potential of miR-146a in oesophageal squamous cell carcinoma. Br J Cancer. 2016;114(3):290–297. doi:10.1038/bjc.2015.463
2. Fang Y, Fang D, Hu J. MicroRNA and its roles in esophageal cancer. Med Sci Monit. 2012;18(3):RA22–RA30. doi:10.12659/MSM.882509
3. Lauressergues D, Couzigou J-M, Clemente HS. Primary transcripts of microRNAs encode. Nature. 2015;520:90–93. doi:10.1038/nature14346
4. Yang Z, Wu J. Small RNAs, and development. Med Sci Monit. 2006;12(7):RA125–129.
5. Berezikov E, Guryev V, van de Belt J, Wienholds E, Plasterk RHA, Cuppen E. Phylogenetic shadowing and computational identification of human microRNA genes. Cell. 2005;120:21–24. doi:10.1016/j.cell.2004.12.031
6. Grif S, Griffiths-Jones S. The microRNA Registry. Nucleic Acids Res. 2004;32(17):109–111. doi:10.1093/nar/gkh023
7. Tricoli JV, Jacobson JW. MicroRNA: potential for cancer detection, diagnosis, and prognosis. Cancer Res. 2007;67(10):4553–4556.
8. Miska EA. How microRNAs control cell division, differentiation, and death. Curr Opin Genet Dev. 2005;15:563–568. doi:10.1016/j.gde.2005.08.005
9. Zamore PD. Ribo-gnome: the Big World of Small RNAs. Science. 2005;309:1519–1524. doi:10.1126/science.1111444
10. Lu J, Getz G, Miska EA, et al. MicroRNA expression profiles classify human cancers. Nature. 2005;435:
11. Volinia S, Calin GA, Liu C, et al. A microRNA expression signature of human solid tumors defines cancer gene targets. PNAS. 2006;10:2257–2261. doi:10.1073/pnas.0510565103
12. Feber A, Xi L, Luketich JD, et al. MicroRNA expression profiles of esophageal cancer. J Thorac Cardiovasc Surg. 2008;135(2):255–260. doi:10.1016/j.jtcvs.2007.08.055
13. Guo Y, Chen Z, Zhang L, et al. Distinctive MicroRNA profiles relating to patient survival in esophageal squamous cell carcinoma. Cancer Res. 2008;68(1):26–33. doi:10.1158/0008-5472.CAN-06-4418
14. Chen X, Xie D, Zhao Q, You ZH. MicroRNAs and complex diseases: from experimental results to computational models. Brief Bioinform. 2019;20(2):515–539. doi:10.1093/bib/bbx130
15. Soest EMV, Dieleman JP, Siersema PD, Sturkenboom MCJM, Kuipers EJ. Increasing incidence of Barrett’s esophagus in the general population. Gut. 2005;54:1062–1066. doi:10.1136/gut.2004.063685
16. Chen X, Yang CS. Esophageal adenocarcinoma: a review and perspectives on the mechanism of carcinogenesis and chemoprevention Esophageal adenocarcinoma: a review and perspectives on the mechanism of carcinogenesis and chemoprevention. Carcinogenesis. 2001;22(September):1119–1129. doi:10.1093/carcin/22.8.1119
17. Esquela-Kerscher A, Slack FJ. Oncomirs — microRNAs with a role in cancer. Nat Rev. 2006;6(April):259–269. doi:10.1038/nrc1840
18. Hu Y, Correa AM, Hoque A, et al. Prognostic significance of differentially expressed miRNAs in esophageal cancer. Int J Cancer. 2011;143:132–143. doi:10.1002/ijc.25330
19. Li Y, Ii TGV, Wang Z, et al. miR-146a suppresses invasion of pancreatic cancer cells. Cancer Res. 2010;70(Dim):1486–1496. doi:10.1158/0008-5472.CAN-09-2792
20. Chen G, Umelo IA, Lv S, et al. miR-146a inhibits cell growth, cell migration and induces apoptosis in non-small cell lung cancer cells. PLoS One. 2013;8(3):1–13.
21. Yao Q, Cao Z, Tu C, Zhao Y, Liu H, Zhang S. MicroRNA-146a acts as a metastasis suppressor in gastric cancer by targeting WASF2. Cancer Lett. 2013;335(1):219–224. doi:10.1016/j.canlet.2013.02.031
22. Kumaraswamy E, Wendt KL, Augustine LA, et al. BRCA1 regulation of epidermal growth factor receptor (EGFR) expression in human breast cancer cells involves microRNA-146a and is critical for its tumor suppressor function. Oncogene. 2014;34(33):1–14.
23. Du J, Zhang LIN. Analysis of salivary microRNA expression profiles and identification of novel biomarkers in esophageal cancer. Oncol Lett. 2017;14(1):1387–1394. doi:10.3892/ol.2017.6328
24. Wang C, Zhang W, Zhang L, et al. miR-146a-5p mediates epithelial-mesenchymal transition of oesophageal squamous cell carcinoma via targeting Notch2. Br J Cancer. 2016;115(12):1548–1554. doi:10.1038/bjc.2016.367
25. Thomson JM, Newman M, Parker JS, Morin-Kensicki EM, Wright T, Hammond SM. Extensive post-transcriptional regulation of microRNAs and its implications for cancer. Genes Dev. 2006;20(16):2202–2207. doi:10.1101/gad.1444406
26. Taganov KD, Boldin MP, Chang K, Baltimore D. An inhibitor targeted to signaling proteins of innate immune responses. PNAS. 2006;103:12481–12486. doi:10.1073/pnas.0605298103
27. Cornett AL, Lutz CS, Gene C. Regulation of COX-2 expression by miR-146a in lung cancer cells. RNA. 2014;20:1419–1430.
28. Moor AE, Young L, Pharmaceuticals S, Dixon DA. A common single-nucleotide polymorphism in cyclooxygenase-2 disrupts microRNA-mediated regulation. Oncogene. 2012;31(12):1592–1598. doi:10.1038/onc.2011.349
29. Guan Y, Chen L, Bao Y, et al. High miR-196a and low miR-367 cooperatively correlate with unfavorable prognosis of high-grade glioma. Int J Clin Exp Pathol. 2015;8(6):6576–6588.
30. Schmittgen TD, Livak KJ. Analyzing real-time PCR data by the comparative C T method. Nat Protoc. 2008;3(6):1101–1108. doi:10.1038/nprot.2008.73
31. Sommerfelt RM, Feuerherm AJ, Skuland T, Johansen B. Cytosolic phospholipase A2 modulates TLR2 signaling in synoviocytes. PLoS One. 2015;10:1–17.
32. Sheshpoli MS, Khajeniazie S, Khoshnia M, Behnampour N, Saeedi M. The association between functional polymorphisms of COX-2 and serum PGE2 level in ESCC patients in North of Iran. J Mol Biol Res. 2019;9(1):133–141.
33. Winther M, Elsner J, Tramm T, Baeksgaard L, Holtved E. Evaluation of miR-21 and miR-375 as prognostic biomarkers in esophageal cancer Evaluation of miR-21 and miR-375 as prognostic biomarkers. Acta Oncol. 2015;54:1582–1591.
34. Mathé EA, Nguyen GH, Bowman ED, et al. MicroRNA expression in squamous cell carcinoma and adenocarcinoma of the esophagus: associations with survival. Clin Cancer Res. 2009;15(19):6192–6200. doi:10.1158/1078-0432.CCR-09-1467
35. Nozoe T, Ezaki T, Kabashima A, et al. Significance of immunohistochemical expression of cyclooxygenase-2 in squamous cell carcinoma of the esophagus. American Journal of Surgery. 2005;189:110–115. doi:10.1016/j.amjsurg.2004.03.019
36. Chen X, Wang L, Qu J, Guan NN, Li JQ. Predicting miRNA-disease association based on inductive matrix completion. Bioinformatics. 2018;34(24):4256–4265. doi:10.1093/bioinformatics/bty503
37. Chen X, Yin J, Qu J, Huang L. MDHGI: matrix decomposition and heterogeneous graph inference for miRNA-disease association prediction. PLoS Comput Biol. 2018;14(8):1–24. doi:10.1371/journal.pcbi.1006418
38. Chen X, Zhu -C-C, Yin J. Ensemble of decision tree reveals potential miRNA-disease associations. PLoS Comput Biol. 2019;15(7):e1007209. doi:10.1371/journal.pcbi.1007209
 © 2020 The Author(s). This work is published and licensed by Dove Medical Press Limited. The
full terms of this license are available at https://www.dovepress.com/terms
and incorporate the Creative Commons Attribution
- Non Commercial (unported, 3.0) License.
By accessing the work you hereby accept the Terms. Non-commercial uses of the work are permitted
without any further permission from Dove Medical Press Limited, provided the work is properly
attributed. For permission for commercial use of this work, please see paragraphs 4.2 and 5 of our Terms.
© 2020 The Author(s). This work is published and licensed by Dove Medical Press Limited. The
full terms of this license are available at https://www.dovepress.com/terms
and incorporate the Creative Commons Attribution
- Non Commercial (unported, 3.0) License.
By accessing the work you hereby accept the Terms. Non-commercial uses of the work are permitted
without any further permission from Dove Medical Press Limited, provided the work is properly
attributed. For permission for commercial use of this work, please see paragraphs 4.2 and 5 of our Terms.