Back to Journals » Clinical Ophthalmology » Volume 15
MicroPulse® Transscleral Laser Therapy – Fluence May Explain Variability in Clinical Outcomes: A Literature Review and Analysis
Authors Grippo TM ![]() , Sanchez FG
, Sanchez FG ![]() , Stauffer J, Marcellino G
, Stauffer J, Marcellino G
Received 8 April 2021
Accepted for publication 20 May 2021
Published 9 June 2021 Volume 2021:15 Pages 2411—2419
DOI https://doi.org/10.2147/OPTH.S313875
Checked for plagiarism Yes
Review by Single anonymous peer review
Peer reviewer comments 2
Editor who approved publication: Dr Scott Fraser
Tomas M Grippo,1,2 Facundo G Sanchez,1,3 Joan Stauffer,4 George Marcellino4
1Department of Glaucoma, Grippo Glaucoma & Cataract Center, Buenos Aires, Argentina; 2Department of Ophthalmology, Hospital Alemán, Buenos Aires, Argentina; 3Glaucoma Research, Legacy Devers Eye Institute, Portland, OR, USA; 4Glaucoma, Iridex Corp., Mountain View, CA, USA
Correspondence: Tomas M Grippo
Department of Glaucoma, Grippo Glaucoma & Cataract Center, Av. Luis Maria Campos 250, 1st Floor, Suite O, Buenos Aires, Argentina
Tel +54 11 4774-9004
Email [email protected]
Abstract: Since the first peer-reviewed publication on MicroPulse® Transscleral Laser Therapy (MP-TLT) in 2010, authors worldwide have used a wide range of treatment parameter combinations with varying clinical efficacy in terms of the magnitude of intraocular pressure reduction, success rate, durability, and safety profile. This has made it difficult to determine the proper parameters necessary to optimize efficacy and safety, and has made comparison of results from one investigation to another difficult. The first goal of this paper is to explain and highlight the impact of the choices of exposure time and the number of sweeps per hemisphere in terms of “sweep velocity” on energy delivery to the eye. These treatment parameters are underreported in the literature. The second goal is to introduce fluence as a “dose” metric, that combines all the treatment parameters and constants into a single number. Fluence may be a better light-dose metric and a more reliable indicator of clinical outcomes compared to total energy.
Keywords: micropulse, glaucoma, fluence, total energy, sweep velocity
Introduction
MicroPulse® Transscleral Laser Therapy (MP-TLT) is a procedure that uses repetitive pulses of 810nm light generated by the Cyclo G6® Laser (Iridex Corporation, Mountain View, CA, USA) to treat a wide range of glaucoma types and severity.1 The energy is delivered to the target tissue by means of a 700-micron fiberoptic handheld device (MicroPulse P3 Device, Iridex Corporation, Mountain View, CA, USA). Recently, a revised probe with a no-ball tip and a 600-micron fiber diameter was introduced (Rev 2); however, for this study, only the original handpiece device was used. Surgeons worldwide have used a wide range of treatment parameter combinations with varying clinical efficacy in terms of the magnitude of intraocular pressure (IOP) reduction, success rate, durability, and safety profile.2–14 This has created difficulty in selecting the proper parameter sets necessary to optimize efficacy and safety, and difficulty in comparing results from one investigation to another.
In 2018, Sanchez et al15 reported that different total treatment times, and therefore total energy, while maintaining power and duty cycle constant could significantly affect outcomes. Subsequently, in 2018, Sanchez et al16 proposed an evidence-based hypothesis that favored mid-range total energy levels per eye of approximately 112 to 150 Joules to achieve an IOP reduction of around 30% with a good safety profile. The results of the analysis helped practitioners to better understand the importance of limiting the power range and exposure time settings to allow for overall improved efficacy, more consistent clinical outcomes, and an improved safety profile in day-to-day clinical practice. Nevertheless, it is still difficult to identify a clear relationship between outcomes and the parameters reported in the current literature. Similar IOP reductions may be obtained with very different sets of parameters. For example, Lee et al,2 Zaarour et al,9 and Sarrafpour et al6 in their 20/70 visual acuity (VA) or better subcohort, obtained similar mean IOP reductions of 30.1 to 33.2% by using equal power and duty cycle but used very different total treatment times of 160, 90 and 50 seconds per hemisphere, respectively. While important, average power and exposure time appear to be insufficient to predict clinical outcomes.
The manual scanning delivery with the MicroPulse P3 fiber-optic handheld device is defined by two parameters: the exposure time per hemisphere and the number of “sweeps.” These parameters determine the velocity of each sweep and hence the rate of energy deposition the clinician delivers to the tissue as the footplate is swept across the conjunctival surface. These essential treatment variables have been underappreciated and therefore not routinely reported in the literature. Variation in sweep velocity is analogous to moving one’s finger across a burning candle. If moved quickly, virtually no heat is felt, but if moved slowly, the perception of heat increases rapidly. Variability in fluence due to inconsistency in sweep velocity may explain the differences in clinical outcomes (see Appendix for definitions).
It is hypothesized that differences in sweep velocity and fluence explain the variability in clinical outcomes better than total energy. To support this hypothesis, an analysis of the available literature on MP-TLT was conducted by evaluating the treatment parameters reported and using these values to calculate fluence and total energy and comparing them with IOP reduction.
Methods
Literature Search
A bibliographic search was performed using PubMed, covering publications between January 2010 and July 2020; language filters were not applied. Search terms included “MicroPulse and cyclophotocoagulation” which yielded 55 citations; and “MicroPulse and transscleral” which yielded 52 citations. After eliminating duplicate citations, histological studies, meta-analysis reports, summary updates, case reports, letters to the editors, veterinarian-related studies, and articles unrelated to the procedure, a total of 30 publications remained. These 30 publications were reviewed for the following inclusion criteria: MP-TLT description of well-defined treatment parameters including power, exposure time, and number of sweeps per procedure. When a treatment parameter was reported as a small range, we averaged it and included it into our analysis as described below. Studies were excluded with patient follow-up of less than 6 months or insufficient parameter description. Whenever possible, data was gathered for the 12-month follow-up period, regardless of whether longer follow-up data were available.
Number of Sweeps
The number of sweeps performed per hemisphere as reported in the publications were included in the analysis. If the number of sweeps was not documented but the other parameters matched our inclusion criteria, a contributing author was contacted for that information. When a range of sweeps was reported, and the difference was not more than 2 sweeps, an average was calculated. For example, if a range of 4 to 6 sweeps was stated, then 5 sweeps was used as the parameter value.
Total Exposure Time
When a range of total exposure time was reported, and the range did not exceed 10 seconds, an average was calculated. For example, if a range of 80 to 90 seconds per hemifield was reported, a total treatment time of 85 seconds per hemisphere was used as the parameter value.
IOP Reduction
Most authors reported the mean percent IOP reduction while one author reported it as a median value.4 In cases where percent IOP reduction was not stated [Tekeli et al13 and Lee et al2], it was calculated based on the data described in the publication. The overall mean IOP at follow-up was subtracted from the baseline mean and divided by the baseline mean to obtain the percent IOP reduction.
MP-TLT Procedure
MP-TLT is a procedure that utilizes repetitive pulses of 810nm light (near infrared) generated by the Cyclo G6® Laser (Iridex Corporation, Mountain View, CA, USA) to treat a wide range of glaucoma types and severity. The energy is delivered to the target tissue by means of a 700-µm diameter fiberoptic handheld device (MicroPulse P3 Device, Iridex Corporation, Mountain View, CA, USA). Each pulse is “on” for 0.5ms and “off” for 1.1ms, constituting a period of 1.6ms. Therefore, the laser “on” time is 31.3% (duty cycle) and the off period is sufficiently long to allow cooling between pulses. The repetition rate is the inverse of the pulse period or 625Hz. With this pulse structure, once light is absorbed, diffusion of heat is governed by the thermal properties of the target tissue. Based on thermal relaxation, the MicroPulse pulse structure helps to regulate the rate and magnitude of temperature rise at the target tissue and minimizes the likelihood of overheating and subsequent collateral tissue damage. Clinical and experimental studies demonstrate that repetitive pulsing explains the lower incidence of complications and collateral damage compared to traditional, continuous-wave transscleral cyclophotocoagulation.17,18
For treatment purposes, the MicroPulse P3 fiberoptic handpiece is placed perpendicular to the sclera and aligned to the limbus, delivering the treatment with a manual sweeping motion to the superior hemisphere from the 9:30 to 2:30 positions and the inferior hemisphere from the 3:30 to 8:30 positions (Figure A1). The 3- and 9-o’clock meridians are avoided. The 700-µm fiberoptic is positioned 3.8mm posterior to the limbal margin corresponding to the pars plana. A transparent viscous coupling agent, eg, goniosol, is applied for efficient light coupling to the tissue.
Fluence as a Metric of the Light Dose for MP-TLT: Theoretical Background and Fluence Calculation Formula
Fluence may be an effective means of combining all the laser parameters of spot size and scanning rate into a single number expressed as (Joule/cm2). Fluence is the product of the power level and length of time (duration) that light is applied to the tissue divided by the area of the spot whether the beam is stationary or scanned across the target. Fluence at the scleral surface is calculated by the Power in Watts (W) x duty cycle (0.313) x dwell time/Area (see Table 1 for standard parameters set). The “dwell time” is the equivalent stationary pulse duration during which equal energy is deposited per unit area per unit time. It is based on the velocity in which the probe is swept over an arc length of the limbus, or “sweep velocity.” The area of a 700-µm spot diameter is approximately 0.0038cm2. Although this manuscript discusses data on the first-generation probe, if fluence had to be calculated for the second generation (Rev 2) probe, then the spot diameter needs to be replaced with 600-µm, equivalent to an area of 0.0028 cm2.
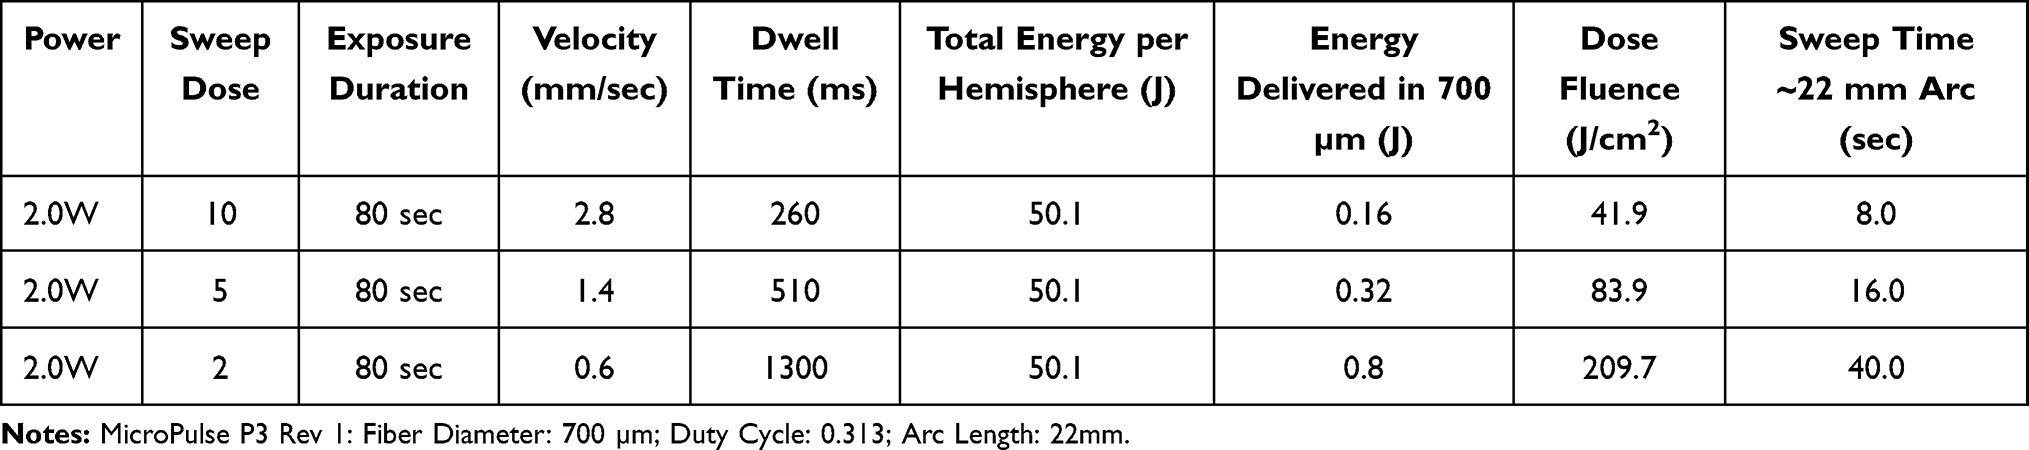 |
Table 1 Representative Parameter Sets per Hemisphere |
The degree of tissue response is directly proportional to average power and pulse duration and inversely proportional to the area over which this energy is deposited. The parameters of power, duration, and area in combination serve as a “dose” of light. The absorption of light energy by chromophores distributed within the tissue, eg, melanin or hemoglobin, determines the tissue’s thermal response. The thermal response includes the rate and duration of temperature rise and subsequent thermal diffusion and conduction as well as the thermal relaxation properties and volume of the target tissue.
Scanning delivery of laser-generated light, either by hand with a fiberoptic handpiece or mechanical delivery device, has been widely applicable across medical and surgical specialties, including ophthalmology, for decades. Scanning is an efficient means of treating a large area of tissue. However, hand-held methods suffer from the difficulty of maintaining a constant scanning rate and therefore tight control of the laser light dose.
Continuous scanning, as opposed to stationary (or discrete-spot delivery), presents a challenge for determining which metric may be best suited as a dose of light. When the scanning is continuous and performed by hand, the dose of light depends on the interaction of all the parameters under the surgeon’s control, especially sweep velocity. Specifically, for MP-TLT, average power, treatment duration, area of the spot in direct contact with the scleral surface, and scanning or “sweep” rate all interact together as the treatment “dose” (see Appendix for sample calculation, definition of the variables, and graphical representation of the impact of sweep velocity on fluence (Figure A2)).
Descriptive Analysis
Fluence was calculated for each cohort based on study parameters obtained from published literature. Descriptive statistics were used to analyze the fluence and total energy applied to each cohort related to IOP reduction. To facilitate the description, we first determined the median fluence among the cohorts and used this value to separate the cohorts into two groups: Group A represents “equal or lower than the median fluence” levels, and Group B represents “above the median fluence” levels. Boxplots were created to compare fluence and total energy levels with IOP reduction by separating the cohorts into these two groups. All the statistical analyses were performed using R software (version 3.3.3, R Core Team, Vienna, 2013).
Results
Only four of thirty (13.3%) of the cited investigations described all the parameters including the number of sweeps necessary for fluence calculation,4,6,8,12 yet personal communication with the authors allowed for inclusion of 6 more papers.2,7,9,10,13,14 This yielded a total of 15 cohorts (656 eyes) to be analyzed (some of the studies included more than one cohort) (Table 2). Two out of the 15 cohorts included a 10-second difference in total exposure time per hemisphere.10,14
 |
Table 2 Dose/Treatment Parameter Settings, IOP Outcomes and Calculations |
Fluence and Total Energy versus Percentage IOP Reduction
Overall, fluence varied from 52.4 J/cm2 to 69.2 J/cm2, with a mean of 55.6 J/cm2 (SD 5.7). Median fluence per hemisphere among cohorts was 52.4 J/cm2 which was used later to separate the cohorts for analysis. Total energy showed a wider range from 31.3 J/hemisphere to 100.2 J/hemisphere (mean 56.0 J, SD 21.5). Laser power varied in a small range (2–2.5 W). From the cohorts with fluence above the median, 3 cohorts increased the fluence by increasing the power (Sarrafpour6 cohorts of 20/80-400 vision, HM/CF, and LP-NLP vision), while 1 cohort increased the fluence by using a slower sweep velocity. Substantial changes in the number of sweeps with a range of 5–16 (mean 8.6, SD 3.5) and treatment duration with a range of 50–160s per hemisphere (mean 86.7s, SD 35.3) were identified. The percentage of IOP reduction varied greatly from 27.8% to 57.2% (mean 40.6%, SD 9.5).
Figure 1A shows the IOP reduction (%) reported in each study against fluence (J/cm2). IOP reduction co-varies with fluence. Descriptive analysis showed that the IOP reduction percentages increased progressively and plateaued at approximately 50% after 52J/cm2. Figure 1B shows IOP reduction (%) against total energy (J) with no apparent trend.
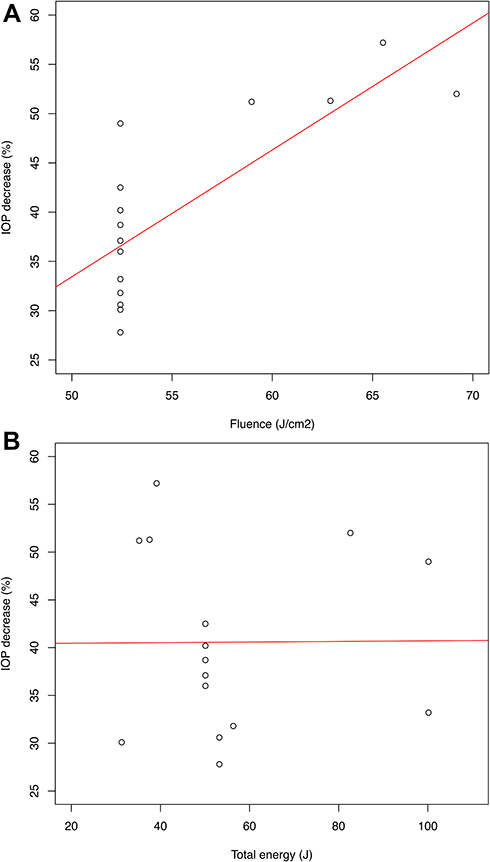 |
Figure 1 (A) IOP reduction (%) versus Fluence (J/cm2). There is a positive trend between these variables. (B) IOP reduction (%) versus Total energy (J). No apparent trend exists between the variables. |
Figure 2A and Table 3 are the boxplots for IOP reduction and the summary table for the fluence Groups A and B, respectively. There was no overlap in IOP reduction between the groups, and Group B had a higher IOP decrease, suggesting a substantial impact of increased fluence on IOP reduction. Figure 2B shows the boxplot for the distribution of total energy within the fluence groups. Total energy overlapped between Group A and B, suggesting that this variable may have less impact on IOP outcomes compared to fluence. The high fluence group showed the largest IOP reduction, but with similar total energy than the low fluence group. Figure 2C shows no difference in baseline IOP between the groups.
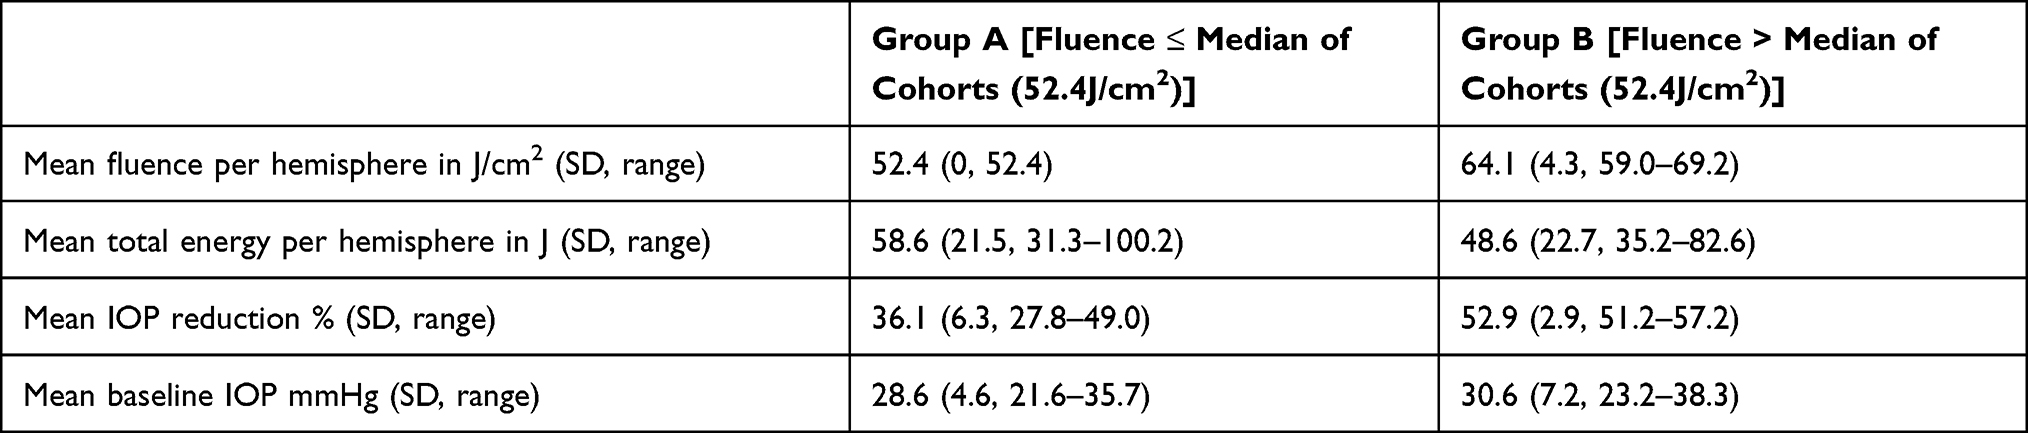 |
Table 3 Comparison of Fluence Groups |
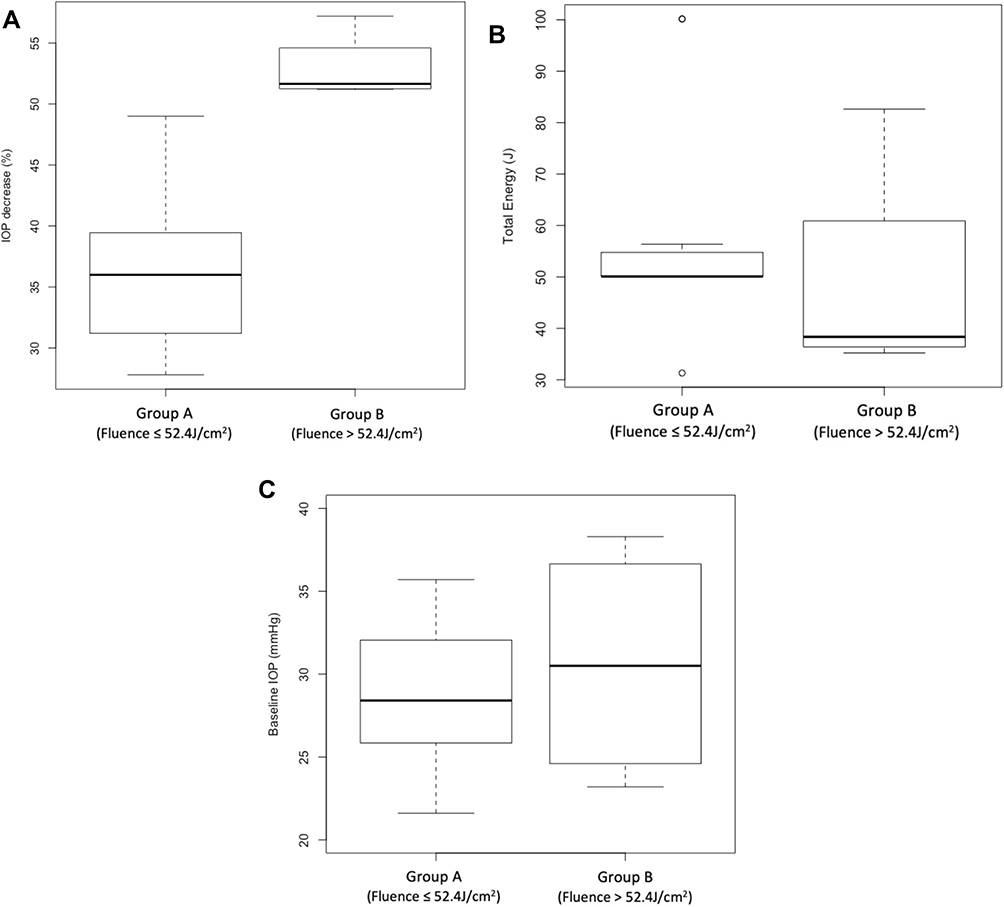 |
Figure 2 (A) Boxplots displaying the distribution of IOP decrease (%) in each cohort from group A (equal or below median fluence), and Group B (above median fluence). No overlap between groups suggests a significant impact of fluence on IOP decrease. (B) Boxplots displaying the distribution of the total energy in each fluence group. Overlap between groups shows how high fluence levels (and possibly higher IOP decrease) can be achieved with relatively equivalent total energy. (C) Boxplots displaying the distribution of baseline IOP in each group. Although baseline IOP is a potential confounder, in the cohort analyzed the distribution of baseline IOP is equivalent between the groups. |
Adverse Events and Complications
It was not possible to analyze data regarding overall complications or to draw any meaningful conclusions on this topic, because of the wide range of differing criteria for adverse events used by the authors.
However, the complication most consistently reported was loss of ≥2 lines of vision. When described by the authors, this ranged between 0% and 21%. A representative example is the work by Varikuti et al,8 who had the highest percentage of cases of a decrease of ≥2 lines of vision. Out of the 49 eyes that were followed for 12 months postoperatively, a total of 10 eyes (20.8%) were found to have lost ≥2 lines of vision, with 4 eyes losing equal to 2 lines of vision and 6 eyes (12.5%) losing >2 lines. Among these 10 eyes, 5 eyes had cataract progression that was addressed with subsequent cataract extraction, one eye had a history of cystoid macular edema (CME) before receiving MP-TLT and developed CME after MP-TLT, and two eyes had unexplainable vision loss, which the authors attributed to likely glaucoma progression. The remaining 2 eyes had a history of iritis and mild postoperative inflammation that resolved at subsequent follow-up visits after study completion.
Discussion
“Sweep velocity” appears to be a key parameter in the calculation of the dose of light energy delivered to the eye for MP-TLT. This variable has a large impact on the rate of energy delivered per unit area and time. For example, in Table 1, a doubling of energy delivered per area (fluence) occurs when selecting 5 sweeps versus 10 sweeps with the same overall exposure time. Despite its relevance, as shown in our analysis, sweep velocity is clearly underreported in the MP-TLT literature, highlighting the fact that its importance on the overall impact on the procedure’s outcome is, at present, not consistently and fully appreciated in clinical practice.
The rate of energy delivered to tissues determines the therapeutic effect and potentially collateral damage related to the treatment. With respect to MP-TLT, the hypothesis is that fluence, which takes into account sweep velocity and treatment area (in contrast to total energy), may be a more representative predictor of clinical outcomes. In our analysis, total energy delivered versus % IOP reduction demonstrated no relationship (Figure 1B). This reflects a lack of consistency in clinical practice when attempting to select the ideal parameters for MP-TLT and difficulty when interpreting the current literature. In our analysis, when fluence was plotted (Figure 1A), a possible relationship between increasing fluence and higher IOP reduction was observed. Moreover, further observation of the data using boxplots to analyze outcomes depending on fluence levels indicates that fluence above the median (Group B) consistently obtained higher IOP reductions of at least 50% from baseline (Figure 2A), even when the total energy between the groups was similar (Figure 2B). This suggests that fluence is a more accurate representation of energy delivered to tissues from a moving source compared to total energy with regard to IOP reduction.
Currently, the general impression is that there are numerous successful combinations of parameters used for MP-TLT. However, many clinicians are delivering similar fluence levels in the range of 52.4 J/cm2 to 69.2 J/cm2 (median = 52.4 J/cm2). Interestingly, the cohorts that used the same fluence (52.4 J/cm2) had IOP reductions that ranged from 28.5% to 49.0% (Figure 1A). Based on this, we infer that even when using similar rates of fluence, other variables such as baseline IOP, number of sweeps, and glaucoma type and severity may also contribute to IOP reduction efficacy.
Review of the MP-TLT literature suggests a clear need for consensus to define and report adverse events and complications. Herein, we outline the difficulties that were encountered, which precluded data analysis. A homogeneous and consistent definition of adverse events was not found among the papers reviewed. In other words, what authors considered a side effect worth reporting and what they monitored differed among papers. For example, Varikuti et al8 described in detail and reported changes in VA or cataract progression even if it did not affect VA, while others like Lee et al2 would only report loss to light perception, if any.
The populations were heterogeneous with regard to baseline VA, glaucoma type, stage, and history of prior glaucoma surgery. The most consistent, yet not systematically studied, complication was the percentage of patients who suffered from an overall decrease in vision of 2 lines or more. Yet this potential outcome was affected by the heterogeneity of the data precluding any statistical analysis or comparison. An attempt was made to evaluate overall incidence of adverse events and complications throughout the follow-up period. However, incidence of complications may vary over time, be they temporary or permanent, and this was not clearly described in the publications, further precluding any meaningful analysis. Regarding adverse events and complications, because the parameter sets analyzed were within the safe range of total energy as proposed by Sanchez et al,16 MP-TLT was well tolerated, making the detection of differences in side effects between studies difficult.
Limitations
Patient inclusion criteria varied greatly among the studies analyzed. It is well known that baseline IOP is a factor in predicting the reduction in IOP from a particular intervention.19,20 Different glaucoma types and severities are also known to respond differently to laser treatment. Therefore, the data represents a collection of diverse populations which clouds the predictability for a given individual patient. Inconsistency in the criteria used among authors regarding adverse events prevented reasonable analysis.
The retrospective nature of this analysis as well as the limited number of peer-reviewed publications and lack of standardized reporting criteria are limitations to this investigation. For the fluence calculation, it is assumed that the entire 22mm arc is treated which may not always be the case. Sometimes a sweep is interrupted because of positioning or movement of the eye during the procedure, anatomical exposure, avoidance of areas of scleral thinning, or prior glaucoma surgery.9,11 Although this may have a small impact on energy delivered, it is unlikely to affect the conclusions.
In four out of 15 cohorts, the percentage of IOP reduction was calculated manually from the mean IOP presented in the manuscripts. In the only case where there was loss to follow-up, the mean percentage IOP reduction may not be exact and may have had a minor impact on the analysis.
Anatomical variability in the location of target tissues is a potential variable that could affect how much energy is absorbed by the target tissues. In the articles analyzed, there was no specific clarification whether the surgeons performed any attempts to deal with individual anatomic variability within the cohorts studied. Sometimes performing ultrasound biomicroscopy (UBM) preoperatively to take measurements, or doing transillumination prior to performing the surgery may help with the identification of target structures; however, this is not done routinely.
Some authors performed up to three retreatment sessions on their cohorts. We were unable to determine the impact of retreatment on outcomes due to the small sample size. Future studies should determine the safety and efficacy of retreatment with MP-TLT.
Authors did not describe laser calibration prior to, or after the investigation, therefore it is assumed that power level calibration was not performed. Since the accepted average power output tolerance for CW laser photocoagulators is ± 20%,21 this variation may have affected clinical outcomes because the tolerance range represents a 40% dose range. It is recommended to perform laser calibration before and after each investigation.
Conclusion
Fluence has a greater impact on IOP reduction than total energy. Using fluence as a dose metric for MP-TLT, which includes sweep velocity and area, has the benefit of simplifying the treatment parameter set to a single number. Calculating fluence when planning and performing MP-TLT may result in more precise dosages. With this level of precision, variability in outcomes may decrease.
Clear appreciation of the importance of sweep velocity, fluence and, appropriate documentation of adverse events and complications may facilitate more accurate comparisons and analyses of clinical results.
Future investigations will explore standardizing and optimizing the dose as more clinical evidence becomes available. A standardized reporting structure of treatment parameters and techniques should include at least power, exposure duration per sweep in each hemisphere, and the number of sweeps per hemisphere in order to accurately replicate results. The contribution of repetitive sweeps as a factor in the dose/response needs to be systematically evaluated.
Acknowledgment
We gratefully acknowledge the contributions from Richard Snyder, MS, biostatistician; Mahendra Jani, PhD, physicist; Paul TK Chew, FRCOphth; Syril Dorairaj, MD, FACS; Sandra Fernando Sieminski, MD; Mark A Latina, MD; Shan C Lin, MD; and Thomas K Mundorf, MD.
Funding
There is no funding to report.
Disclosure
Dr. Grippo, Consultant IRIDEX Corp. Dr. Sanchez, Consultant IRIDEX Corp. Dr. Marcellino and Joan Stauffer are employees of IRIDEX Corp.
References
1. Tan A, Chockalingam M, Aquino M, Lim Z, See J, Chew P. Micropulse transscleral diode laser cyclophotocoagulation in the treatment of refractory glaucoma. Clin Exp Ophthalmol. 2010;38(3):266–272. doi:10.1111/j.1442-9071.2010.02238.x
2. Lee JH, Shi Y, Amoozgar B, et al. Outcome of micropulse laser transscleral cyclophotocoagulation on pediatric versus adult glaucoma patients. J Glaucoma. 2017;26(10):936–939. doi:10.1097/IJG.0000000000000757
3. Sanchez FG, Lerner F, Sampaolesi J, et al. Efficacy and safety of micropulse® transscleral cyclophotocoagulation in glaucoma. Arch Soc Esp Oftalmol. 2018;93(12):573–579. doi:10.1016/j.oftal.2018.08.003
4. Al Habash A, AlAhmadi AS. Outcome of MicroPulse® transscleral photocoagulation in different types of glaucoma. Clin Ophthalmol (Auckland, N Z). 2019;(13):2353–2360. doi:10.2147/OPTH.S226554
5. Nguyen AT, Maslin J, Noecker RJ. Early results of micropulse transscleral cyclophotocoagulation for the treatment of glaucoma. Eur J Ophthalmol. 2019;30:700–705. doi:10.1177/1120672119839303
6. Sarrafpour S, Saleh D, Ayoub S, Radcliffe NM. Micropulse transscleral cyclophotocoagulation: a look at long term effectiveness and outcomes. Ophthalmol Glaucoma. 2019;2167–2171.
7. Souissi S, Baudouin C, Labbe A, Hamard P. Micropulse transscleral cyclophotocoagulation using a standard protocol in patients with refractory glaucoma naive of cyclodestruction. Eur J Ophthalmol. 2019;31:112–119. doi:10.1177/1120672119877586
8. Varikuti VNV, Shah P, Rai O, et al. Outcomes of micropulse transscleral cyclophotocoagulation in eyes with good central vision. J Glaucoma. 2019;28(10):901–905. doi:10.1097/IJG.0000000000001339
9. Zaarour K, Abdelmassih Y, Arej N, Cherfan G, Tomey KF, Khoueir Z. Outcomes of micropulse transscleral cyclophotocoagulation in uncontrolled glaucoma patients. J Glaucoma. 2019;28(3):270–275. doi:10.1097/IJG.0000000000001174
10. de Crom R, Slangen C, Kujovic-Aleksov S, Webers CAB, Berendschot T, Beckers HJM. Micropulse trans-scleral cyclophotocoagulation in patients with glaucoma: 1- and 2-year treatment outcomes. J Glaucoma. 2020;29(9):794–798. doi:10.1097/IJG.0000000000001552
11. Kaba Q, Somani S, Tam E, Yuen D. The effectiveness and safety of micropulse cyclophotocoagulation in the treatment of ocular hypertension and glaucoma. Ophthalmol Glaucoma. 2020;3(3):181–189. doi:10.1016/j.ogla.2020.02.005
12. Magacho L, Lima FE, Avila MP. Double-session micropulse transscleral laser (cyclo G6) for the treatment of glaucoma. Lasers Med Sci. 2020;35(7):1469–1475. doi:10.1007/s10103-019-02922-1
13. Tekeli O, Kose HC. Outcomes of micropulse transscleral cyclophotocoagulation in primary open-angle glaucoma, pseudoexfoliation glaucoma, and secondary glaucoma. Eur J Ophthalmol. 2020;112067212091423. doi:10.1177/1120672120914231
14. Vig N, Ameen S, Bloom P, et al. Micropulse transscleral cyclophotocoagulation: initial results using a reduced energy protocol in refractory glaucoma. Graefes Arch Clin Exp Ophthalmol. 2020;258(5):1073–1079. doi:10.1007/s00417-020-04611-0
15. Sanchez FG, Lerner FS, Sampaolesi J, et al. Success rate of micropulse transscleral cyclophotocoagulation in complex glaucoma based on variable treatment duration. Invest Ophthalmol Vis Sci. 2018;59(9):6107.
16. Sanchez FG, Peirano-Bonomi JC, Grippo TM. Micropulse transscleral cyclophotocoagulation: a hypothesis for the ideal parameters. Med Hypothesis Discov Innov Ophthalmol. 2018;7(3):94–100.
17. Aquino MC, Barton K, Tan AM, et al. Micropulse versus continuous wave transscleral diode cyclophotocoagulation in refractory glaucoma: a randomized exploratory study. Clin Exp Ophthalmol. 2015;43(1):40–46. doi:10.1111/ceo.12360
18. Maslin JS, Chen PP, Sinard J, Nguyen AT, Noecker R. Histopathologic changes in cadaver eyes after MicroPulse and continuous wave transscleral cyclophotocoagulation. Can J Ophthalmol. 2020;55(4):330–335. doi:10.1016/j.jcjo.2020.03.010
19. Hodge WG, Damji KF, Rock W, Buhrmann R, Bovell AM, Pan Y. Baseline IOP predicts selective laser trabeculoplasty success at 1 year post-treatment: results from a randomised clinical trial. Br J Ophthalmol. 2005;89(9):1157–1160. doi:10.1136/bjo.2004.062414
20. Mansberger SL, Hughes BA, Gordon MO, et al. Comparison of initial intraocular pressure response with topical beta-adrenergic antagonists and prostaglandin analogues in African American and white individuals in the ocular hypertension treatment study. Arch Ophthalmol. 2007;125(4):454–459. doi:10.1001/archopht.125.4.454
21. Performance standards for light-emitting products. 21 C.F.R. § 1040.11. 2019.
 © 2021 The Author(s). This work is published and licensed by Dove Medical Press Limited. The
full terms of this license are available at https://www.dovepress.com/terms
and incorporate the Creative Commons Attribution
- Non Commercial (unported, 3.0) License.
By accessing the work you hereby accept the Terms. Non-commercial uses of the work are permitted
without any further permission from Dove Medical Press Limited, provided the work is properly
attributed. For permission for commercial use of this work, please see paragraphs 4.2 and 5 of our Terms.
© 2021 The Author(s). This work is published and licensed by Dove Medical Press Limited. The
full terms of this license are available at https://www.dovepress.com/terms
and incorporate the Creative Commons Attribution
- Non Commercial (unported, 3.0) License.
By accessing the work you hereby accept the Terms. Non-commercial uses of the work are permitted
without any further permission from Dove Medical Press Limited, provided the work is properly
attributed. For permission for commercial use of this work, please see paragraphs 4.2 and 5 of our Terms.