Back to Journals » International Journal of Nanomedicine » Volume 13
Micro-/nano-topography of selective laser melting titanium enhances adhesion and proliferation and regulates adhesion-related gene expressions of human gingival fibroblasts and human gingival epithelial cells
Authors Xu R ![]() , Hu X
, Hu X ![]() , Yu X, Wan S, Wu F
, Yu X, Wan S, Wu F ![]() , Ouyang J, Deng F
, Ouyang J, Deng F ![]()
Received 28 February 2018
Accepted for publication 11 June 2018
Published 4 September 2018 Volume 2018:13 Pages 5045—5057
DOI https://doi.org/10.2147/IJN.S166661
Checked for plagiarism Yes
Review by Single anonymous peer review
Peer reviewer comments 4
Editor who approved publication: Dr Linlin Sun
Ruogu Xu,1,2,* Xiucheng Hu,1,2,* Xiaolin Yu,1,2 Shuangquan Wan,1,2 Fan Wu,1,2 Jianglin Ouyang,3,4 Feilong Deng1,2
1Department of Oral Implantology, Guanghua School of Stomatology, Hospital of Stomatology, Sun Yat-Sen University, Guangzhou, PR China; 2Guangdong Provincial Key Laboratory of Stomatology, Guangzhou, PR China; 3Guangzhou Institute of Advanced Technology, Chinese Academy of Science, Guangzhou, PR China; 4Guangzhou Janus Biotechnology Co., Ltd, Chinese Academy of Sciences, Guangzhou, PR China
*These authors contributed equally to this work
Background: Selective laser melting (SLM) titanium is an ideal option to manufacture customized implants with suitable surface modification to improve its bioactivity. The peri-implant soft tissues form a protective tissue barrier for the underlying osseointegration. Therefore, original microrough SLM surfaces should be treated for favorable attachment of surrounding soft tissues.
Material and methods: In this study, anodic oxidation (AO) was applied on the microrough SLM titanium substrate to form TiO2 nanotube arrays. After that, calcium phosphate (CaP) nanoparticles were embedded into the nanotubes or the interval of nanotubes by electrochemical deposition (AOC). These two samples were compared to untreated (SLM) samples and accepted mechanically polished (MP) SLM titanium samples. Scanning electron microscopy, energy dispersive spectrometry, X-ray diffraction, surface roughness, and water contact angle measurements were used for surface characterization. The primary human gingival epithelial cells (HGECs) and human gingival fibroblasts (HGFs) were cultured for cell assays to determine adhesion, proliferation, and adhesion-related gene expressions.
Results: For HGECs, AOC samples showed significantly higher adhesion, proliferation, and adhesion-related gene expressions than AO and SLM samples (P<0.05) and similar exceptional ability in above aspects to MP samples. At the same time, AOC samples showed the highest adhesion, proliferation, and adhesion-related gene expressions for HGFs (P<0.05).
Conclusion: By comparison between each sample, we could confirm that both anodic oxidation and CaP nanoparticles had improved bioactivity, and their combined utilization may likely be superior to mechanical polishing, which is most commonly used and widely accepted. Our results indicated that creating appropriate micro-/nano-topographies can be an effective method to affect cell behavior and increase the stability of the peri-implant mucosal barrier on SLM titanium surfaces, which contributes to its application in dental and other biomedical implants.
Keywords: additive manufacturing, surface modification, soft tissue barrier, dental implants
Introduction
Titanium implants have been widely used in dentistry for the replacement of missing teeth owing to their predictable clinical performance in the clinic.1 The conventional implants are manufactured in cylindrical or tapered shapes with a predetermined length and diameter to match the requirements of most clinical conditions. However, some complicated and irregular anatomies are unsuitable for conventional implants.2 Customized dental implants are therefore in high demand. Furthermore, customized dental implants can also be used for individual treatment and can shorten treatment time.3 With the development of additive manufacturing (AM), freeform geometries have been produced precisely and individually based on computer-aided design (CAD) data.4–7 AM is convenient for fabricating complex and custom-made structures based on a one-step manufacturing process.8
As the latest type of AM, selective laser melting (SLM) is widely used in biomedical implant fabrication.9 Titanium and its alloys fabricated by SLM show great potential in individualized and customized implant manufacturing due to their biocompatibility and biomechanical properties.10,11 Reports have shown evidence of good bone regeneration in SLM titanium specimens after surface modification in vivo and in vitro.12–14
However, it is well-known that a major reason for implant loss is peri-implantitis, as a consequence of the penetration of bacterial plaque into the peri-implant sulcus.15–18 Therefore, only good bone regeneration is not enough, the barrier function provided by the peri-implant mucosal tissue is equally important. An implant must interface successfully with two types of cells, namely the epithelial cells and the underlying fibroblasts from the soft tissue for a good barrier function.19,20 It has been shown that topographic and physicochemical properties of implant surfaces affect both hard and soft peri-implant tissue responses. There is growing evidence that implant surface characteristics may play a role in the attachment of peri-implant soft tissues.21
According to current knowledge, nano-structured surfaces have been speculated to influence cell behavior in a different way compared to conventionally sized surfaces. One of the most diffused technologies able to create a nano-structured surface is anodic oxidation.22 Reports show that a highly crystalline, thin hydroxyapatite (HA) layer coated on the anodized titanium provides a suitable nano-structure surface for clinical oral implants.23–28 Among these reports, Takebe et al discovered that anodized-hydrothermally treated titanium affects the adhesion and regulates the gene expression of fibroblasts and epithelial cells.24–26 Another report showed that oxidized surfaces enhanced human gingival fibroblast (HGF) adhesion, proliferation, and extracellular matrix deposition, and this could be due to the different structure at micro- and nano-scale levels.27 All aforementioned reports used commercial pure titanium with a flat surface. However, the surface of raw SLM specimens has a certain roughness due to its layer-by-layer manufacturing process.28 Few studies have focused on whether nano-structures on the surface of microscale roughness such as SLM specimens can influence cellular behavior of peri-implant soft tissues.
In this study, we modified the surface of SLM substrate to form nanotube arrays by an anodizing method, and then deposited nanoscale calcium phosphate (CaP) particles, which are the major elements of HA in the anodized nanotubes or the interval of nanotubes, by an electrochemical technique. We analyzed the surface characteristics and intended to evaluate whether micro-/nano-topography of SLM titanium, especially the anodizing method or the nanoscale CaP particles, could affect the response of HGFs and human gingival epithelial cells (HGECs) in terms of adhesion, proliferation, and adhesion-related gene expressions.
Material and methods
Specimen preparation and treatment
Specimens were designed by SolidWorks® 12.0 (SolidWorks Corp, Concord, MA, USA) and manufactured by an SLM machine (SLM125HL, SLM solutions GmbH, Lubeck, Germany). Raw materials were commercial grade II titanium powders (Western BaoDe, Xian, PR China) with an average particle size of 30 μm. The SLM processing parameters were adjusted to a laser power of 145 W, laser scanning velocity of 355 mm/s, hatch space of 45 μm, layer thickness of 30 μm, and laser spot size of 50 μm. Specimens were produced as titanium discs (10×10×1 mm3) (Figure 1).
 | Figure 1 (A) Design sketch of specimens; (B) SLM titanium specimen. |
These SLM titanium specimens were degreased by a cleaning solution (0.05 mol/L Na2SiO3, 0.1 mol/L Na3PO4, and 0.2 mol/L Na2CO3) for 15 minutes and then sonicated in deionized water for 15 minutes. These SLM titanium discs were termed SLM samples and set as the control group.
Some of these specimens were polished mechanically by P80, P220, P400, P600, P800, and P1000 sandpaper in sequence and were termed mechanically polished (MP) samples.
Some other SLM samples were first sandblasted with 250 μm ZrO2 particles to remove residual unmelted titanium spheres, and then chemically polished in a solution of 5% hydrofluoric acid (HF) for 1 minute to remove the native oxide layer before anodization. Thus, the specimens were anodized in an electrolyte consisting of 0.5 wt% HF in deionized water with an applied voltage of 20 V for 45 minutes to create TiO2 nanotube arrays. These were termed AO samples.
Parts of AO samples were then treated by an electrochemical technique in order to embed nanoscale CaP into TiO2 nanotubes or the interval of nanotubes. An electrochemical workstation (CHI-660D, CH Instruments, Austin, TX, USA) was used for electrochemical deposition. The solution consisted of 0.20 mmol/L of Ca(NO3)2 and 0.12 mmol/L of (NH4)2HPO4. AO samples were anchored onto platinum cathodes and subjected to a constant voltage of −3 V for 10 minutes, with the counter-electrode also being platinum. The reaction was carried out in a 50°C water bath and the specimens were termed AOC samples.
Afterward, all treated specimens were thoroughly cleaned ultrasonically in deionized water and autoclave sterilized before cell culture studies. There were four groups termed SLM, MP, AO, and AOC.
Surface characterization
The surface topography and chemistry were analyzed by field-emission scanning electron microscopy ([FE-SEM] S-4800, Hitachi, Tokyo, Japan) and X-ray energy dispersive spectrometry (EDS). The crystalline phases of the specimens were investigated by X-ray diffraction ([XRD] X’Pert-PRO, PANalytical, Almelo, Holland). A 3D surface topography analyzer (BMT EXPERT, Lorsch, Germany) was used to scan the specimens’ surface roughness. Water contact angles were measured by the sessile-drop method on an optical contact angle measuring device (OCA40 Micro, Dataphysics, Stuttgart, Germany).
Preparation and identification of HGFs and HGECs
This study was ethically approved by the Ethical Review Committee, Guanghua School of Stomatology, Hospital of Stomatology, Institute of Stomatological Research, Sun Yat-Sen University (no ERC-2016–36). Written informed consent was provided by patients and then sampling was performed. Samples of gingival tissue were harvested from healthy donors who underwent surgery to extract the lower third molar at the Guanghua School of Stomatology, Hospital of Stomatology, Sun Yat-Sen University. Collected tissues were washed three times in PBS (Gibco, Thermo Fisher Scientific, Waltham, MA, USA) supplemented with antibiotics (100 U/mL penicillin and 100 mg/mL streptomycin; Gibco).
For culturing HGFs, the collected tissues were cut into small pieces (1×1×1 mm3). These pieces were digested in 0.1% type I collagenase (Sigma-Aldrich Co., St Louis, MO, USA) at 37°C for 15 minutes and centrifuged at 1,000 rpm for 5 minutes. After centrifugation, the pieces were harvested, supplemented with complete L-DMEM (Gibco) containing antibiotics and 10% FBS (Gibco), and cultured at 37°C in a 5% CO2 humidified atmosphere. Five days later, the cultured HGFs were collected and fed. The medium was changed every 2 days. Cultures between the fifth and eighth passage were used in the present experiments.
For culturing HGECs, the collected tissues were cut into strips (1×5 mm2) and immersed overnight at 4°C in 0.25% dispase (Sigma-Aldrich Co.). Then, the epithelium was separated with forceps and cut into small pieces (1×1 mm2), which were digested with 0.25% trypsin (Gibco) for 8 minutes at 37°C and centrifuged at 1,000 rpm for 5 minutes. The cells were collected and fed with complete L-DMEM containing antibiotics and 10% FBS. The medium was changed every 2 days. Cultures between the second and fourth passage were used in the present experiments.
An inverted microscope (Axio Observer Z1, Carl Zeiss Meditec AG, Jena, Germany) was used for the morphological identification of cells. An immunofluorescent stain assay was also performed. HGFs and HGECs were respectively seeded onto confocal dishes at a density of 5×10³ cells·mL−1 and cultured for 24 hours. Then, the tissues were fixed in 4% paraformaldehyde (Biosharp, Anhui, PR China) for 10 minutes and 0.2% Triton X-100 (MP Biomedicals, Strasbourg, France) was added for 5 minutes. The cells were then blocked in 4% BSA (Beyotime, Shanghai, PR China) for 1 hour and stained with pan-cytokeratin (PCK) and Vimentin antibodies (1:100, Boster, Wuhan, PR China) overnight. The secondary antibodies were Alexa Fluor488 Goat anti-Mouse lgG (Invitrogen, Thermo Fisher Scientific). The nucleus was stained with DAPI (Beyotime, Shanghai, PR China). Immunofluorescent staining was performed with a confocal laser scanning microscope (LSM780, Carl Zeiss Meditec AG).
Cell proliferation evaluation by CCK-8
HGFs and HGECs were respectively seeded onto specimens in 48-well plates at a density of 1×10⁴ cells·mL−1 and cultured with L-DMEM containing 10% FBS for 1, 3, 5, and 7 days. At the prescribed time points, the specimens were taken out and washed three times with PBS. The specimens were then transferred to new 48-well plates. The cells were assessed using a cell counting kit-8 assay ([CCK-8] Dojindo, Kumamoto, Japan).29 Five hundred microliters of 10% CCK-8 fluid with medium was added to each well, and the cells were incubated for 2 hours. Optical absorbance (OD) of the CCK-8 fluid was then measured at 450 nm.
Cell adhesion and morphology evaluation by SEM
HGFs and HGECs were respectively incubated on the specimen surfaces in 48-well plates at a density of 1×10⁴ cells·mL−1 for 24 hours and fixed in 2.5% glutaraldehyde solution for 12 hours. After dehydration in graded ethanol (ie, 50%, 75%, 90%, 95%, and 100%) and subsequent drying, the specimens were observed under field-emission scanning electron microscope.
ELISA of hEGF protein secreted by HGECs
HGECs were incubated on the specimen surfaces in 48-well plates at a density of 5×10⁴ cells•mL−1 for 7 days. Then, the cells were washed in PBS three times. RIPA Lysis Buffer (Cwbio, Beijing, PR China) was used to collect the hEGF protein as per the manufacturer’s instructions. An ELISA kit (Cloud-clone, Wuhan, PR China) was used for hEGF detection.
ELISA of type I collagen synthesis by HGFs
HGFs were incubated on the specimen surfaces in 48-well plates at a density of 5×10⁴ cells·mL−1 for 7 days. The medium was collected and an ELISA kit (Chondrex, Redmond, WA, USA) was used to detect type I collagen synthesis.
RT-PCR evaluation of gene expression by HGECs and HGFs
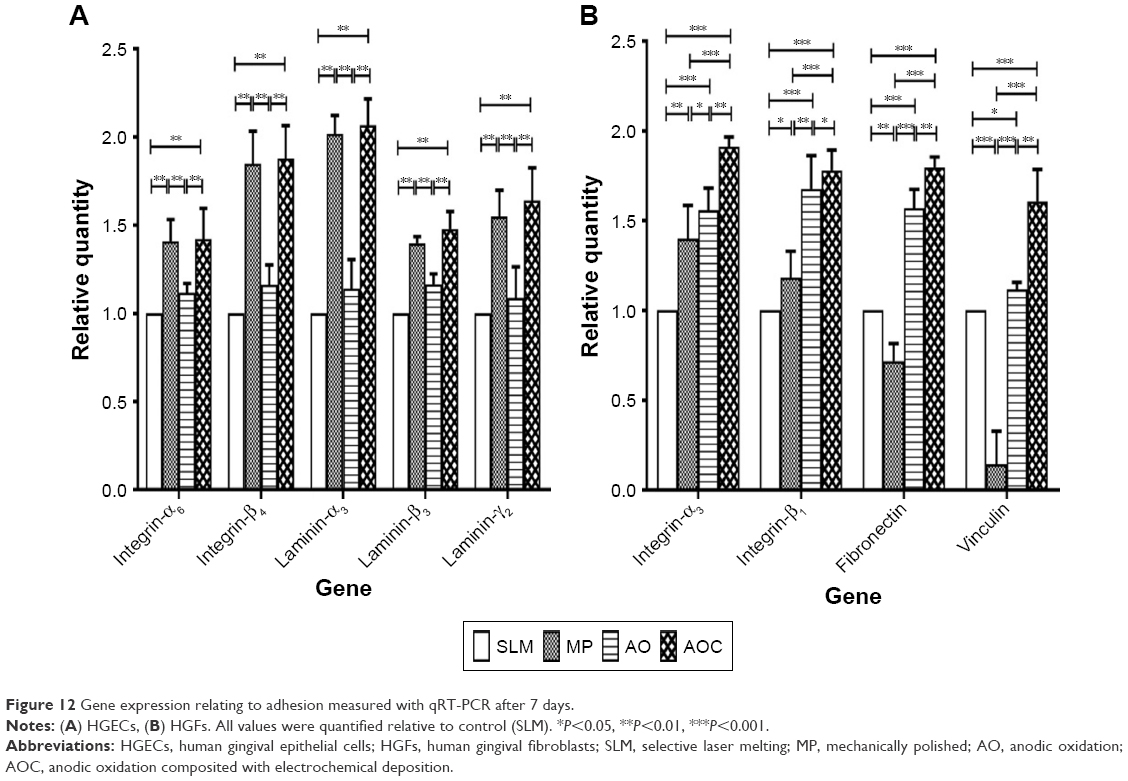
HGECs and HGFs were respectively incubated on the specimen surfaces in 48-well plates at a density of 5×10⁴ cells·mL−1 for 7 days. Then, the total RNA was isolated from the cells using TRIzol reagent (Invitrogen, Thermo Fisher Scientific) based on the single-step method. First-strand cDNA was synthesized from the total RNA using the PrimeScriptRT MasterMix (TaKaRa, Kusatsu, Japan), followed by qRT-PCR carried out on a Light Cycler 480 (Hoffman-La Roche Ltd., Basel, Switzerland) with SYBR Premix Ex Taq II (TaKaRa) and specific oligonucleotide primers. The primers for HGECs were used as the template for PCR with primers specific to integrin-α6, integrin-β4, laminin-α3, laminin-β3, and laminin-γ2; the primers for HGFs were used as the template for PCR with primers specific to integrin-α3, integrin-β1, fibronectin, and vinculin. The mRNA levels for cells were normalized for GAPDH mRNA. The primers used are shown in Table 1.
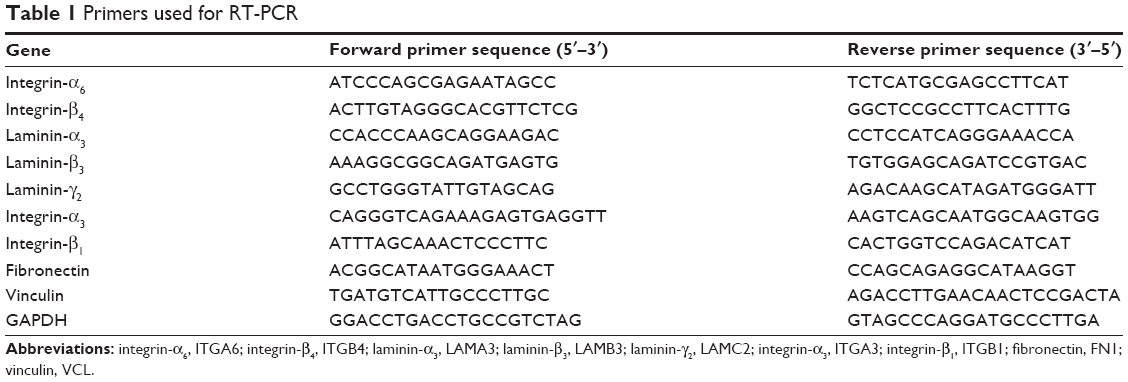 | Table 1 Primers used for RT-PCR |
Statistical analysis
The OD values from CCK-8, concentration of hEGF and type I collagen from ELISA, and relative quantity of adhesion-related genes from RT-PCR were collected as data. All the experiments were performed in triplicate. All data were expressed as the mean ± SD and analyzed using the SPSS 23.0 software package (IBM Corporation, Armonk, NY, USA). The level of significance was determined by one-way ANOVA followed by a Bonferroni post hoc test for multiple comparison procedure. A P-value of <0.05 was considered statistically significant.
Results
Surface characterization
The surface topographies of the four groups are shown in Figure 2. Some residual unmelted titanium particles and spheres were found on the rough waving surfaces of SLM samples. MP samples showed flat surfaces. TiO2 nanotubes measuring approximately 70–90 nm in diameter and 200–250 nm in depth were seen arranged in an orderly manner on the surfaces of AO samples. We observed several amorphous nanoparticles embedded in the nanotubes or the interval of nanotubes on the surfaces of AOC samples.
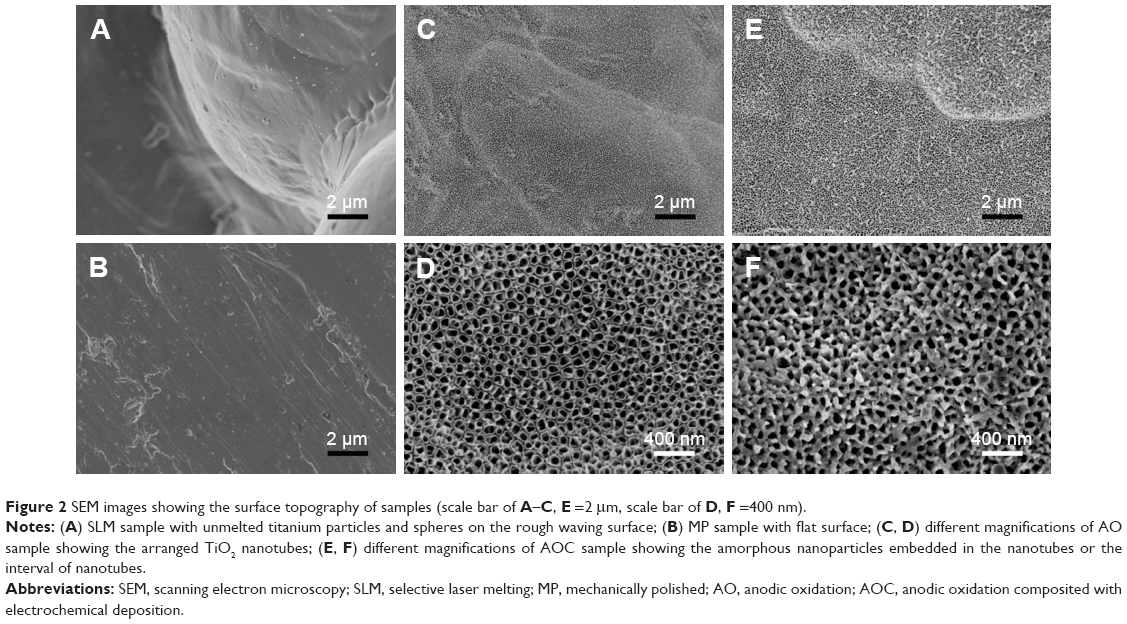 | Figure 2 SEM images showing the surface topography of samples (scale bar of A–C, E =2 μm, scale bar of D, F =400 nm). |
The surface elemental compositions for both surfaces are reported in Table 2, and the EDS spectra of the samples are shown in Figure 3. SLM and MP samples were composited with titanium 100%. There was some oxygen and a little fluorine besides titanium on the surface of AO samples. For AOC samples, there was more oxygen compared to AO samples. We also found calcium and phosphorus considered as the deposition of CaP nanoparticles.
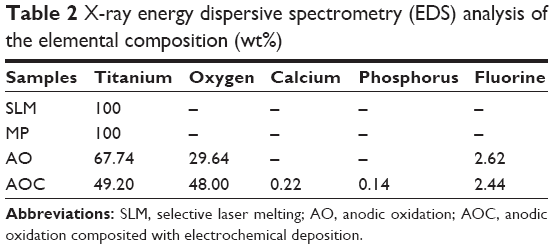 | Table 2 X-ray energy dispersive spectrometry (EDS) analysis of the elemental composition (wt%) |
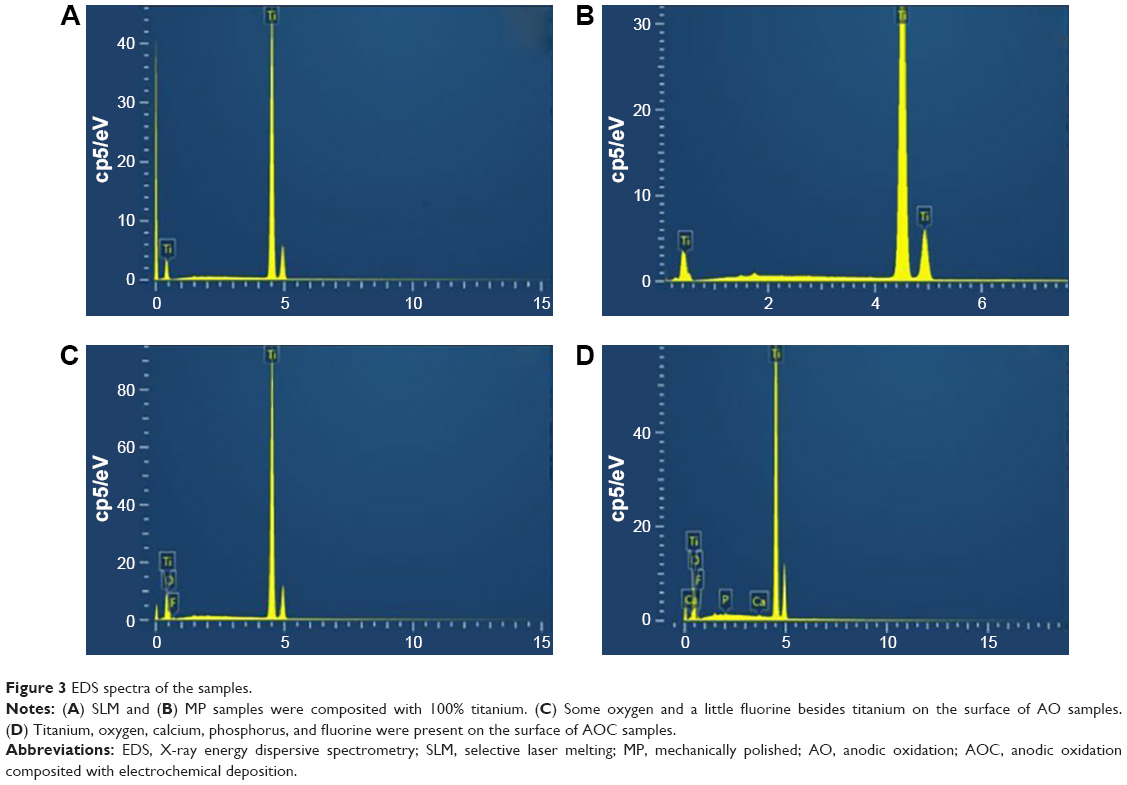 | Figure 3 EDS spectra of the samples. |
The crystalline phases (Figure 4) of the specimens investigated by XRD showed CaP phase with diffraction peaks at around 26°, 32°, and 33° on the surfaces of AOC samples.
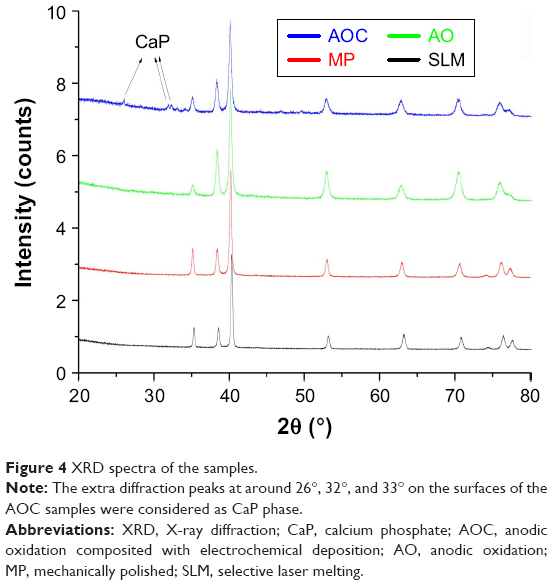 | Figure 4 XRD spectra of the samples. |
The results of surface roughness values (Ra and Rq) are shown in Table 3. SLM, with an Ra value of approximately 7.57 μm, was found to possess a rougher surface than MP, AO, and AOC, with Ra values of approximately 0.39 μm, 2.15 μm, and 2.15 μm, respectively.
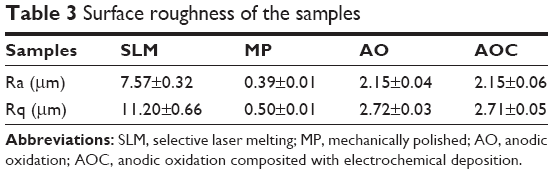 | Table 3 Surface roughness of the samples |
Water contact angles of SLM, MP, and AO samples were 73.9°, 76.3°, and 40.7°, respectively, while AOC samples showed favorable hydrophilia with a relatively lower water contact angle of approximately 18.3° (Figure 5).
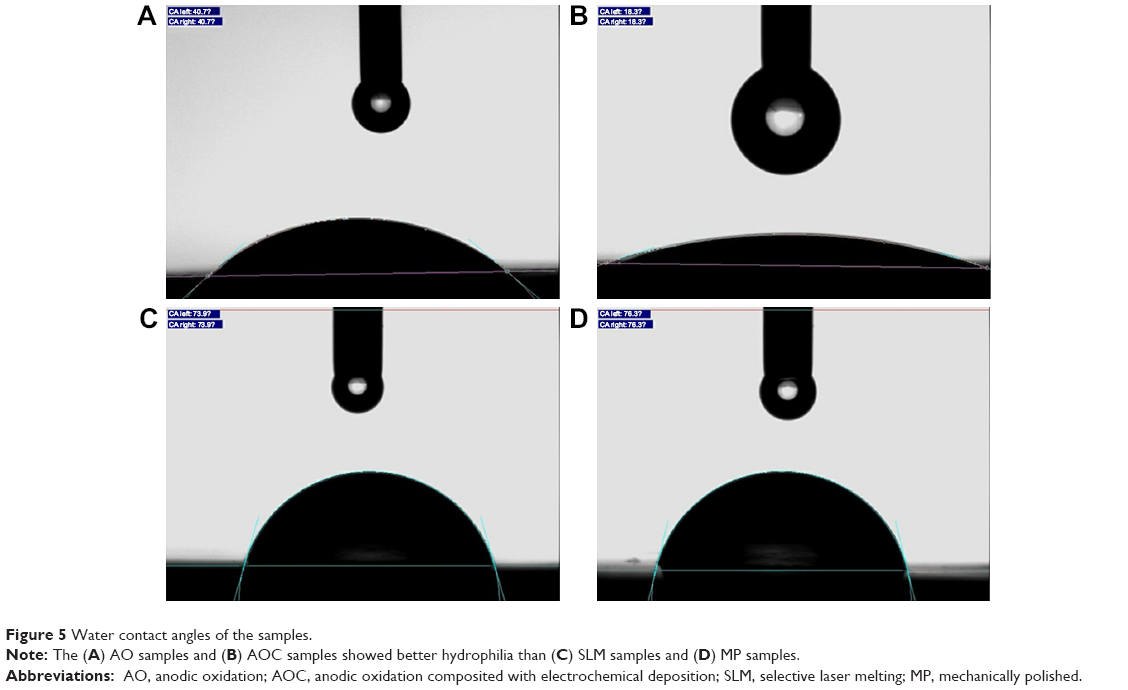 | Figure 5 Water contact angles of the samples. |
Identification of HGFs and HGECs
Morphological observation of HGECs showed a typical “paving stone like” keratinization while HGFs showed a spindle-type shape. The immunofluorescent staining assay of HGECs showed positive expression of PCK and no expression of vimentin. At the same time, the results of HGFs appeared contrary to positive expression of vimentin and showed no expression of PCK (Figure 6).
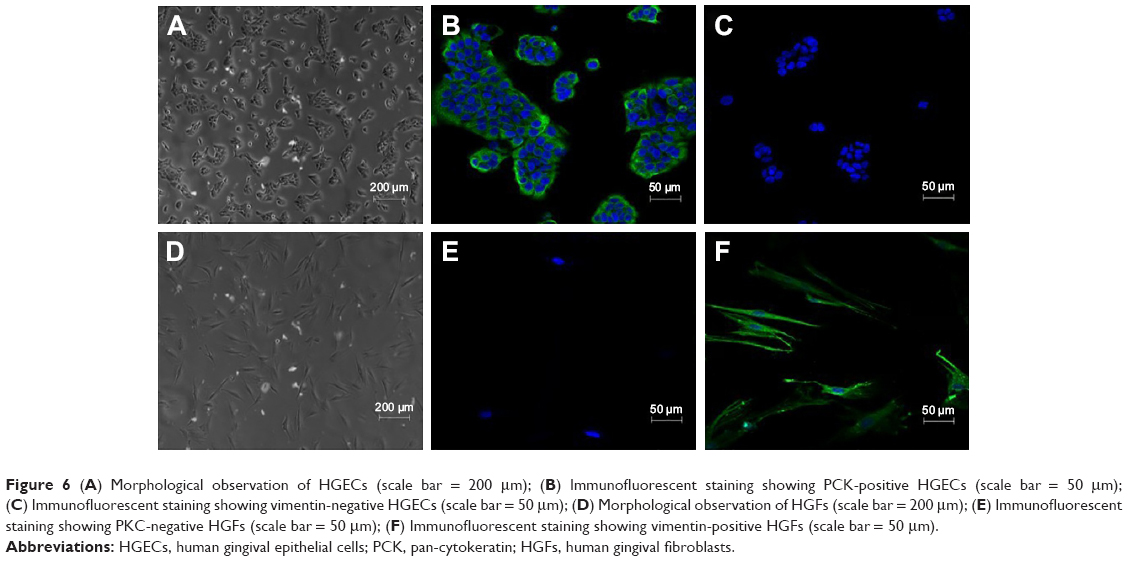 | Figure 6 (A) Morphological observation of HGECs (scale bar = 200 μm); (B) Immunofluorescent staining showing PCK-positive HGECs (scale bar = 50 μm); (C) Immunofluorescent staining showing vimentin-negative HGECs (scale bar = 50 μm); (D) Morphological observation of HGFs (scale bar = 200 μm); (E) Immunofluorescent staining showing PKC-negative HGFs (scale bar = 50 μm); (F) Immunofluorescent staining showing vimentin-positive HGFs (scale bar = 50 μm). |
Cell proliferation evaluation by CCK-8
Figure 7A shows results of the HGECs’ proliferation of each group. On the first, third, fifth, and seventh days, the MP and AOC groups showed more proliferation than the SLM and AO groups (P<0.05). However, there were no significantly higher rates of cell proliferation between SLM and AO groups (P>0.05), nor between MP and AOC groups.
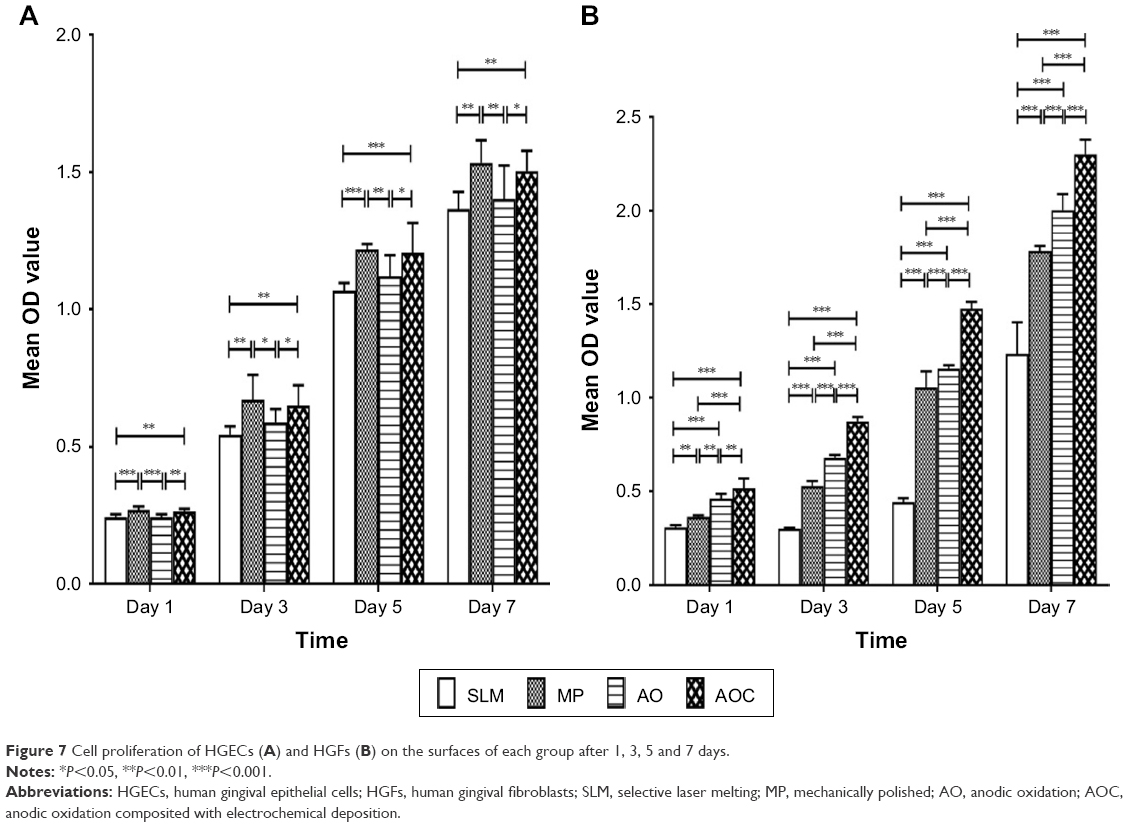 | Figure 7 Cell proliferation of HGECs (A) and HGFs (B) on the surfaces of each group after 1, 3, 5 and 7 days. |
Figure 7B shows the results of the HGFs’ proliferation of each group. The surface-treated MP, AO, and AOC groups showed significantly higher rates of cell proliferation than SLM on the first, third, fifth, and seventh days (P<0.05). Moreover, AO and AOC groups showed more proliferation than MP at each time point (P<0.05), and the AOC group showed the most proliferation (P<0.05).
Cell adhesion and morphology evaluation by SEM
The HGECs converged and showed typical “paving stone like” keratinization in each group (Figure 8). On the surface of MP, the HGECs were flatter and extended in the direction of the polishing lines. Although the HGECs were less stretched on the surface of AO and AOC, we could see multiple contact points with tiny protrusions extending from the lamellipodia and wrapping around the nanotubes.
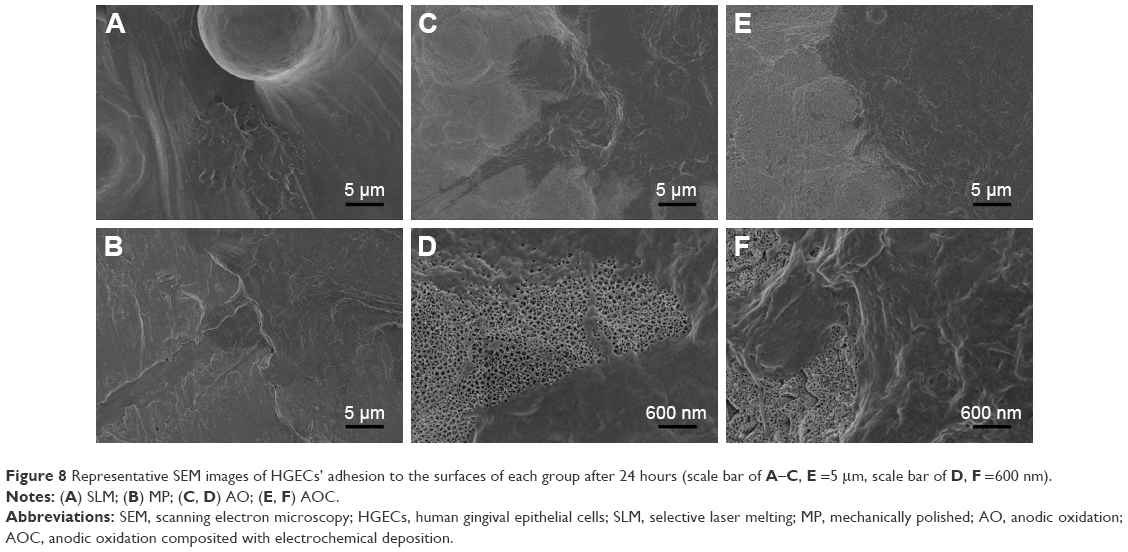 | Figure 8 Representative SEM images of HGECs’ adhesion to the surfaces of each group after 24 hours (scale bar of A–C, E =5 μm, scale bar of D, F =600 nm). |
The HGFs converged as platy on each group (Figure 9). The HGFs were not only more stretched but also showed extended lamellipodia anchored to the surface of AO and AOC.
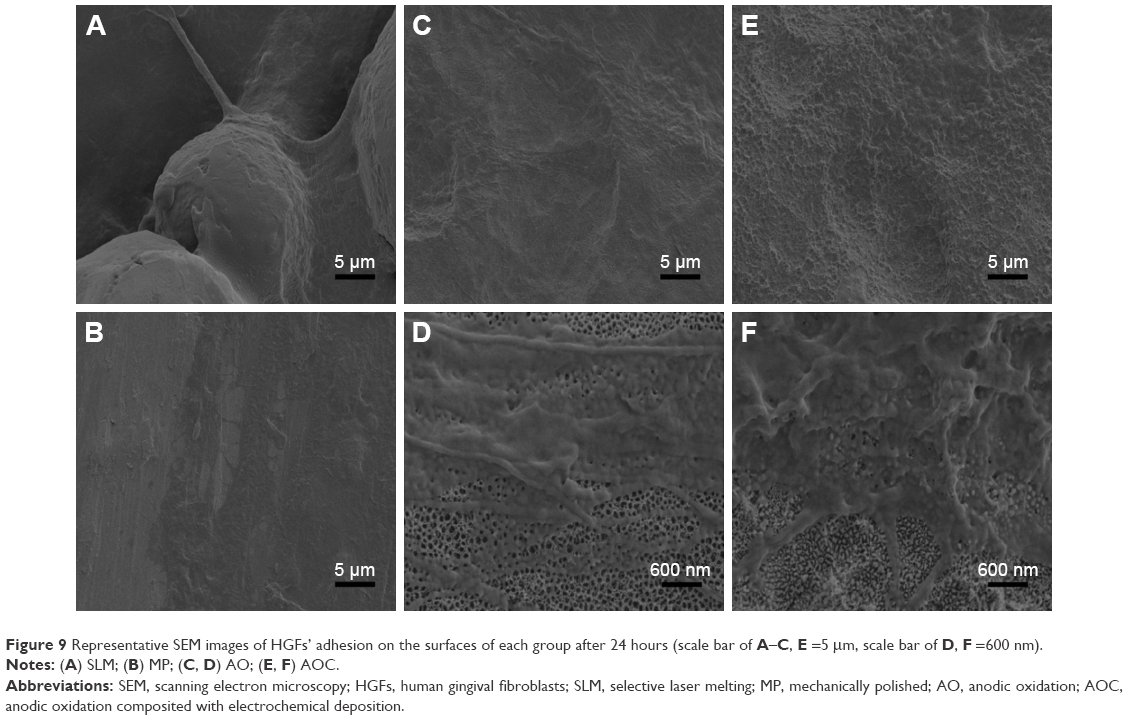 | Figure 9 Representative SEM images of HGFs’ adhesion on the surfaces of each group after 24 hours (scale bar of A–C, E =5 μm, scale bar of D, F =600 nm). |
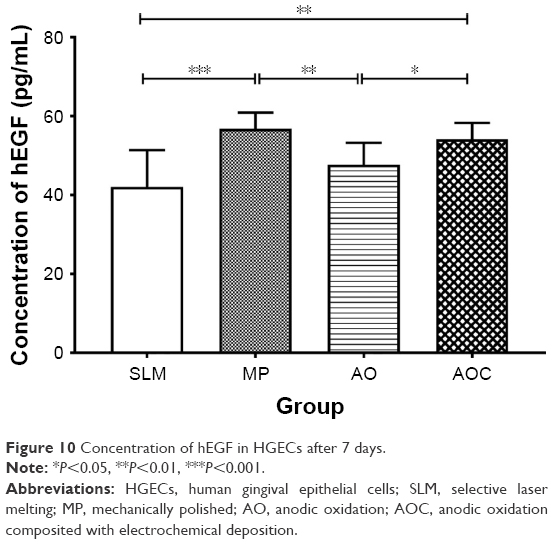
ELISA of hEGF protein secreted by HGECs
We used ELISA to determine the influence of different surface treatments on the expression of hEGF. Our data showed that the SLM and AO groups had significantly lower expression than the MP and AOC groups after 7 days’ inoculation of HGECs (P<0.05; Figure 10). There was no evidence of differences between SLM and AO groups. The MP and AOC groups showed the same results (P>0.05).
 | Figure 10 Concentration of hEGF in HGECs after 7 days. |
ELISA of type I collagen synthesis by HGFs
Type I collagen synthesized by HGFs was measured by ELISA and the data (Figure 11) showed increasing amounts of collagen synthesized by HGFs in the SLM, MP, AO, and AOC groups, in that order. The data of each group showed a statistically significant difference (P<0.05).
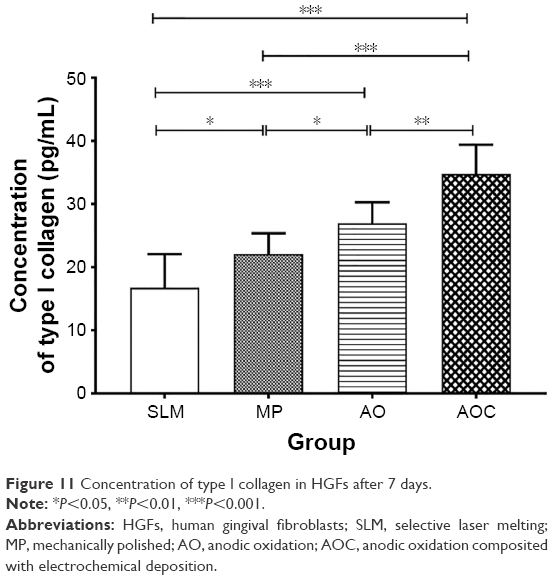 | Figure 11 Concentration of type I collagen in HGFs after 7 days. |
RT-PCR evaluation of gene expression by HGECs and HGFs
The relative gene expression levels of adhesion molecules (integrin-α6, integrin-β4, laminin-α3, laminin-β3, and laminin-γ2) in HGECs after 7 days of incubation on different samples showed the following results: AOC group = MP group > AO group = SLM group (Figure 12A).
 | Figure 12 Gene expression relating to adhesion measured with qRT-PCR after 7 days. |
After culturing for 7 days, the relative expression levels of fibronectin and vinculin in HGFs on different samples followed the order of AOC group > AO group > SLM group > MP group. For integrin-α3 and integrin-β1, the expression levels followed the order of AOC group > AO group > MP group > SLM group. The results are shown in Figure 12B.
Discussion
There is an increasing demand for customized implants given their convenient and individual application. This has led to a rapid development of SLM technology.13 Titanium is one of the most commonly used materials for SLM implants. The interface between implant and soft tissue has received increasing attention owing to its influence on successful implantation rate. Surface modifications are used on titanium to enhance this soft tissue barrier.20 In this study, we tested in vitro whether micro-/nano-topography of SLM titanium surface might positively affect the interaction between the dental implant and the surrounding soft tissue, by evaluating the adhesion, proliferation, and adhesion-related gene expressions of HGECs and HGFs. We tried to establish a new composition treatment technology for improved attachment to soft tissues. We chose the SLM surface as a control group to evaluate the function of anodization and electrochemical deposition. Furthermore, the MP group was selected, because the polished surface represents the first and more extensively tested implant surface, and long-term success rate of rehabilitation realized with these surfaces continues to be the reference point for all implant treatments.
Surface roughness usually plays an important role in the adhesion and proliferation of cells. In most research studies, the HGECs seem to prefer smooth surfaces.30–32 However, a microrough surface is recommended, which may be the best for HGFs.33,34 In our study, we produced the original SLM specimen with a 7.57 μm in Ra value. Except for the layer-by-layer SLM manufacturing process, the roughness is also influenced by the partially melted particles. Therefore, we used sandblasting technology and chemical polishing first, to decrease the roughness during the process of surface modification. Lastly, the AO and AOC specimens measured 2.15 μm in terms of Ra value and likely match the requirement for micro-roughness.
When we talk of surface features in the nanometer scale, we refer to topographical characteristics with dimensions less than 100 μm. In our study, we observed nanotubes with dimensions of approximately 70–90 μm. Nanotopography can regulate cell behavior.35 For example, nanotopography can promote neuronal differentiation of human induced pluripotent stem cells.36 Carbon nanotubes can induce fibrogenesis on nanostructured substrates.37 Kato et al reported that collagen fibers can integrate into the nanotubes resulting in enhanced cellular adhesion and collagen synthesis.38 Yang et al delineated the relationships between focal adhesions, nucleus and cell function and highlighted that nanotopography could regulate cell phenotype and function by modulating nuclear deformation.39 Furthermore, Takebe et al considered that a thin HA layer and anodic titanium oxide film with nanotopographic structure can regulate the gene expression of fibroblasts and epithelial cells.24–26 In this study, we adopted an electrochemical approach to deposit the nano-CaP into TiO2 nanotubes or the interval of nanotubes, expecting a better function than the HA layer. Our SEM results showed lamellipodia anchoring on the AO and AOC surfaces of HGECs and HGFs. This may enhance the adhesion and affect the proliferation and adhesion-related gene expressions as we expected.
In order to evaluate the biological features of these surfaces, we chose primary cultures of HGECs and HGFs as the cellular model, which are the main resident cell populations in the peri-implant connective attachment.
The data showed that after 7 days of incubation, HGECs on the AOC surface upregulated gene expressions of integrin-α6β4 and laminin-α3β3γ2 (laminin-5), the major components of the hemidesmosome and basement membrane, respectively, as compared to the SLM and AO surfaces. The MP surface is always considered best for HGECs but showed similar expressions as the AOC surface. Because hemidesmosome and basement membrane ensure efficient attachment of epithelial cells to the implant surface, these results predict that HGECs on the AOC surface could achieve better attachment to the implant than the SLM and AO surfaces, and as good as the MP surface.40,41 In addition, similar results were seen in proliferation and hEGF protein secretion activity of HGECs. Thus, implants with AOC surfaces may achieve faster epithelial sealing around the transmucosal component than that with SLM or AO surfaces. The CaP nanoparticles could be predicted to play a key role in enhancing adhesion, proliferation, and regulation of adhesion-related gene expressions in that the AOC samples showed stronger ability than AO samples and SLM samples. At the same time, the AOC surface was equally favorable for HGECs compared to the standard established MP surface.
The HGFs spread well and grew rapidly on all surfaces. AOC showed the best ability for cell proliferation, while SLM surface fared the worst at all time points. The type I collagen synthesis of HGFs showed the same results. Type I collagen is the major component of the extracellular matrix of connective tissues and plays a central role in the architecture of the peri-implant tissue, which is formed by both epithelial and connective structures. In particular, the connective attachment underlying the junctional epithelium comprises scar-tissue-like tissue with a high density of high turn-over fibroblasts (approximately one third in volume) and collagen fibers (approximately two thirds in volume) disposed in close contact with the titanium surface of the implant neck.42 The expression of integrin-α3 and integrin-β1 was consistent with these results. However, these cells expressed higher amounts of fibronectin and vinculin on the SLM than MP surface. It is known that fibroblasts adhere to implant surfaces by focal adhesion.43 Vinculin is a focal adhesion linker protein, and increased vinculin expression is associated with enhanced adhesion strength.44 A possible explanation is that the rougher SLM surface was easier to adhere to than the smooth MP surface, although the AOC surface showed the best adhesion.
Taken together, with respect to proliferation and adhesion, AOC was the best for HGFs and HGECs. Not only anodic oxidation but also CaP nanoparticles come into play when comparing with the original SLM surface. When compared to the classic MP surface, AOC was advantageous for HGFs and not bad for HGEs. Thus, implants with AOC surface may result in an early and effective formation of soft tissue barrier, which would be beneficial for the long-term maintenance of osseointegration. However, our results cannot be extrapolated to a clinical scenario yet because of the lack of animal experimentation, which forms the basis of future research.
Conclusion
In this study, anodic oxidation technology was successfully used to form nanotubes on the rough SLM surface to create a favorable micro-/nano-topography. Furthermore, CaP nanoparticles were deposited into the nanotubes or the interval of nanotubes with an electrochemical technique. This surface modification highly enhanced the adhesion, proliferation, and regulation of adhesion-related gene expressions of HGECs and HGFs, as compared to the original SLM surface. This treated surface can compare favorably with accepted MP surface for HGECs and is even better than MP surface for HGFs. These results indicate that forming appropriate micro-/nano-topographies can be an effective method to affect cell behavior and increase the stability of the peri-implant mucosal barrier which contributes to its application in dental and other biomedical implants. Further studies, however, are needed to investigate the in vivo and clinical implications of such encouraging preliminary results.
Acknowledgments
The authors would like to thank research staff members of the Department of Oral Implantology, Guanghua School of Stomatology and the Institute of Advanced Technology, Chinese Academy of Science for their support. This work is funded by National Natural Science Foundation of China (no 81501600) and Science & Technology Plan Project of Guangzhou (201710010193).
Disclosure
The authors report no conflicts of interest in this work.
References
Gaviria L, Salcido JP, Guda T, Ong JL. Current trends in dental implants. J Korean Assoc Oral Maxillofac Surg. 2014;40(2):50–60. | ||
Moin DA, Hassan B, Mercelis P, Wismeijer D. Designing a novel dental root analogue implant using cone beam computed tomography and CAD/CAM technology. Clin Oral Implants Res. 2013;24(A100):25–27. | ||
Figliuzzi M, Mangano F, Mangano C. A novel root analogue dental implant using CT scan and CAD/CAM: selective laser melting technology. Int J Oral Maxillofac Surg. 2012;41(7):858–862. | ||
Pattanayak DK, Fukuda A, Matsushita T, et al. Bioactive Ti metal analogous to human cancellous bone: Fabrication by selective laser melting and chemical treatments. Acta Biomater. 2011;7(3):1398–1406. | ||
Bormann T, Schulz G, Deyhle H, et al. Combining micro computed tomography and three-dimensional registration to evaluate local strains in shape memory scaffolds. Acta Biomater. 2014;10(2):1024–1034. | ||
Xiao D, Yang Y, Su X, Wang D, Sun J. An integrated approach of topology optimized design and selective laser melting process for titanium implants materials. Biomed Mater Eng. 2013;23(5):433–445. | ||
Yang N, Tian Y, Zhang D. Novel real function based method to construct heterogeneous porous scaffolds and additive manufacturing for use in medical engineering. Med Eng Phys. 2015;37(11):1037–1046. | ||
van Noort R. The future of dental devices is digital. Dent Mater. 2012;28(1):3–12. | ||
Pattanaik B, Pawar S, Pattanaik S. Biocompatible implant surface treatments. Indian J Dent Res. 2012;23(3):398–406. | ||
Yavari SA, Wauthle R, van der Stok J, et al. Fatigue behavior of porous biomaterials manufactured using selective laser melting. Mater Sci Eng C. 2013;33(8):4849–4858. | ||
Matena J, Petersen S, Gieseke M, et al. Comparison of Selective Laser Melted Titanium and Magnesium Implants Coated with PCL. Int J Mol Sci. 2015;16(6):13287–13301. | ||
Xu JY, Chen XS, Zhang CY, et al. Improved bioactivity of selective laser melting titanium: Surface modification with micro-/nano-textured hierarchical topography and bone regeneration performance evaluation. Mater Sci Eng C. 2016;68:229–240. | ||
Tsukanaka M, Fujibayashi S, Takemoto M, et al. Bioactive treatment promotes osteoblast differentiation on titanium materials fabricated by selective laser melting technology. Dent Mater J. 2016;35(1):118–125. | ||
de Wild M, Schumacher R, Mayer K, et al. Bone regeneration by the osteoconductivity of porous titanium implants manufactured by selective laser melting: a histological and micro computed tomography study in the rabbit. Tissue Eng Part A. 2013;19(23–24):2645–2654. | ||
Klinge B, Meyle J; Working Group 2. Soft-tissue integration of implants. Consensus report of Working Group 2. Clin Oral Implants Res. 2006;17 Suppl 2:93–96. | ||
Schupbach P, Glauser R. The defense architecture of the human periimplant mucosa: a histological study. J Prosthet Dent. 2007;97(6 Suppl):S15–S25. | ||
Heitz-Mayfield LJA. Peri-implant diseases: diagnosis and risk indicators. J Clin Periodontol. 2008;35(Suppl 2):292–304. | ||
Al-Radha AS, Pal A, Pettemerides AP, Jenkinson HF. Molecular analysis of microbiota associated with peri-implant diseases. J Dent. 2012;40(11):989–998. | ||
Hamilton DW, Chehroudi B, Brunette DM. Comparative response of epithelial cells and osteoblasts to microfabricated tapered pit topographies in vitro and in vivo. Biomaterials. 2007;28(14):2281–2293. | ||
Kunzler TP, Drobek T, Schuler M, Spencer ND. Systematic study of osteoblast and fibroblast response to roughness by means of surface-morphology gradients. Biomaterials. 2007;28(13):2175–2182. | ||
Welander M, Abrahamsson I, Berglundh T. The mucosal barrier at implant abutments of different materials. Clin Oral Implants Res. 2008;19(7):635–641. | ||
Annunziata M, Oliva A, Buosciolo A, et al. Bone marrow mesenchymal stem cell response to nano-structured oxidized and turned titanium surfaces. Clin Oral Implants Res. 2012;23(6):733–740. | ||
Son WW, Zhu X, Shin HI, Ong JL, Kim KH. In vivo histological response to anodized and anodized/hydrothermally treated titanium implants. J Biomed Mater Res B. 2003;66(2):520–525. | ||
Takebe J, Miyata K, Miura S, Ito S. Effects of the nanotopographic surface structure of commercially pure titanium following anodization-hydrothermal treatment on gene expression and adhesion in gingival epithelial cells. Mater Sci Eng C. 2014;42:273–279. | ||
Miyata K, Takebe J. Anodized-hydrothermally treated titanium with a nanotopographic surface structure regulates integrin-α6β4 and laminin-5 gene expression in adherent murine gingival epithelial cells. J Prosthodont Res. 2013;57(2):99–108. | ||
Miura S, Takebe J. Biological behavior of fibroblast-like cells cultured on anodized-hydrothermally treated titanium with a nanotopographic surface structure. J Prosthodont Res. 2012;56(3):178–186. | ||
Guida L, Oliva A, Basile MA, et al. Human gingival fibroblast functions are stimulated by oxidized nano-structured titanium surfaces. J Dent. 2013;41(10):900–907. | ||
Chen J, Zhang Z, Chen X, et al. Design and manufacture of customized dental implants by using reverse engineering and selective laser melting technology. J Prosthet Dent. 2014;112(5):1088–1095. | ||
Zhuang XM, Zhou B, Ouyang JL, et al. Enhanced MC3T3-E1 preosteoblast response and bone formation on the addition of nano-needle and nano-porous features to microtopographical titanium surfaces. Biomed Mater. 2014;9(4):045001. | ||
Baharloo B, Textor M, Brunette DM. Substratum roughness alters the growth, area, and focal adhesions of epithelial cells, and their proximity to titanium surfaces. J Biomed Mater Res A. 2005;74(1):12–22. | ||
Atsuta I, Ayukawa Y, Furuhashi A, et al. In vivo and in vitro studies of epithelial cell behavior around titanium implants with machined and rough surfaces. Clin Implant Dent Relat Res. 2014;16(5):772–781. | ||
An N, Rausch-Fan X, Wieland M, et al. Initial attachment, subsequent cell proliferation/viability and gene expression of epithelial cells related to attachment and wound healing in response to different titanium surfaces. Dent Mater. 2012;28(12):1207–1214. | ||
Teng FY, Ko CL, Kuo HN, Addition I, et al. A comparison of epithelial cells, fibroblasts, and osteoblasts in dental implant titanium topographies. Bioinorg Chem Appl. 2012;2012(4):687291. | ||
Zhou C, Lei F, Chodosh J, Paschalis EI. The Role of Titanium Surface Microtopography on Adhesion, Proliferation, Transformation, and Matrix Deposition of Corneal Cells. Invest Ophthalmol Vis Sci. 2016;57(4):1927–1938. | ||
Yang Y, Wang K, Gu X, Leong KW. Biophysical Regulation of Cell Behavior-Cross Talk between Substrate Stiffness and Nanotopography. Engineering. 2017;3(1):36–54. | ||
Song L, Wang K, Li Y, Yang Y. Nanotopography promoted neuronal differentiation of human induced pluripotent stem cells. Colloids Surf B Biointerfaces. 2016;148:49–58. | ||
Wang K, He X, Linthicum W, et al. Carbon Nanotubes Induced Fibrogenesis on Nanostructured Substrates. Environ Sci Nano. 2017;4(3):689–699. | ||
Kato E, Sakurai K, Yamada M. Periodontal-like gingival connective tissue attachment on titanium surface with nano-ordered spikes and pores created by alkali-heat treatment. Dent Mater. 2015;31(5):e116–e130. | ||
Wang K, Bruce A, Mezan R, et al. Nanotopographical Modulation of Cell Function through Nuclear Deformation. ACS Appl Mater Interfaces. 2016;8(8):5082–5092. | ||
Pendegrass CJ, Lancashire HT, Fontaine C, et al. Intraosseous transcutaneous amputation prostheses versus dental implants: A comparison between keratinocyte and gingival epithelial cell adhesion in vitro. Eur Cells Mater. 2012;29:237–249. | ||
El-Ghannam A, Starr L, Jones J. Laminin-5 coating enhances epithelial cell attachment, spreading, and hemidesmosome assembly on Ti-6A1-4V implant material in vitro. J Biomed Mater Res. 1998;41(1):30–40. | ||
Moon IS, Berglundh T, Abrahamsson I, Linder E, Lindhe J. The barrier between the keratinized mucosa and the dental implant. An experimental study in the dog. J Clin Periodontol. 1999;26(10):658–663. | ||
Pendegrass CJ, Middleton CA, Gordon D, Jacob J, Blunn GW. Measuring the strength of dermal fibroblast attachment to functionalized titanium alloys in vitro. J Biomed Mater Res A. 2010;92(3):1028–1037. | ||
Moon YH, Yoon MK, Moon JS, et al. Focal adhesion linker proteins expression of fibroblast related to adhesion in response to different transmucosal abutment surfaces. J Adv Prosthodont. 2013;5(3):341–350. |
 © 2018 The Author(s). This work is published and licensed by Dove Medical Press Limited. The
full terms of this license are available at https://www.dovepress.com/terms
and incorporate the Creative Commons Attribution
- Non Commercial (unported, 3.0) License.
By accessing the work you hereby accept the Terms. Non-commercial uses of the work are permitted
without any further permission from Dove Medical Press Limited, provided the work is properly
attributed. For permission for commercial use of this work, please see paragraphs 4.2 and 5 of our Terms.
© 2018 The Author(s). This work is published and licensed by Dove Medical Press Limited. The
full terms of this license are available at https://www.dovepress.com/terms
and incorporate the Creative Commons Attribution
- Non Commercial (unported, 3.0) License.
By accessing the work you hereby accept the Terms. Non-commercial uses of the work are permitted
without any further permission from Dove Medical Press Limited, provided the work is properly
attributed. For permission for commercial use of this work, please see paragraphs 4.2 and 5 of our Terms.