Back to Journals » Cancer Management and Research » Volume 12
MFAP2 is a Potential Diagnostic and Prognostic Biomarker That Correlates with the Progression of Papillary Thyroid Cancer
Authors Dong SY ![]() , Chen H, Lin LZ, Jin L, Chen DX
, Chen H, Lin LZ, Jin L, Chen DX ![]() , Wang OC, Ye ZQ
, Wang OC, Ye ZQ
Received 7 August 2020
Accepted for publication 4 November 2020
Published 7 December 2020 Volume 2020:12 Pages 12557—12567
DOI https://doi.org/10.2147/CMAR.S274986
Checked for plagiarism Yes
Review by Single anonymous peer review
Peer reviewer comments 3
Editor who approved publication: Dr Sanjeev K. Srivastava
Si Yang Dong,* Hao Chen,* Li Zhi Lin, Lingli Jin, Dan Xiang Chen, Ou Chen Wang, Zhi Qiang Ye
Department of Thyroid and Breast Surgery, The First Affiliated Hospital of Wenzhou Medical University, Wenzhou, Zhejiang, People’s Republic of China
*These authors contributed equally to this work
Correspondence: Zhi Qiang Ye; Ou Chen Wang
Department of Thyroid and Breast Surgery, The First Affiliated Hospital of Wenzhou Medical University, Wenzhou, Zhejiang 325000 People’s Republic of China
Tel/Fax +86 13867705524
Email [email protected] [email protected]
Background: Microfibril-associated protein 2 (MFAP2) is a protein coding gene that exerts important phenotypic effects on cell motility, and increasing research has indicated that MFAP2 was correlated with many cancers. However, the functional and potential clinical role of MFAP2 in papillary thyroid cancer (PTC) has not yet been verified.
Materials and Methods: We performed whole transcriptome sequencing on 78 paired PTC tissues and corresponding adjacent normal tissues and found that MFAP2 was highly expressed in PTC tissues. Then, we analyzed the expression of MFAP2 and its relation with the clinicopathological features of PTC in The Cancer Genome Atlas (TCGA) PTC genomic dataset. We detected MFAP2 expression in 40 paired PTC tissues and corresponding adjacent normal tissues through RT-qPCR (real time-quantitative polymerase chain reaction) to validate the sequencing data and TCGA cohort. Cell functional assays were performed to elucidate the function of MFAP2 in PTC cells, Western blot assay was performed to explore the correlation between MFAP2 and EMT (epithelial-mesenchymal transition)-related proteins.
Results: Statistical analysis showed that MFAP2 was obviously upregulated in PTC tissues compared to matched normal tissues, and the expression levels of MFAP2 in PTC tissues were strongly related with lymph node metastasis (p=0.016). The results of RT-qPCR of our own tissue specimens showed the same conclusions as that in TCGA dataset. The results of functional assays in PTC cell lines showed that MFAP2 could promote proliferation, colony formation, migration and invasion abilities and decrease the apoptotic rate in PTC cells. Western Blot assay showed that MFAP2 could regulate the expression of EMT-related proteins.
Conclusion: MFAP2 increases the proliferation, motility and decreases the apoptosis of PTC cells, and might be a potential therapeutic target for papillary thyroid cancer.
Keywords: biomarker, proliferation, migration, epithelial-mesenchymal transition, EMT, apoptosis
Introduction
The prevalence of thyroid cancer (TC) has increased rapidly nowadays and TC has become one of the most frequent endocrine malignancies in recent years.1 Rahib et al reported that the global TC cases increased by approximately 4% every year, and predicted it will surpass colorectal cancer by 2030 and become the fourth most commonly diagnosed cancer.2 TC is now generally classified into papillary thyroid carcinoma (PTC), follicular thyroid carcinoma (FTC), anaplastic thyroid carcinoma, medullary thyroid carcinoma, poorly differentiated thyroid cancer (PDTC), and Hurtle cell cancer.3 Among these types, PTC is the most frequent type and accounts for 80% to 85% of total TC cases.4 Though most of PTC patients have a relatively good prognosis and the 5-year survival rate exceeds 97%,5–7 a small group of PTC patients still suffer poor prognosis due to lymph node metastasis and distant metastasis.8,9 Therefore, identifying new biomarkers and exploring the molecular mechanisms that promote the progression of cancer are essential for early diagnosis and better treatment for PTC.
Microfibrillar-associated proteins (MFAPs) are a group of extracellular matrix glycoproteins including five subfamily members (MFAP1~5), these proteins have been reported to play a role in microfibril assembly and tissue homeostasis.10–12 Among these five members, Microfibril-associated protein 2 (MFAP2, also known as MAGP-1), with its coding gene located at 1p36.13, was reported to be associated with different kinds of malignant cancers in recent years. Chen et al showed that MFAP2 was overexpressed in melanoma and promoted invasion and migration abilities of melanoma through regulating the EMT-related proteins and Wnt/beta-catenin pathway.13 Li et al found that MFAP2 was up-regulated in gastric cancer and promotes motility of cancer cells through MFAP2/integrin alpha 5 beta 1/FAK/ERK pathway.14 Wang et al also reported that MFAP2 could promote epithelial-mesenchymal transition process of gastric cancer by activating TGF-beta/SMAD2/3 pathway.15 However, whether MFAP2 has an essential role in promoting PTC progression has not been studied yet.
With the help of whole transcriptome sequencing, the transcription level of 78 paired PTC tissues and corresponding adjacent normal tissues was measured (the data have not been published yet), we found that MFAP2 was highly overexpressed in PTC tissues, indicating that MFAP2 might play a role in PTC cells. The results of our own sequencing were verified by analyzing the data of TCGA cohort and measuring the expression of MFAP2 in 40 paired PTC tissues and adjacent normal tissues through qRT-PCR. The relation between MFAP2 expression level and clinicopathological features was analyzed. Loss-of-function assays were performed on two PTC cell lines (BCPAP and TPC-1) to explore the function of MFAP2 in PTC cells. To best of our knowledge, MFAP2 is an oncogene in PTC and might be a potential biomarker and therapeutic target in PTC.
Materials and Methods
Patients and Thyroid Tissue Specimens
Paired PTC samples and adjacent non-cancerous tissues were collected following curative surgical resection from 40 patients with PTC in the First Affiliated Hospital of Wenzhou Medical University in 2018. The tissues were frozen in liquid nitrogen at the time of resection and were stored in the refrigerator at −80°C before RNA extraction. None of the patients were treated with any preoperative therapy, such as chemotherapy and radiotherapy. RNA sequencing data of 78 paired PTC tissues and corresponding adjacent normal tissues were derived from data of another uncompleted study project, 78 paired samples were handled as was mentioned before and were sent for RNA sequencing. Ethical approvals of all studies mentioned were assessed by the Ethics Committee of The First Affiliated Hospital of Wenzhou Medical University. All patient-derived specimens and clinical information were collected with written informed consent and research protocols used in this research were approved by and conducted in accordance with the ethical standards of the Institutional Review Board of The First Affiliated Hospital of Wenzhou Medical University.
The Cancer Genome Atlas Database
The RNA-seq data and corresponding clinical information were downloaded from the TCGA database (https://tcgadata.nci.nih.gov/tcga/). In total, information of 502 cases of PTC patients and 58 normal persons with complete clinicopathological features such as gender, age, lymph node metastasis, tumor size, clinical stage (ACJJ7), and histological type was collected.
Cell Culture
Two human PTC cell lines (TPC-1 and BCPAP) were provided by Prof. Mingzhao Xing of Johns Hopkins University School of Medicine (Baltimore, MD, USA). Human normal thyroid cell line (HTORI3) was purchased from the Cell Bank of the Shanghai Chinese Academy of Sciences (Shanghai, China). All cell lines were cultured in RPMI 1640 medium (Invitrogen, Carlsbad, CA, USA) containing 10% fetal bovine serum (Gibco, Invitrogen, Carlsbad, CA, USA) and 1% penicillin/streptomycin (Solarbio, Beijing, China). Cells were maintained in humidified incubator (Thermo, Waltham, USA) with a 5% CO2 atmosphere at 37°C. The use of all cell lines in this study was approved by the Ethics Committee of The First Affiliated Hospital of Wenzhou Medical University.
RNA Extraction and RT-qPCR
Total RNA of tissue specimens and PTC cell line samples was extracted with TRIzol reagent (Thermo Fisher Scientific, Waltham, MA, USA) following the manufacturer’s protocol. The A260/A280 ratio and spectrophotometric value were measured to assess the RNA quality and quantity respectively. Then, 1 μg of RNA was reverse-transcribed with ReverTra Ace qPCR RT Kit (Toyobo, Osaka, Japan). Real-time PCR analysis was performed on Applied Biosystems 7500 Real-Time PCR (Thermo Fisher Scientific, Inc.) with SYBR Premix Ex Taq II kit (RR820A, TaKaRa, Dalian, China) following the manufacturer’s protocol. The relative expression of mRNA to GAPDH was calculated using the 2−∆∆Ct method. The primers used were as follows: MFAP2, forward 5ʹ- TCCGCCGTGTGTACGTCATT-3ʹ, reverse 5ʹ-CTGGCCATCACGCCACATTT-3ʹ; GAPDH, forward 5ʹ-GGTCGGAGTCAACGGATTTG-3ʹ; reverse 5ʹ-ATGAGCCCCAGCCTTCTCCAT-3ʹ (Generay, Shanghai, China; Sangon, Shanghai, China).
siRNA Transfection
Cells were cultured in six-well plates at a density of 7×10⁴cells/well and incubated for 24 h. Then cells were transfected with small interfering RNA (siRNA, Gene Pharma, Shanghai, China) by Lipofectamine RNA iMAX transfection reagent (Invitrogen, Grand Island, NY, USA) following the manufacturer’s protocol. 75 nM of MFAP2-siRNA and NC-siRNA were used for the transfection of two cell lines. After 48 h of transfection, the cells were harvested for further usage. The sequences of siRNAs used in this study were as follows: MFAP2-homo-221 (sense: 5ʹ-CCCACUAUAGCGACCAGAUTT-3ʹ; antisense: 5ʹ-AUCUGGUCGCUAUAGUGGGTT-3ʹ) MFAP2-homo-440 (sense: 5ʹ-CCAUACACAGGCCUUGCAATT-3ʹ; antisense: 5ʹ-UUGCAAGGCCUGUGUAUGGTT-3ʹ).
Cell Proliferation Assays and Colony Formation Assay
Cell proliferation and colony abilities were measured using CCK-8 assay and colony formation assay respectively. For CCK-8 assay, BCAPA and TPC-1 cells were transfected with MFAP2-siRNA and NC-siRNA respectively. After 48 hours of transfection, cells were harvested and plated at 1500 cells per well onto the 96-well plates. The cell-counting kit 8 (CCK8, Beyotime, Biotechnology, Shanghai, China) was added at 10 μL/well and cells were cultured in incubator for 3 hours. 450 nm absorbance was measured using spectrophotometer (DS-11 FX; DeNovix, Wilmington, USA), this step was repeated every 24 hfor4 times and the proliferation curve was drawn.
For colony formation assay, BCPAP and TPC-1 cells (1500 cells/well) were planted in 6-well plates after 48 h of transfection and were cultured continuously for 7 days. When there were more than 50 cells in one colony and total colonies were above 30, cells were fixed with 4% paraformaldehyde for 15 minutes and stained with 0.1% crystal violet solution for 30 minutes. Images were captured by the C1si camera (Nikon Instruments Inc., Melville, USA).
Migration and Invasion Assays
After 48 h of transfection, we planted about 3.6 × 10⁴ cells/0.3 mL of BCAPA and TPC-1 cells in the upper chamber of the transwell chambers (#3422, Corning, NY, USA) for cell migration assays. Besides, 0.6 mL of medium containing 20% FBS was added to the lower chamber. The cells were cultured for 22 hours and were fixed with 4% paraformaldehyde for 15 minutes and stained with 0.1% crystal violet for 30 minutes. The image was captured by microscope (magnification was 20×) for further analysis.
BioCoat Matrigel Invasion Chambers (#354480, Corning Biocoat, USA) was used for invasion assay. The procedure was similar to that descried in cell migration assay.
Cell Apoptosis Assay
BCPAP and TPC-1 cells were cultivated in 6-well plate and transfected with MFAP2-siRNA or negative control siRNA for 48 h, all the cells were harvested and double-stained with FITC-Annexin V and PI with Annexin V-fluorescein isothiocyanate (FITC) apoptosis kit (#556547; Becton, Dickinson and Company, Franklin Lakes, NJ, USA) based on the manufacturer’s manual. Flow cytometry (BD Biosciences Accuri C6; Becton, Dickinson and Company) was used to examine cell apoptosis and Flowjo software (Flowjo, Ashland, OR, USA) was used to analyze the results.
Protein Extraction and Western Blot Analysis
Total protein samples were cleaved in RIPA lysis buffer (Beyotime, Shanghai, China), the protein concentration was measured by using bicinchoninic acid assay (Thermo Scientific, USA). Proteins were separated by 8%-10% sodium dodecyl sulfate polyacrylamide gel electrophoresis (BioRad, Berkeley, CA, USA) and were transferred into PVDF membranes (EMD Millipore, Billerica, MA, USA). The PVDF membranes were blocked with 5% skim milk (BD, Difco Skim Milk, 232100) for 2 hours at room temperature. Then, the PVDF membranes were added to primary antibody and incubated overnight at 4°C. After washing three times with TBSB, the membranes were incubated with secondary antibody (Abcam, Cambridge, UK) at room temperature for 2 hours. Proteins were visualized with enhanced chemiluminescence (Thermo Scientific) detection system. The primary antibodies used included vimentin, N-cadherin, E-cadherin, β-catenin and β-actin. Goat anti-mouse HRP-conjugated IgG (Abcam) was the secondary antibody. All of the primary antibodies were purchased from Abcam, β-actin served as internal control.
Statistical Analysis
All experiments were performed in triplicate and data were shown as the mean ± SD. All statistical analyses were performed with SPSS 22.0 software (IBM SPSS Inc, Chicago, IL, USA). Expression level of MFAP2 in PTC samples was compared with adjacent normal tissues using the paired t-test. The association between MFAP2 expression and clinicopathological features was evaluated using the chi-squared test. The expression difference between groups, the transfection efficiency, cell viability assay, invasion assay, and apoptosis assay were analyzed using independent samples t-test, the differences were considered to be statistically significant at P<0.05.
Results
MFAP2 Was Significantly Upregulated in PTC Tissues and Cell Lines
According to the sequencing results of our 78 paired PTC tissues and adjacent normal tissues (data not published yet), we found that MFAP2 was especially overexpressed in PTC tissues compared to normal tissues (Figure 1C). Then we downloaded the transcriptome sequencing data from The Cancer Genome Atlas (TCGA) and analyzed the expression level of MFAP2, the results also indicated that MFAP2 was up-regulated specifically in PTC tissues (Figure 1A, D and E). We detected the expression of MFAP2 in 40 paired specimens by using RT-qPCR. According to the analysis of the result, we observed a significant up-regulation of MFAP2 in PTC tumor samples compared to adjacent normal tissues (Figure 1B). Then we detected the expression of MFAP2 in two PTC cell lines (TCP-1 and BCPAP) and one normal thyroid cell line (HTORI-3). The results showed the expression of MFAP2 in PTC cell lines was also significantly higher than that in normal thyroid cell line (Figure 2C).
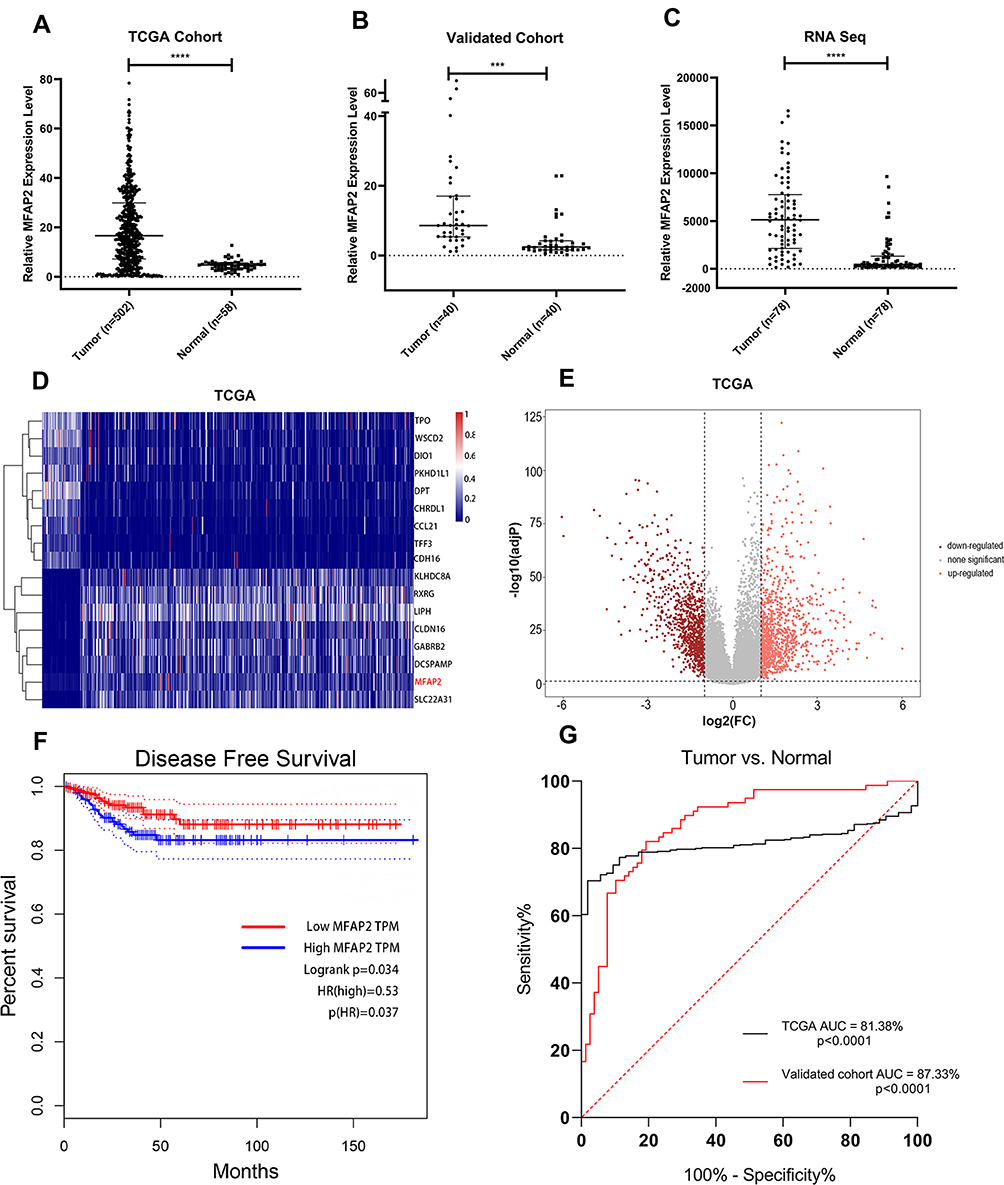 |
Figure 1 MFAP2 was overexpressed in PTC and provided a great prognostic and diagnostic value in PTC. (A) MFAP2 expression levels were greater in PTC tissues than in normal thyroid tissues in TCGA dataset. (B) The overexpression of MFAP2 in PTC was verified in our validated cohort by using qRT-PCR. (C) MFAP2 was upregulated in 78 PTC tissues compared with corresponding non-tumorous thyroid tissues from our RNA sequencing dataset. (D) Heatmap of the differentially expressed genes in TCGA database, based on the adjusted p-value. (E) Volcano map of genes expressed in TPC. (F) Disease-free survival analysis of MFAP2 expression levels in TCGA database using Kaplan-Meier analyses. (G) ROC curve analysis of MFAP2 expression levels in PTC patients. ***p<0.001, ****p<0.0001. |
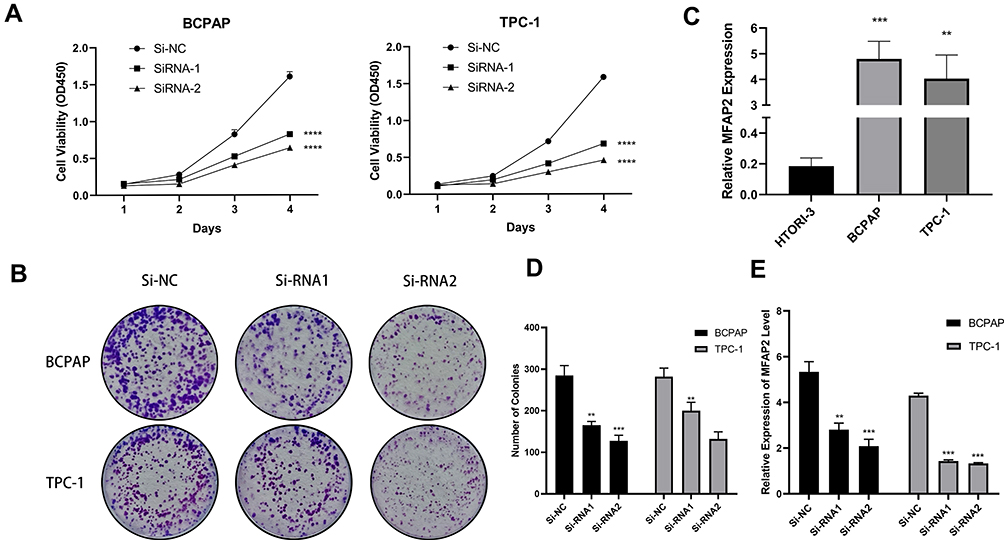 |
Figure 2 MFAP2 was upregulated in PTC cell lines and induced their proliferation abilities in vitro. (A) CCK-8 assays performed in two PTC cell lines. (B, D) Colony formation assays in two PTC cell lines and corresponding number of colonies. (C) The relative expression of MFAP2 in PTC cell lines. MFAP2 was upregulated in two PTC cell lines (BCPAP and TPC-1) compared to normal thyroid cell line HTORI-3. (E) MFAP2 expression levels were lower in Si-MFAP2 groups than in Si-NC group in the two PTC cell lines. **p<0.01, ***p<0.001, ****p<0.0001. |
MFAP2 Expression Was Correlated with Clinicopathological Characteristics in PTC
To investigate the correlation between MFAP2 expression levels and clinicopathological features in PTC, we divided the TCGA cohort into high expression group and low expression group, based on the median expression level of MFAP2 in tumor tissues. As shown in Table 1, MFAP2 expression level was significantly associated with lymph node metastasis (P=0.016), histological type (classical vs other types, p=0.002), neoplasm focus type (unifocal vs multifocal, p=0.01), but we could not find an association of remaining factors such as gender (p=0.273), tumor size (p=0.714), and age (p=0.273) with the expression of MFAP2. In local cohort, the ratio of MFAP2 expression in cancer tissues and corresponding normal tissues was calculated, patients were also divided into high expression group (n=20) and low expression group (n=20) based on the median of ratio. In local cohort, we found the same trend as shown in TCGA cohort (Table 2).
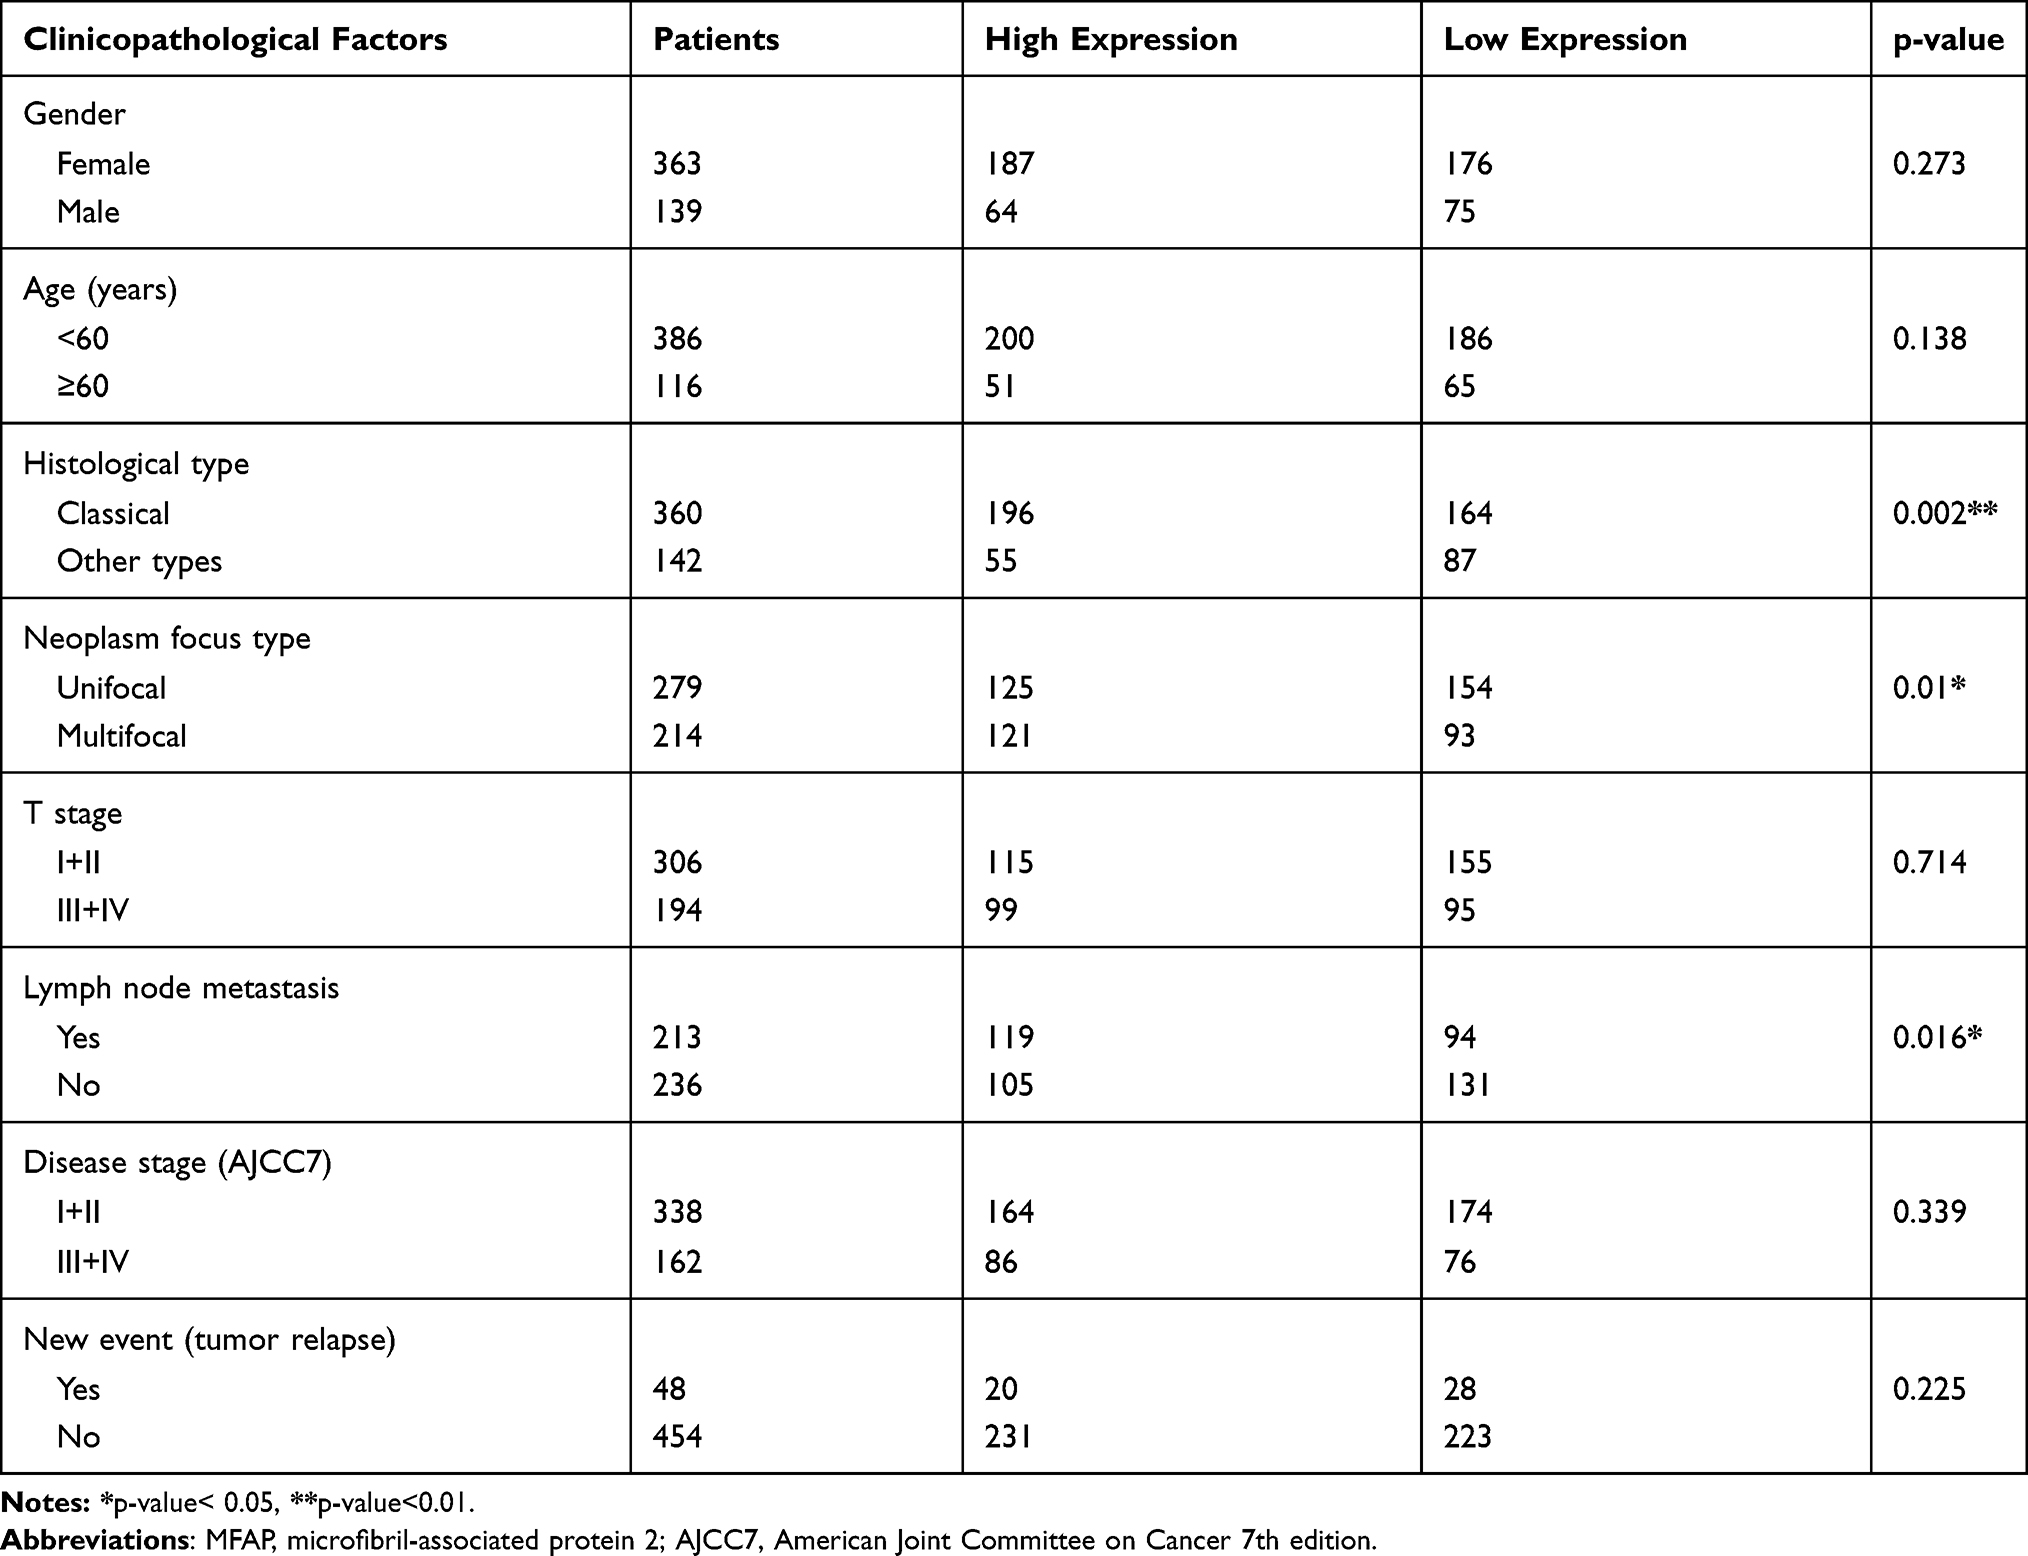 |
Table 1 Correlation Between MFAP2 Expression and Clinicopathological Factors in TCGA Cohort |
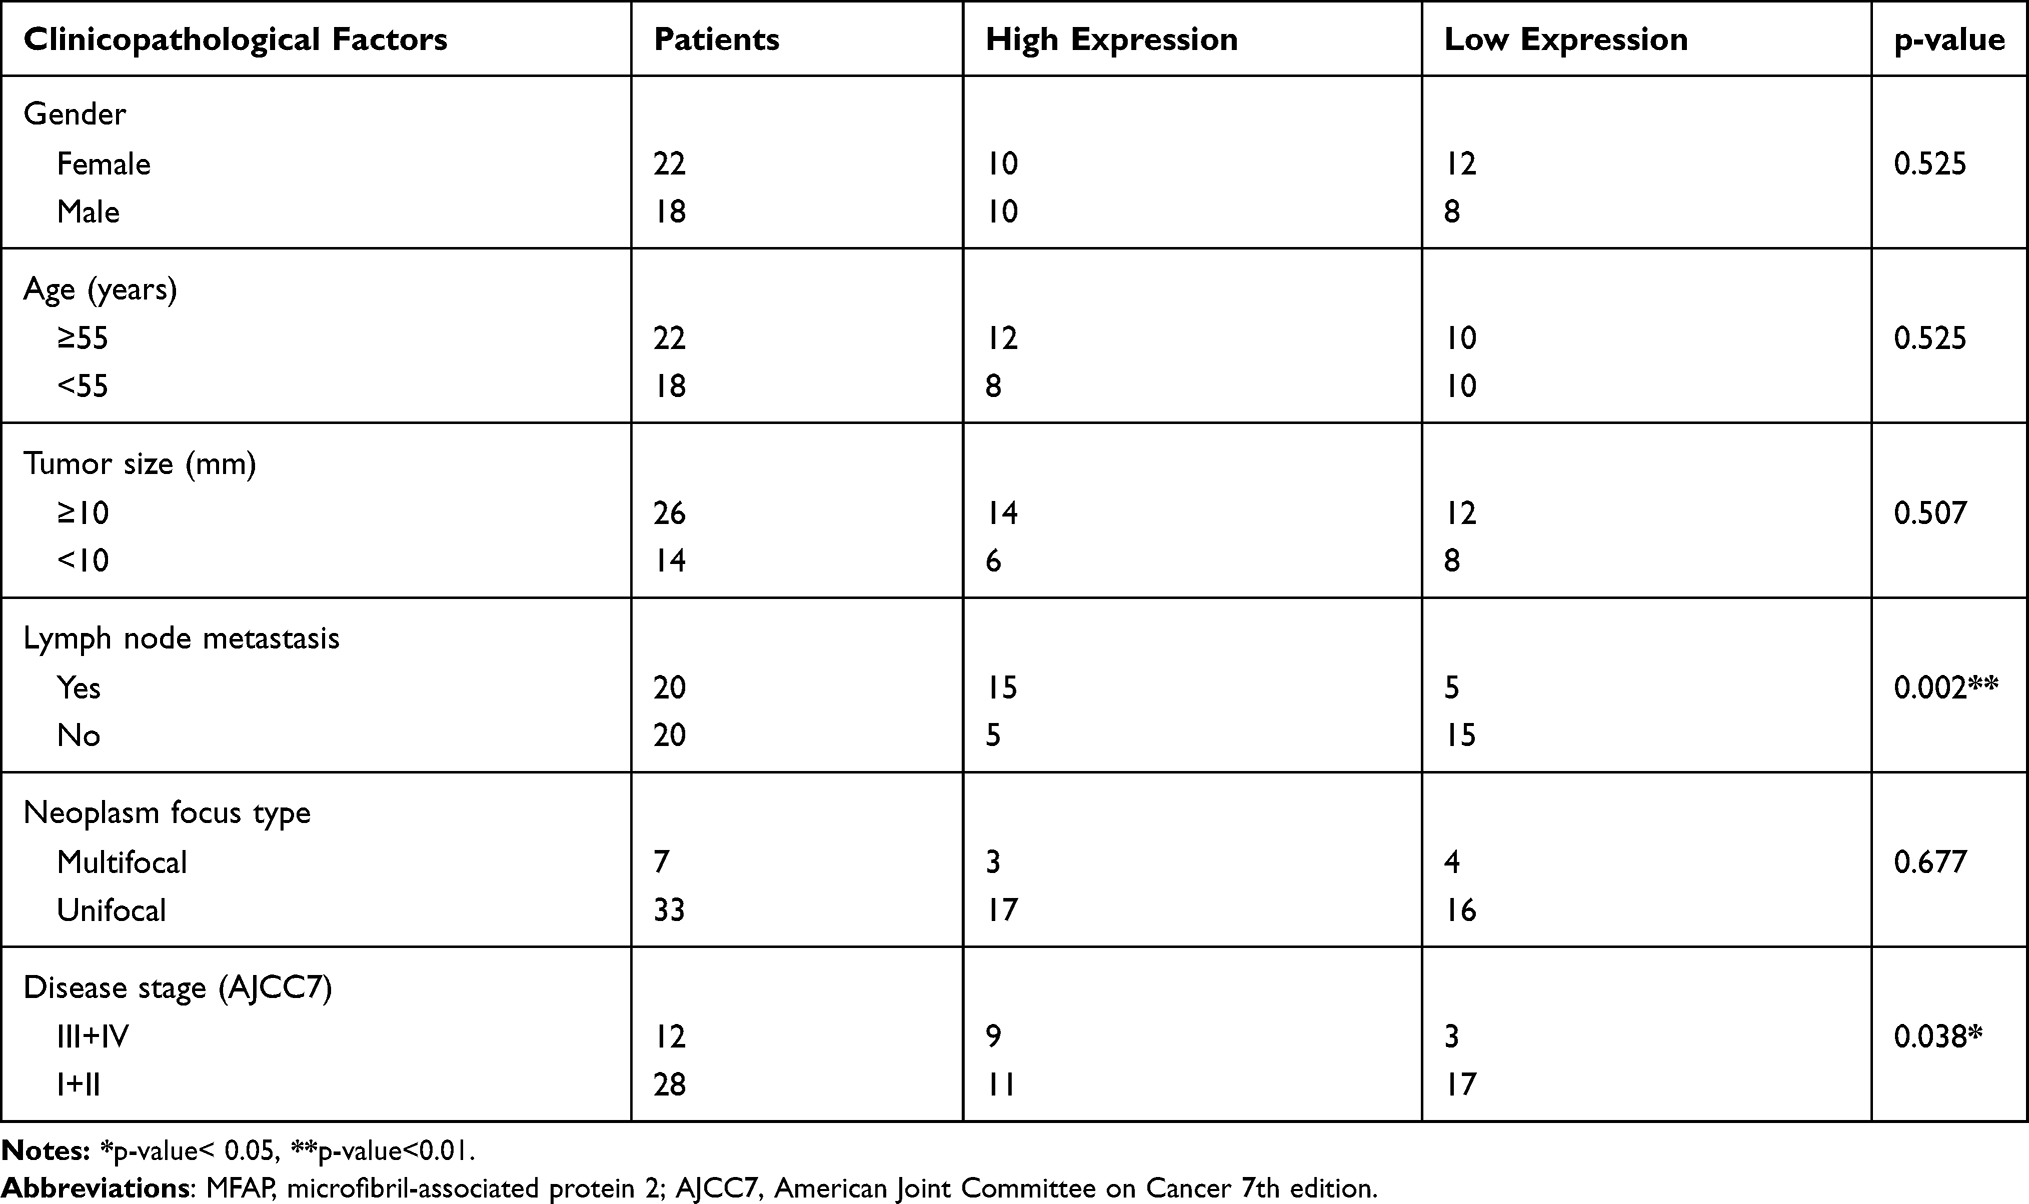 |
Table 2 Correlation Between MFAP2 Expression and Clinicopathological Factors in Validated Cohort |
The Diagnostic and Prognostic Value of MFAP2 in PTC Patients
To investigate the prognostic value of MFAP2 in PTC, we performed disease-free survival analysis for TCGA data and found that upregulation of MFAP2 in PTC was associated with higher risk of relapse or death (Figure 1F, hazard ratio [HR] = 0.53, p = 0.037), thus overexpression of MFAP2 might predict a worse prognosis in PTC. We also analyzed the receiver operating characteristic (ROC) curves for TCGA database and our validated cohort to investigate the diagnostic value of MFAP2 in PTC (Figure 1G), the result showed that MFAP2 expression could distinguish between PTC tissues and normal tissues properly (TCGA: AUC = 81.38%, p<0.0001; validated cohort: AUC = 87.33%, p<0.0001).
Knockdown of MFAP2 Inhibited the Proliferation of PTC Cells
To elucidate the correlation between MFAP2 and proliferation ability of PTC cells, we downregulated the expression of MFAP2 level in PTC cells by transfection with MFAP2-siRNA, the expression of MFAP2 in si-MFAP2 groups was downregulated by more than 50% compared to control groups (Figure 2E). The results of Cell Counting Kit-8 assay showed that the down-regulation of MFAP2 suppressed the proliferation of PTC cells (Figure 2A). Additionally, colony formation assay demonstrated the number of colonies were significantly decreased in MFAP2 knockdown group compared to the control group (Figure 2B and D).
Down-Regulation of MFAP2 Suppressed the Migration and Invasion Abilities of PTC Cells
To investigate whether MFAP2 affects the migration and invasion characteristics of PTC cells, we performed cell migration and invasion assays. The result of cell migration assay showed that the number of BCPAP and TPC-1 cells that passed through the polycarbonate membrane of the chamber were reduced significantly in MFAP2-siRNA transfected group (Figure 3A and C). The same result was seen in cell invasion assay (Figure 3B and D). These findings showed that the down-regulation of MFAP2 weakened the migration and invasion abilities of PTC cells.
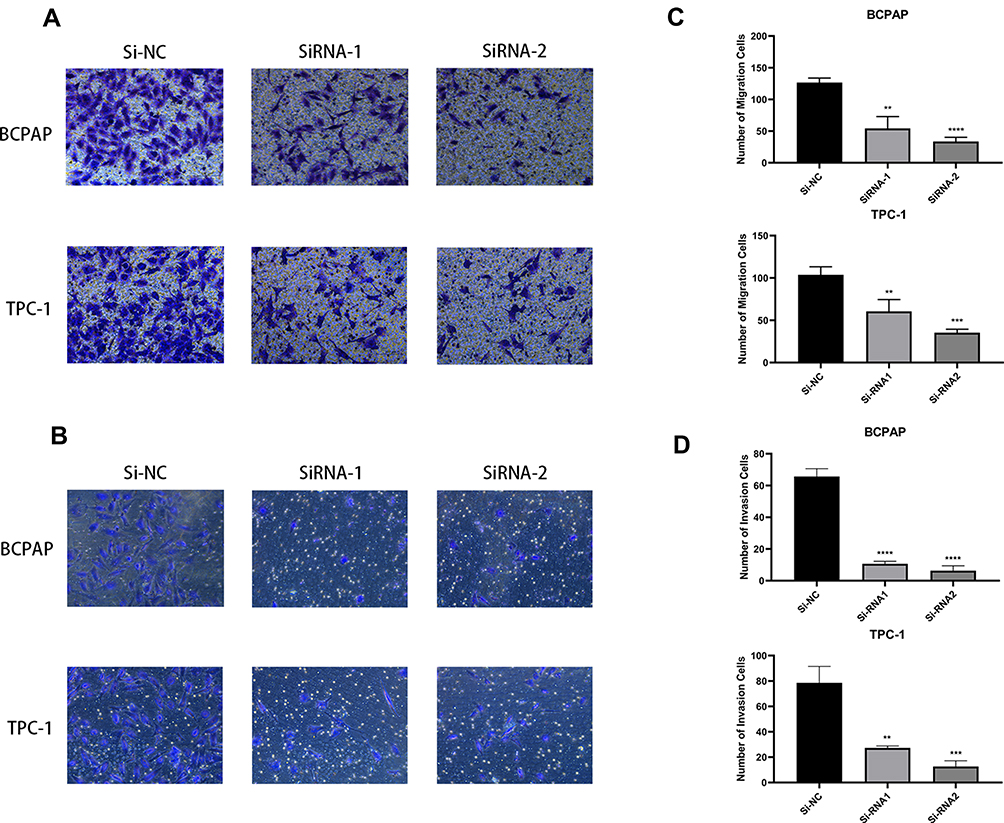 |
Figure 3 Downregulation of MFAP2 inhibited the migration and invasion abilities in PTC cell lines. (A, C) Transwell migration assay in Si-MFAP2 group and corresponding control group in two PTC cell lines. (B, D) The Matrigel assay in Si-MFAP2 groups and corresponding control group in two PTC cell lines. The quantitative results of the migration assay were determined from five random fields. The data came from at least three independent experiments. **p<0.01, ***p<0.001, ****p<0.0001. |
Down-Regulation of MFAP2 Promoted the Apoptotic Rate in PTC Cells
Low apoptosis level is an important feature of cancer cells.16 To elucidate the connection between apoptosis degree and expression level of MFAP2 in PTC cells, we performed Annexin V/PI assay on MFAP2-siRNA transfected PTC cells and corresponding nonsense-siRNA transfected cells. According to the result of flow cytometry analysis, we found that knockdown of MFAP2 in BCPAP and TPC-1 cells could induce cell apoptosis (Figure 4A–D). The apoptotic rate in BCPAP and TCP-1 cells which were transfected with MFAP2-siRNA was higher compared with the control group.
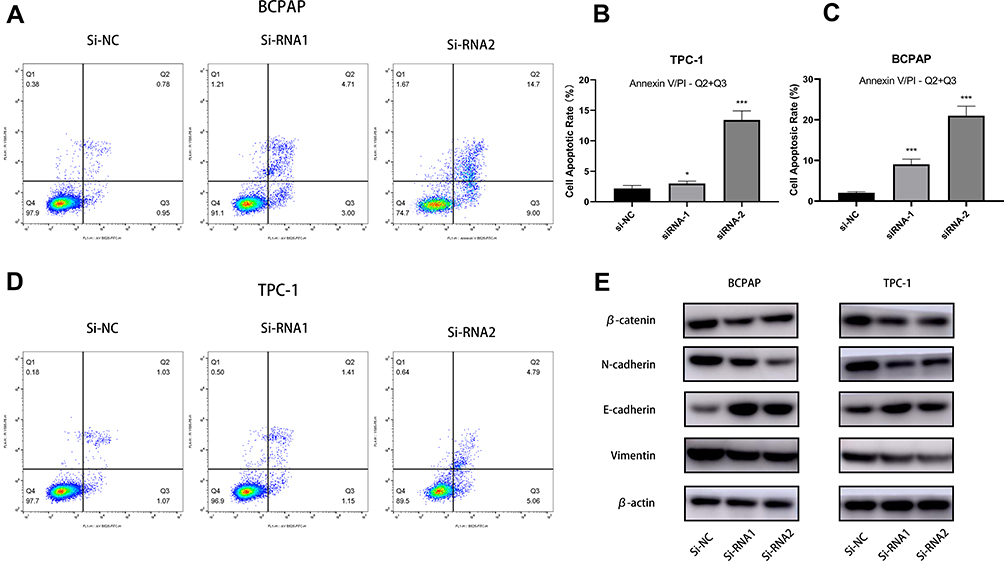 |
Figure 4 Downregulation of MFAP2 prevented EMT while promoting apoptotic rate in PTC cell lines. (A, B, C, D) Silencing of MFAP2 promoted apoptosis in PTC cell lines. (E) Western blotting showed knockdown of MFAP2 upregulated E-cadherin and downregulated N-cadherin, Vimentin and β-catenin in protein levels. *p<0.05 and ***p<0.001. |
MFAP2 Promoted Tumorigenesis via Modulating Epithelial-Mesenchymal Transition in TPC-1 and BCAPA Cell Lines
Epithelial-mesenchymal transition (EMT) is an indispensable process during tumor progression and metastasis, so we aimed to investigate the potential mechanism by which MFAP2 contributed to the progression of PTC.17 Through a series of Western blotting, we found the expression levels of EMT-related protein, as shown in Figure 4E, were correlated with the expression of MFAP2. We found the expression of E-cadherin was increased but Vimentin, N-cadherin, and β-catenin expression levels were decreased after knocking down MFAP2 in PTC cells (Figure 4E). We considered that MFAP2 could promote EMT process in PTC.
Discussion
Thyroid cancer is one of the most common endocrine cancers in the world, among its four main subtypes, papillary thyroid cancer is the most frequent type,4 and although it has a relatively better prognosis than other subtypes, some patients can still suffer from lymph node metastasis, capsular invasion, and distant metastasis due to individual genetic background differences.
Tumorigenesis is a very complex process and is regulated by polygene through multi-steps. It is necessary to discover gene mutations that participate in tumorigenesis at different levels and reveal roles they play to understand cancer properly and find better biomarkers to diagnose cancer earlier and develop better treatment to cure cancer.
Through years of research, an increasing number of gene mutations that correlate with PTC have been discovered by different researchers. Among these genes, BRAF V600E is the most famous gene mutation in thyroid cancer,18 which is highly specific for PTC. Overexpression of BRAF can accelerate tumorigenesis and progression through triggering the mitogen-activated pathway kinase (MAPK). Thanks to the discovery of the role BRAF played in PTC, the accuracy of FNAC (Fine Needle Aspiration cytology) to diagnose PTC increased rapidly when detection of BRAF mutation was included as an index.19,20 However, several studies have demonstrated that it is not enough to diagnose PTC only with BRAF V600E alone.21,22 So, there has been increasing effort to search for other gene mutations that are highly correlated with PTC and we have made great achievements. Up to now, gene mutations such as RAS mutation,23 TERT mutation, and PTEN mutation have been found to correlate with the malignancy of PTC which makes them potential biomarkers in predicting prognosis.24
To find the gene that correlates with PTC, we performed whole-transcriptome sequencing on 78 paired PTC tissues and corresponding adjacent normal tissues and found that MFAP2 was highly expressed in PTC cells. The results of TCGA sequencing data analysis and RT-qPCR of 40 paired PTC tissues and adjacent normal tissues validated the finding in sequencing. Through analyzing the TCGA clinical data, we found that MFAP2 was correlated with lymph node metastasis (p=0.018).
Functional assays showed that down-regulation of MFAP2 significantly inhibited the proliferation, colony formation, migration and invasion abilities and increased the apoptotic rate of PTC cells. Through Western blot assay, we found that the expression levels of EMT-related proteins were changed in MFAP2 knockout cells: N-cadherin, Vimentin, and β-catenin were down-regulated when MFAP2 was knocked out in PTC cells, but the expression of E-cadherin was up-regulated. The discoveries in our study indicated that MFAP2 was an oncogene in PTC.
However, our study has some limitations. Firstly, a larger number of samples was needed to confirm the result of this study. Secondly, the clear mechanism through which MFAP2 regulates the expression of EMT-related proteins requires further investigation to provide insight into PTC metastasis. Besides, additional animal model assays are required to confirm MFAP2 function in vivo.
Conclusion
In summary, our findings show that MFAP2 was overexpressed in PTC, its up-regulation could induce proliferation, migration, invasion and suppress cell apoptosis. The results of our study indicate that MFAP2 was a potential biomarker and might be a treatment target in PTC.
Ethics Approval and Informed Consent
Ethical approval of this study was assessed by the Ethics Committee of The First Affiliated Hospital of Wenzhou Medical University. All patient-derived specimens and clinical information were collected with written informed consent and research protocols used in this research were approved by and conducted in accordance with the ethical standards of the Institutional Review Board of The First Affiliated Hospital of Wenzhou Medical University.
Acknowledgment
These authors contributed to the work equally and should be regarded as co-first authors: SiYang Dong and Hao Chen.
Funding
This work was funded by Wenzhou science and Technology Bureau (Y2020930).
Disclosure
The authors report no conflicts of interest in this work.
References
1. Torre LA, Siegel RL, Ward EM, Jemal A. Global Cancer Incidence and Mortality Rates and Trends–An Update. Cancer Epidemiol Biomarkers Prev. 2016;25(1):16–27.
2. Rahib L, Smith BD, Aizenberg R, Rosenzweig AB, Fleshman JM, Matrisian LM. Projecting cancer incidence and deaths to 2030: the unexpected burden of thyroid, liver, and pancreas cancers in the United States. Cancer Res. 2014;74(11):2913–2921. doi:10.1158/0008-5472.CAN-14-0155
3. Burns WR, Zeiger MA. Differentiated thyroid cancer. Semin Oncol. 2010;37(6):557–566. doi:10.1053/j.seminoncol.2010.10.008
4. La Vecchia C, Malvezzi M, Bosetti C, et al. Thyroid cancer mortality and incidence: a global overview. Int J Cancer. 2015;136(9):2187–2195. doi:10.1002/ijc.29251
5. Milano AF. Thyroid cancer: 20-year comparative mortality and survival analysis of six thyroid cancer histologic subtypes by age, sex, race, stage, cohort entry time-period and disease duration (seer*stat 8.3.2) a systematic review of 145,457 cases for diagnosis years 1993–2013. J Insur Med. 2018;47(3):143–158.
6. Lundgren CI, Hall P, Dickman PW, Zedenius J. Clinically significant prognostic factors for differentiated thyroid carcinoma: a population-based, nested case-control study. Cancer. 2006;106(3):524–531. doi:10.1002/cncr.21653
7. Suliburk J, Delbridge L. Surgical management of well-differentiated thyroid cancer: state of the art. Surg Clin North Am. 2009;89(5):1171–1191. doi:10.1016/j.suc.2009.06.013
8. Schneider DF, Chen H. New developments in the diagnosis and treatment of thyroid cancer. CA Cancer J Clin. 2013;63(6):374–394. doi:10.3322/caac.21195
9. Wada N, Suganuma N, Nakayama H, et al. Microscopic regional lymph node status in papillary thyroid carcinoma with and without lymphadenopathy and its relation to outcomes. Langenbecks Arch Surg. 2007;392(4):417–422. doi:10.1007/s00423-007-0159-4
10. Penner AS, Rock MJ, Kielty CM, Shipley JM. Microfibril-associated glycoprotein-2 interacts with fibrillin-1 and fibrillin-2 suggesting a role for MAGP-2 in elastic fiber assembly. J Biol Chem. 2002;277(38):35044–35049. doi:10.1074/jbc.M206363200
11. Craft CS, Broekelmann TJ, Mecham RP. Microfibril-associated glycoproteins MAGP-1 and MAGP-2 in disease. Matrix Biol. 2018;71–72:100–111. doi:10.1016/j.matbio.2018.03.006
12. Mecham RP, Gibson MA. The microfibril-associated glycoproteins (MAGPs) and the microfibrillar niche. Matrix Biol. 2015;47:13–33. doi:10.1016/j.matbio.2015.05.003
13. Chen Z, Lv Y, Cao D, Li X, Microfibril-Associated Protein LY. 2 (MFAP2) Potentiates Invasion and Migration of Melanoma by EMT and Wnt/beta-Catenin Pathway. Med Sci Monit. 2020;26:e923808.
14. Yao L-W, Wu -L-L, Zhang L-H, et al. MFAP2 is overexpressed in gastric cancer and promotes motility via the MFAP2/integrin α5β1/FAK/ERK pathway. Oncogenesis. 2020;9(2):17. doi:10.1038/s41389-020-0198-z
15. Wang J-K, Wang W-J, Cai H-Y, et al. MFAP2 promotes epithelial–mesenchymal transition in gastric cancer cells by activating TGF-β/SMAD2/3 signaling pathway. Onco Targets Ther. 2018;11:4001–4017. doi:10.2147/OTT.S160831
16. Elmore S. Apoptosis: a review of programmed cell death. Toxicol Pathol. 2007;35(4):495–516. doi:10.1080/01926230701320337
17. Nieto MA, Huang R-J, Jackson RA, Thiery JP. Emt: 2016. Cell. 2016;166(1):21–45. doi:10.1016/j.cell.2016.06.028
18. Xing M. BRAF V600E Mutation and Papillary Thyroid Cancer. JAMA. 2013;310(5):535. doi:10.1001/jama.2013.8592
19. Xing M, Tufano RP, Tufaro AP, et al. Detection of BRAF mutation on fine needle aspiration biopsy specimens: a new diagnostic tool for papillary thyroid cancer. J Clin Endocrinol Metab. 2004;89(6):2867–2872. doi:10.1210/jc.2003-032050
20. Paek SH, Kim BS, Kang KH, Kim HS. False-negative BRAF V600E mutation results on fine-needle aspiration cytology of papillary thyroid carcinoma. World J Surg Oncol. 2017;15(1):202. doi:10.1186/s12957-017-1266-5
21. Nam JK, Jung CK, Song BJ, et al. Is the BRAFV600E mutation useful as a predictor of preoperative risk in papillary thyroid cancer? Am J Surg. 2012;203(4):436–441. doi:10.1016/j.amjsurg.2011.02.013
22. Ito Y, Yoshida H, Maruo R, et al. BRAF mutation in papillary thyroid carcinoma in a Japanese population: its lack of correlation with high-risk clinicopathological features and disease-free survival of patients. Endocr J. 2009;56(1):89–97. doi:10.1507/endocrj.K08E-208
23. Liu Z, Hou P, Ji M, et al. Highly prevalent genetic alterations in receptor tyrosine kinases and phosphatidylinositol 3-kinase/akt and mitogen-activated protein kinase pathways in anaplastic and follicular thyroid cancers. J Clin Endocrinol Metab. 2008;93(8):3106–3116. doi:10.1210/jc.2008-0273
24. Liu X, Bishop J, Shan Y, et al. Highly prevalent TERT promoter mutations in aggressive thyroid cancers. Endocr Relat Cancer. 2013;20(4):603–610. doi:10.1530/ERC-13-0210
25. Yehia L, Ni Y, Sesock K, et al. Unexpected cancer-predisposition gene variants in Cowden syndrome and Bannayan-Riley-Ruvalcaba syndrome patients without underlying germline PTEN mutations. PLoS Genet. 2018;14(4):e1007352. doi:10.1371/journal.pgen.1007352
 © 2020 The Author(s). This work is published and licensed by Dove Medical Press Limited. The
full terms of this license are available at https://www.dovepress.com/terms
and incorporate the Creative Commons Attribution
- Non Commercial (unported, 3.0) License.
By accessing the work you hereby accept the Terms. Non-commercial uses of the work are permitted
without any further permission from Dove Medical Press Limited, provided the work is properly
attributed. For permission for commercial use of this work, please see paragraphs 4.2 and 5 of our Terms.
© 2020 The Author(s). This work is published and licensed by Dove Medical Press Limited. The
full terms of this license are available at https://www.dovepress.com/terms
and incorporate the Creative Commons Attribution
- Non Commercial (unported, 3.0) License.
By accessing the work you hereby accept the Terms. Non-commercial uses of the work are permitted
without any further permission from Dove Medical Press Limited, provided the work is properly
attributed. For permission for commercial use of this work, please see paragraphs 4.2 and 5 of our Terms.