Back to Journals » Drug Design, Development and Therapy » Volume 14
Metformin Activates the AMPK-mTOR Pathway by Modulating lncRNA TUG1 to Induce Autophagy and Inhibit Atherosclerosis
Authors You G, Long X, Song F ![]() , Huang J, Tian M, Xiao Y, Deng S, Wu Q
, Huang J, Tian M, Xiao Y, Deng S, Wu Q
Received 10 October 2019
Accepted for publication 11 January 2020
Published 3 February 2020 Volume 2020:14 Pages 457—468
DOI https://doi.org/10.2147/DDDT.S233932
Checked for plagiarism Yes
Review by Single anonymous peer review
Peer reviewer comments 2
Editor who approved publication: Prof. Dr. Georgios Panos
Ganhua You, 1, 2 Xiangshu Long, 3, 4 Fang Song, 3, 4 Jing Huang, 3, 4 Maobo Tian, 3, 4 Yan Xiao, 3, 4 Shiyan Deng, 3, 4 Qiang Wu 3, 4
1Guizhou University School of Medicine, Guiyang 550025, People’s Republic of China; 2Guizhou Institute for Food and Drug Control, Guiyang 550004, People’s Republic of China; 3Department of Cardiology, Guizhou Provincial People’s Hospital, Guiyang 550002, People’s Republic of China; 4Department of Cardiology, People’s Hospital of Guizhou University, Guiyang 550002, People’s Republic of China
Correspondence: Qiang Wu
Department of Cardiology, Guizhou Provincial People’s Hospital, 83 Zhongshan East Road, Guiyang, Guizhou, People’s Republic of China
Tel +86-0851-85937194
Fax +86-0851-85924943
Email [email protected]
Background: Metformin has been shown to inhibit the proliferation and migration of vascular wall cells. However, the mechanism through which metformin acts on atherosclerosis (AS) via the long non-coding RNA taurine up-regulated gene 1 (lncRNA TUG1) is still unknown. Thus, this research investigated the effect of metformin and lncRNA TUG1 on AS.
Methods: First, qRT-PCR was used to detect the expression of lncRNA TUG1 in patients with coronary heart disease (CHD). Then, the correlation between metformin and TUG1 expression in vitro and their effects on proliferation, migration, and autophagy in vascular wall cells were examined. Furthermore, in vivo experiments were performed to verify the anti-AS effect of metformin and TUG1 to provide a new strategy for the prevention and treatment of AS.
Results: qRT-PCR results suggested that lncRNA TUG1 expression was robustly upregulated in patients with CHD. In vitro experiments indicated that after metformin administration, the expression of lncRNA TUG1 decreased in a time-dependent manner. Metformin and TUG1 knockdown via small interfering RNA both inhibited proliferation and migration while promoted autophagy via the AMPK/mTOR pathway in vascular wall cells. In vivo experiments with a rat AS model further demonstrated that metformin and sh-TUG1 could inhibit the progression of AS.
Conclusion: Taken together, our data demonstrate that metformin might function to prevent AS by activating the AMPK/mTOR pathway via lncRNA TUG1.
Keywords: metformin, taurine up-regulated gene 1, AMPK/mTOR, autophagy, atherosclerosis
Introduction
Atherosclerosis (AS) is a chronic disease that can be caused by multiple factors. Autophagy has become a new research interest with the increased understanding of the pathogenesis of AS. Studies have shown that autophagy is closely related to cancer, neurodegenerative diseases, and cardiovascular diseases.1–3 The activation of autophagy in vascular wall cells can protect endothelial cells and smooth muscle cells from damage caused by risk factors and contribute to the stability of plaques, whereas the inhibition of autophagy can accelerate apoptosis, necrosis, and aging, thus making plaques more vulnerable.4
Long non-coding RNAs (lncRNAs) are a class of RNA molecules with a length of more than 200 nt that do not encode proteins.5,6 Recent studies have suggested that lncRNAs can participate in the onset and development of various types of cardiovascular diseases7,8 including heart failure, myocardial hypertrophy, heart metabolic disease, myocardial infarction, and AS. For example, the lncRNA NEXN-AS1 has been shown to mitigate AS by regulating activity of the actin-binding protein NEXN.9 The lncRNA taurine up-regulated gene 1 (TUG1) is located on chromosome 22q12.2 and has a length of 7.1 kb; it was originally identified in taurine-treated mouse retinal cells.10 Increasing evidence indicates that the dysregulation of TUG1 is involved in the development of a variety of diseases including cancer, ischemic stroke, and diabetes.11–14 However, there is limited knowledge on the function of TUG1 at the molecular level, as well as its exact role in AS.
AMP kinase (AMPK) is a key energy sensor that recognizes ATP in cells; it is activated by hepatic protein kinase B1 under conditions of starvation or energy consumption and is a negative regulator of mammalian target of rapamycin (mTOR). The inhibition of mTOR phosphorylation mediated by AMPK phosphorylation can induce autophagy in many different cell types.15,16 Metformin is a widely used antidiabetic drug used to treat patients with type 2 diabetes mellitus. Studies have shown that it can exert protective effects against cardiovascular diseases; specifically, metformin can activate autophagy and provide cardioprotective effects in δ-sarcoglycan-deficient hearts.17 Further, metformin represses cardiac apoptosis through inhibition of the Forkhead box O1 (FoxO1) pathway.18 In addition, clinical trials have shown that metformin has anti-AS properties,19–21 providing data for its potential use for the primary prevention of AS. However, the exact mechanism through which metformin inhibits AS via TUG1, and the mechanism associated with the TUG1-modulated activation of autophagy is currently unknown. Accordingly, the present study aimed to observe the correlation between metformin and TUG1 expression in vitro, as well as their effects on proliferation, migration, and autophagy in vascular wall cells. Then, in vivo experiments were performed to verify the anti-AS effect of metformin and TUG1 to provide a new strategy for the prevention and treatment of AS.
Materials and Methods
Cell Culture
Human umbilical vein endothelial cells (HUVECs) were purchased from the Xiangya Cell Bank of Central South University (Changsha, China). Cells were cultivated in RPMI1640 medium (Hyclone, UT, USA) supplemented with 10% fetal bovine serum (Biological Industries, Beit-Haemek, Israel) and 1% penicillin/streptomycin (Solarbio, Beijing, China) at 37 °C in an atmosphere containing 5% CO2.
Plasmid Construction and Transfection
TUG1 small interfering RNA (si-TUG1 #1, #2), siRNA negative control (si-NC), adeno-associated virus carrying TUG1 shRNA (sh-TUG1), and empty vector (sh-NC) were purchased from GenePharma (Shanghai, China). CRISPR/cas9 single guide RNA with TUG1 overexpression (sg-TUG1 #1, #2, #3) and the corresponding control (sg-NC) were purchased from Syngentech (Beijing, China). The sequences of siRNA/shRNA/sgRNA are listed in Table S1. Transfection was carried out using Lipofectamine 2000 (Invitrogen, Carlsbad, CA, USA) following the manufacturer’s protocol.
Clinical Blood Samples
Thirty-eight individuals (male, 22 cases; female, 16 cases; age, 50–75 years) without coronary heart disease (CHD) were enrolled as healthy controls. In addition, 35 cases (male, 24 cases; female, 11 cases; age, 50–75 years) of patients with CHD diagnosed by coronary angiography in Guizhou Provincial People’s Hospital (Guiyang, China) were enrolled from June 2018 to August 2018. The inclusion criterium was at least one major coronary artery showing more than 80% stenosis for patients with stable angina pectoris. The exclusion criteria were as follows: (1) unstable angina or myocardial infarction; (2) complicated with other organic heart diseases; (3) combined with severe liver disease, kidney diseases, familial hypercholesterolemia, malignant tumors, or inflammatory diseases. The study protocol was approved by the Human Ethics Committee Review Board at the Guizhou Provincial People’s Hospital. Oral informed consent was obtained from each patient (Ethics approval No (2019)068).
Cell Counting Kit-8 Assay
HUVECs were plated in 96-well culture plates (3 × 10³ cells/well) either immediately or 24 h after transfection. After treatment with different concentrations of metformin (Solarbio) for 24, 48, or 72 h, 10 μL of cell counting kit-8 (CCK-8) solution (Dojindo, Kumamoto, Japan) was added to each well and cells were incubated for 2 h at 37 °C. The absorbance at 450 nm was measured using a microplate reader (Bio-Tek, Winooski, VT, USA).
5-Ethynyl-2′-Deoxyuridine Assay
Cells were seeded in 96-well culture plates (3 × 10³ cells/well) and exposed to media with metformin or transfected with si-TUG1 for 48 h. Thereafter, cells were treated with 5-ethynyl-2′-deoxyuridine (EdU; Ribobio, Guangzhou, China) for 2 h at 37 °C. Then, cells were fixed and exposed to 1× Apollo reaction for 30 min and stained with Hoechst 33,342 for 30 min. Cells were visualized with a fluorescent microscope (100×; Olympus, Tokyo, Japan). The proliferation rate of cells was evaluated based on the proportion of EdU-positive nuclei (red) to blue nuclei.
Wound Healing Assay
Cells with or without transfection were cultured in 6-well culture plates. After reaching 90% confluence, the cells were scratched with a 200-µL pipette tip, washed with PBS, and cultured in low-serum 1640 medium. Wounds were observed under an inverted microscope (40×, Olympus) and photographed at different time points. ImageJ software (NIH, Bethesda, MD, USA) was used to measure the wound areas.
mRFP-GFP-LC3 Staining
Cells were cultured on confocal culture dishes and transfected with control vector or the mRFP-GFP-LC3 lentiviral vector (2.65 × 10⁸ PFU/mL, SyngenTech) for 48 h. Then, the cells were incubated with metformin or transfected with si-TUG1 for 24 h and fixed with 4% paraformaldehyde. The expression of monomeric red fluorescence protein (mRFP) and green fluorescence protein (GFP) was viewed under a laser scanning confocal microscope (630×, Carl Zeiss, Oberkochen, Germany).
Quantitative Real-Time Reverse Transcriptase PCR
RNA from peripheral blood according to the instructions of the kit (Bioteke, Beijing, China). Total RNA from cells/tissues was isolated with TRIzol reagent (Invitrogen), For quantitative reverse transcriptase PCR (qRT-PCR), 1000 ng total RNA was reverse-transcribed into first-strand cDNA using a PrimeScript RT Reagent Kit (Takara Bio, Shiga, Japan). RNA expression was examined by qRT-PCR using a Two Step SYBR PrimeScript RT-PCR Kit (Takara) with the Illumina P05775 system (Illumina, San Diego, CA, USA). The primer sequences used are listed as follows: lncRNA TUG1 (human): forward 5′-CCACTTTGTCACAAGAGAAGGC-3′, reverse 5′-CACAAATTCCCATCATTCCC-3′; lncRNA TUG1 (rat): forward 5′-TGCTGAAGTTGTTTGCCTGC-3′, reverse 5′-TCCTTGGTGGAATTGGGCAC-3′; GAPDH (human): forward 5′-TCACCATCTTCCCAGGAGCGAG-3′, reverse 5′-TGTCGCTGTTGAAGTCAGAG-3′; GAPDH (rat): forward 5′-GGTGAAGGTCGGTGTGAACG-3′ and reverse 5′-CCACTTTGTCACAAGAGAAGGC-3′. Relative gene expression was calculated using the 2−ΔΔCt method with GAPDH used as a normalization control.22
Western Blotting
Cells were lysed with RIPA buffer (Solarbio) supplemented with a complete protease inhibitor cocktail (KangChen, Shanghai, China) for 30 min on ice. Then, the cell debris was collected and centrifuged at 12,000 g for 15 min. The protein concentration was detected using the bicinchoninic acid (BCA) Protein assay kit (Beyotime, Beijing, China). Equal concentrations of protein extracts were separated by 8–12% SDS-PAGE and transferred to PVDF membranes. The membranes were then blocked with 5% nonfat milk for 2 h and incubated with primary antibodies against LC3II, P62, AMPK, mTOR, and ATG3 (1:1000, Abcam, Cambridge, UK), p-AMPK (Thr172) and p-mTOR (Ser2448) (1:1000, Cell Signal Technology, Danvers, MA, USA), and GAPDH (1:1000, Goodhere, Inc., Hangzhou, China) at 4 °C overnight. Subsequently, the membranes were incubated with HRP-conjugated secondary antibodies (1:5000; Cell Signaling Technology, Danvers, MA, USA) for 1.5 h at room temperature. An enhanced chemiluminescence kit (Millipore, Billerica, MA, USA) was used to visualize the blots, and protein bands were quantified using ImageJ software.
Laboratory Animals and Grouping
A total of 70 male Wistar rats weighing 170 ± 10 g were purchased from Changsha Tianqin Biotechnology Co., Ltd (License number: SCXK (Xiang) 2014–0011, Changsha, China). All animal experiments were approved by the Experimental Animal Ethics Committee of Guizhou Provincial People’s Hospital.
The rats were randomly divided into seven groups with 10 rats in each group as follows: control group (no AS), AS model group, sh-NC group, sh-TUG1 group, metformin group, metformin + sh-TUG1 group, and atorvastatin positive control group. Rats in the control group were fed a normal diet, whereas all other rats were fed a high-fat diet and vitamin D3 to induce AS (the composition of the rat diet is listed in Table S1) and was in accordance with the literature.23,24,25 Food was provided adlibitum. After allowing the rats to acclimatize for 30 days, 40 μL sh-TUG1 (1.1 × 10¹³ vector genomes/mL) or empty vector was injected through the sublingual vein of rats in the corresponding group. Furthermore, in the metformin group, rats were given 100 mg/kg/day metformin (Bristol-Myers Squibb, New York, USA) via intragastrical administration for 30 days. Rats in the atorvastatin positive control group were given 2.1 mg/kg/day atorvastatin (Jialin Pharmaceutical, Beijing, China) via intragastrical administration for 30 days. Except those of the control group, the other rats were maintained on a high-fat diet, and all rats were then sacrificed for further data analysis. All animal studies were approved by the Ethics Committee of Guizhou Provincial of People’s Hospital, and conformed to the Guide for Care and Use of Laboratory Animals by the National Institutes of Health (NIH).
Hematoxylin and Eosin Staining
To observe the changes in the aortic root tissue morphology, hematoxylin and eosin staining (H&E) was performed as follows. Tissues fixed in 4% paraformaldehyde were placed in decreasing concentrations of alcohol, cleared with xylene, dipped in wax, embedded in wax blocks, and sliced into 5-μm sections. Briefly, the sections were dewaxed, stained with hematoxylin followed by 1% hydrochloric acid alcohol, stained with eosin solution, dehydrated with a gradient alcohol series, and cleared with xylene. The slides were then observed using a microscope (40×, Olympus) to identify pathological changes.
Immunohistochemistry
Paraffin-embedded artery tissue sections were deparaffinized in xylene and rehydrated through a graded series of ethanol solutions (100–70%). Sections were heated in EDTA (Zsgb-bio, Beijing, China) for 15 min and incubated for 10 min in 3% H2O2. Thereafter, sections were blocked with 10% goat serum (Bioss, Beijing, China) for 30 min at 37 °C. The slides were then incubated separately with primary antibodies against LC3 or p62 (1:100, Proteintech, Wuhan, China) at 4 °C overnight. The next day, the IgG-HRP conjugated secondary antibody (Bioss) was added and samples were incubated for 1 h at room temperature, followed by the addition of 3, 3′-diaminobenzidine (DAB, Zsgb-bio) and hematoxylin counterstain. Tissues were then microscopically observed and photographed (200×, Olympus). DAB staining was analyzed by two pathologists as previously described.26
Statistical Analysis
Data were calculated as the mean from at least three independent experiments. Numerical data are presented as the mean ± SD. All statistical analyses were performed using GraphPad 7.0 software (GraphPad Software, Inc., La Jolla, CA, USA). When data obeyed normal distribution, Student’s t test was used to analyze difference between two groups, analysis of variance (ANOVA) was performed for three or more groups. When data did not obey normal distribution, Mann–Whitney was used to analyze difference between two groups. Kruskal–Wallis was used in animal experiment. A value of P < 0.05 was considered statistically significant.
Results
Expression Levels of TUG1 in Patients with CHD and in Cells Incubated with Metformin
To investigate the correlation between lncRNA TUG1 and AS, qRT-PCR was used to detect TUG1 expression in the peripheral blood of healthy controls and patients with CHD. The results suggested that TUG1 expression was robustly upregulated in patients with CHD, compared with that in healthy controls (Figure 1A). Then, cells were incubated with metformin (10 mmol/L) for 24, 48, or 72 h. As shown in Figure 1B, the expression of TUG1 was downregulated in a time-dependent manner.
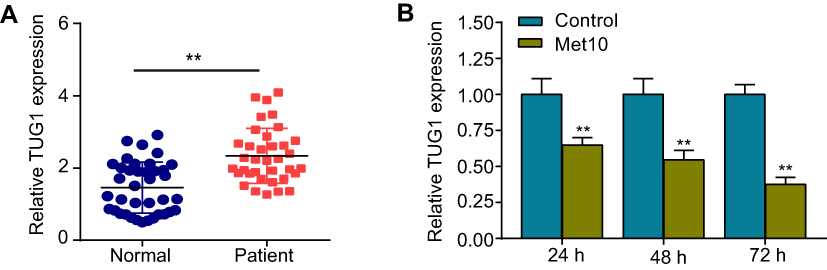 |
Figure 1 Expression levels of TUG1 in patients with coronary heart disease (CHD) and in cells incubated with metformin. Notes: (A) qRT-PCR was used to detect TUG1 expression in the peripheral blood of healthy controls (n = 38) and patients with CHD (n = 35). (B) Expression levels of TUG1 after HUVECs were incubated with metformin for 24, 48, or 72 h. Data are presented as the mean ± SD. **p < 0.01 vs the control group. Abbreviations: TUG1, taurine up-regulated gene 1; CHD, coronary heart disease; qRT-PCR, quantitative reverse transcription PCR; HUVECs, human umbilical vein endothelial cells; SD, standard deviation. |
Metformin Suppresses Proliferation and Migration while Induces Autophagy in HUVECs
First, HUVECs were incubated with metformin at different concentrations (0, 2, 5, 10, 15, or 20 mmol/L) for 24, 48, or 72 h. The CCK-8 assay results indicated that metformin had a concentration-and time-dependent inhibitory effect on cell growth in HUVECs (Figure 2A). A concentration of 10 mmol/L metformin effectively inhibited cell proliferation without causing changes in cell morphology; thus, 10 mmol/L was the drug concentration used for subsequent experiments. Furthermore, the EdU assay showed that cells incubated with metformin for 48 h showed significantly supressed proliferation ability compared with that of the control group (Figure 2B). Then, we performed a wound healing assay, the results showed that metformin could reduce HUVEC migration in a time-dependent manner (Figure 2C). To validate the autophagy-inducing effects of metformin on HUVECs, we transfected the cells with mRFP-GFP-LC3 lentivirus to observe LC3 dots. As shown in Figure 2D, the numbers of both yellow and red dots were markedly increased in metformin-treated HUVECs compared with those in the control group. Lastly, the cells were treated with metformin at different time points (0, 3, 6, 12, 24, 36 h), we found that it could downregulate the expression of p62 and increase the ratio of LC3II/LC3I (Figure 2E). Moreover, the changes in p62 expression and the LC3II/LC3I ratio were most prominent at 24 h; thus, we chose 24 h as the incubation time for subsequent Western blotting experiments.
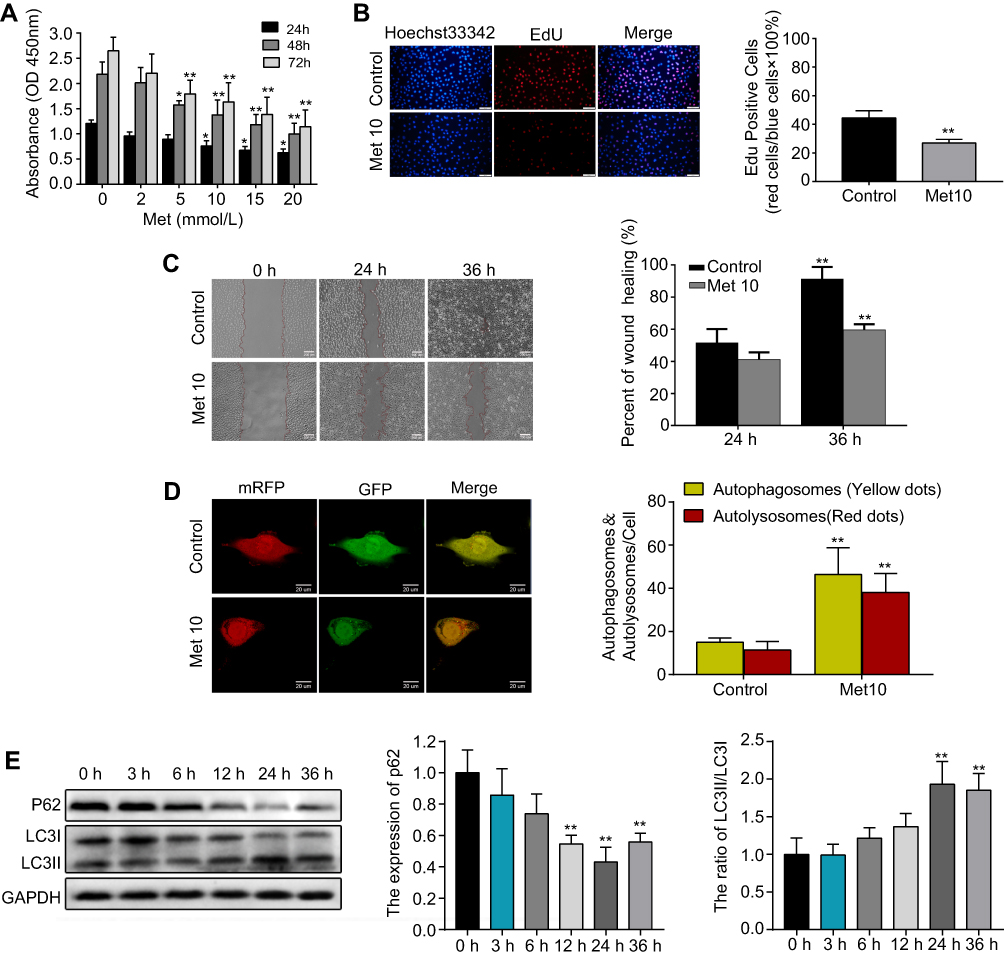 |
Figure 2 Metformin (Met) suppresses proliferation and migration while induces autophagy in HUVECs.Notes: (A) The CCK-8 and (B) EdU assays were performed to measure the proliferation of HUVECs treated with or without Met. (C) A wound healing assay was performed to analyze the effect of Met on the migration of HUVECs. (D) mRFP-GFP-LC3 staining was used to observe the induction of autophagosomes and autolysosomes by Met. (E) Western blotting was used to analyze the levels of p62 and LC3 at different time points after cells were treated with Met. Data are presented as the mean ± SD. *p < 0.05, **p < 0.01 vs the control group. Abbreviations: Met, Metformin; HUVECs, human umbilical vein endothelial cells; CCK-8, cell counting kit-8; EdU, 5-ethynyl-2′-deoxyuridine; SD, standard deviation. |
si-TUG1 Suppresses Proliferation and Migration while Induces Autophagy in HUVECs
Next, HUVECs were transfected with si-TUG1(#1, #2) to knock down the expression of TUG1. Following transfection, TUG1 expression decreased sharply in the si-TUG1 groups compared with that in the si-NC group (Figure 3A). Similar to the results of metformin treatment, we found that knockdown of TUG1 expression by siRNA inhibited proliferation (Figure 3B, C and F) and migration (Figure 3D and G), while promoted autophagy (Figure 3E, H and I) in HUVECs.
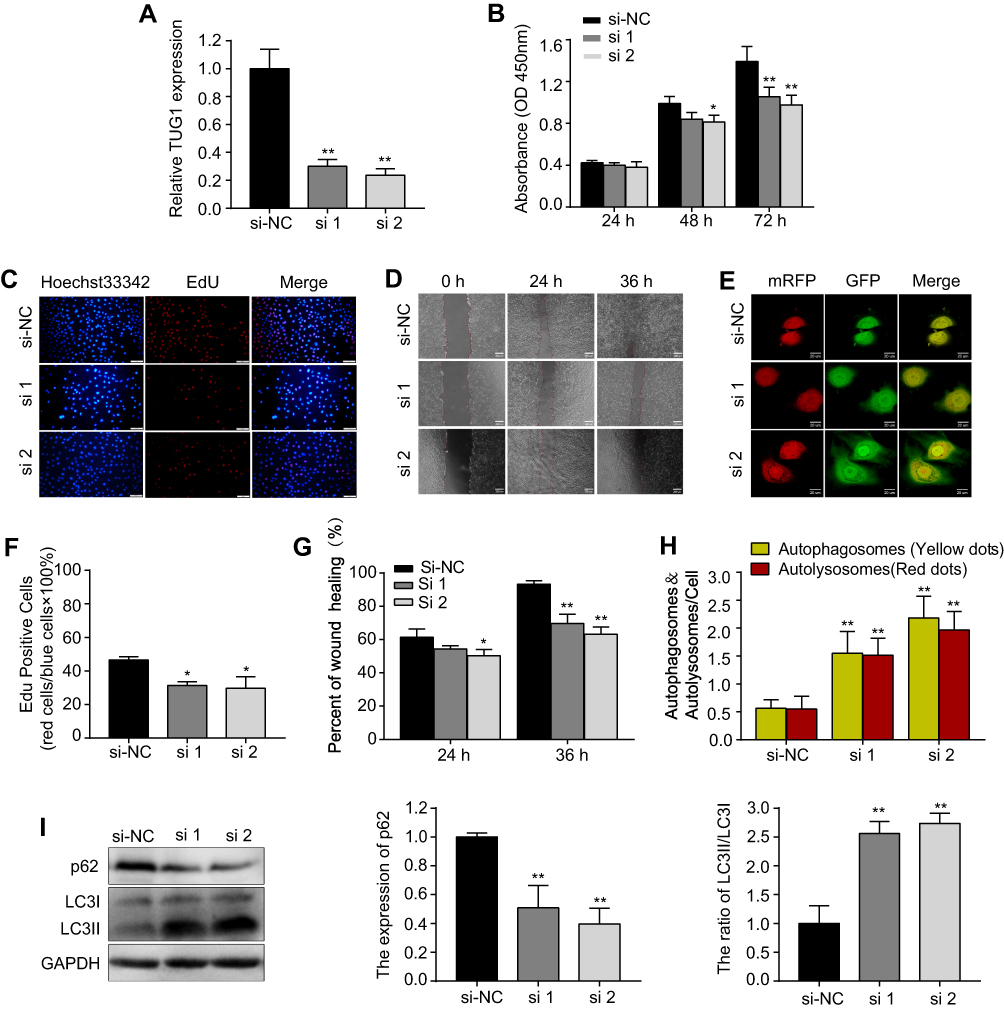 |
Figure 3 si-TUG1 suppresses proliferation and migration while induces autophagy in HUVECs. Notes: (A) Transfection efficiency of si-TUG1 (#1, #2). (B) The CCK-8 and (C and F) EdU assays were performed to determine the proliferation of HUVECs treated with or without si-TUG1. (D and G) A wound healing assay was performed to detect the effect of si-TUG1 on the migration ability of HUVECs. (E and H) mRFP-GFP-LC3 staining was used to observe the induction of autophagosomes and autolysosomes by si-TUG1. (I) Western blotting was used to analyze the levels of p62 and LC3 induced by si-TUG1. Data are presented as the mean ± SD. *p < 0.05, **p < 0.01 vs the si-NC group. Abbreviations: siRNA, small interfering RNA; TUG1, taurine up-regulated gene 1; HUVECs, human umbilical vein endothelial cells; CCK-8, cell counting kit-8; EdU, 5-ethynyl-2′-deoxyuridine; SD, standard deviation; NC, normal control. |
Metformin Activates the AMPK/mTOR Pathway in HUVECs via lncRNA TUG1
First, the transfection efficiency of TUG1 overexpression (OE #1, #2, #3) was measured by qRT-PCR (Figure 4A). OE #1 resulted in the greatest overexpression efficiency and was thus selected for subsequent experiments. Second, we found that metformin could increase the expression of p-AMPK/AMPK, ATG3, and LC3II/LC3I and decrease the expression of p-mTOR/mTOR and p62 (Figure 4B–G). In addition, the effects of metformin on the AMPK/mTOR pathway were partially reversed by OE #1 transfection. Third, CCK-8 and wound healing assays were conducted (Figure 4H and I); here, OE #1 obviously reversed the metformin-induced effects on proliferation and migration.
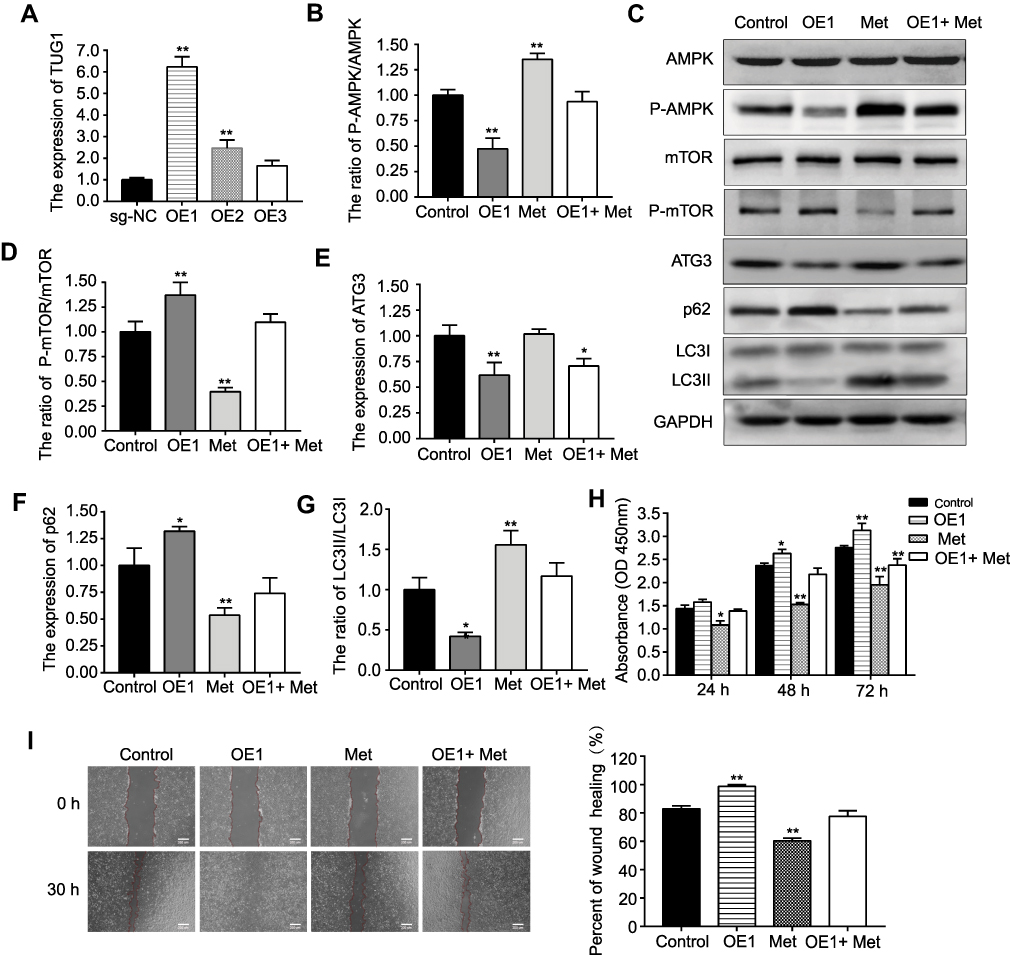 |
Figure 4 Metformin (Met) activates the AMPK/mTOR pathway in HUVECs via lncRNA TUG1.Notes: (A) Transfection efficiency of sg-TUG1 (OE #1,#2,#3). (C) Western blotting was used to detect (B) p-AMPK/AMPK, (D) p-mTOR/mTOR, (E) ATG3, (F) p62, and (G) LC3II/LC3I protein levels after cells were incubated with Met or transfected with OE#1. (H) CCK-8 and (I) wound healing assays were performed to determine the cell viability and migration ability, respectively, after cells were incubated with Met or transfected with OE #1. Data are presented as the mean ± SD. *p < 0.05, **p < 0.01 vs the control group.Abbreviations: Met, metformin; HUVECs, human umbilical vein endothelial cells; lncRNA, long non-coding RNA; TUG1, taurine up-regulated gene 1; sg-TUG1, single guide taurine up-regulated gene 1; OE, overexpression; CCK-8, cell counting kit-8; SD, standard deviation. |
si-TUG1 Induces Autophagy in HUVECs via the AMPK/mTOR Pathway
Western blotting was then used to detect the protein levels of AMPK, p-AMPK, mTOR, p-mTOR, ATG3, p62, and LC3 after cells were transfected with si-TUG1 (#2, 50 nm). si-TUG1 (#2) resulted in better knockdown efficiency and was thus selected for subsequent experiments. As expected, the expression of p-AMPK/AMPK, ATG3, and LC3II/LC3I was upregulated, whereas that of p-mTOR/mTOR and p62 was downregulated by si-TUG1 (Figure 5A–F). However, the effect of si-TUG1 on the AMPK/mTOR pathway was reversed by treatment with Compound C (C.C, 50 μmol/L, an AMPK inhibitor), which suggested that TUG1 knockdown could activate the AMPK/mTOR pathway in HUVECs. In addition, as shown in Figure 5G and H, C.C reversed the effects on proliferation and migration induced by si-TUG1. Figure 5I shows the technical rote of metformin and lncRNA TUG1 in AS.
 |
Figure 5 si-TUG1 induces autophagy in HUVECs via the AMPK/mTOR pathway. Notes: (A) Western blotting was used to detect (B) p-AMPK/AMPK, (C) p-mTOR/mTOR, (D) ATG3, (E) p62, and (F) LC3II/LC3I protein levels after cells were transfected with si-TUG1 or incubated with Compound C (C,C). (G) CCK-8 and (H) wound healing assay were performed to measure the cell viability and migration ability, respectively, after cells were transfected with si-TUG1 or incubated with C,C. (I) The technical rote of metformin and lncRNA TUG1 in atherosclerosis (AS). Data are presented as the mean ± SD. *p < 0.05, **p < 0.01 vs the control group. Abbreviations: siRNA, small interfering RNA; TUG1, taurine up-regulated gene 1; HUVECs, human umbilical vein endothelial cells; CCK-8, cell counting kit-8; lncRNA, long non-coding RNA; SD, standard deviation. |
Anti-AS Effects of Metformin and lncRNA TUG1 in vivo
Finally, we assessed the effects of metformin and lncRNA TUG1 in the AS rat model. Histopathological changes were observed through H&E staining, and aortic root lesion sizes were significantly decreased in the metformin and sh-TUG1 groups compared with those in the AS model or empty vector group, demonstrating that metformin and sh-TUG1 have protective effects on high-fat diet-induced AS injury (Figure 6A and C). Immunohistochemistry was then used to detect the expression of autophagy-related proteins. Compared with that in the control group, the expression of p62 increased, whereas that of LC3 decreased, in the model and sh-NC groups. Furthermore, compared with levels in the model or sh-NC group, p62 was downregulated, whereas LC3 was upregulated, in the metformin, sh-TUG1, metformin + sh-TUG1, and atorvastatin groups (Figure 6B and D). Through qRT-PCR, we demonstrated that compared with that in the control group, the expression of TUG1 was increased in the model group and sh-NC group. Additionally, compared with those in the model or sh-NC group, the levels of TUG1 were decreased in the metformin, sh-TUG1, and metformin + sh-TUG1 groups (Figure 6E). Western blotting indicated that compared with that in the control group, the ratio of p-mTOR/mTOR was increased in the model or sh-NC group. Further, compared with that in the model or sh-NC group, the ratio of p-AMPK/AMPK was increased, whereas that of p-mTOR/mTOR was decreased, in the metformin, sh-TUG1, metformin + sh-TUG1, and atorvastatin groups (Figure 6F).
 |
Figure 6 Anti-atherosclerosis (AS) effects of metformin and lncRNA TUG1 in vivo. Notes: (A and C) The histopathological changes in the aortic root of rats in each group were observed by H&E staining. (B and D) Immunohistochemistry was performed to detect the expression of autophagy-related proteins p62 and LC3. (E) The expression of TUG1 in each group was measured by qRT-PCR. (F)The expression levels of proteins related to the AMPK/mTOR pathway in each group were measured by Western blotting. Data are presented as the mean ± SD. *p < 0.05, **p < 0.01 vs the control group. #p < 0.05, ##p < 0.01 vs the model group. &p < 0.05, &&p < 0.01 vs the sh-NC group.Abbreviations: lncRNA, long non-coding RNA; TUG1, taurine up-regulated gene 1; H&E staining, hematoxylin and eosin staining; qRT-PCR, quantitative reverse transcription PCR; SD, standard deviation; NC, normal control. |
Discussion
Atherosclerotic diseases such as CHD remain the leading cause of death worldwide; the lifetime risk of CHD is 67% in humans over 55 years of age.27–29 Studies have shown that lncRNAs are vital regulatory factors in the progression of AS.30–32 Thus, defining their functions might help to identify novel diagnostic and therapeutic targets for AS. In this study, we found that lncRNA TUG1 was significantly upregulated in the peripheral blood of patients with CHD compared with healthy individuals. This indicates that lncRNA TUG1 may promote CHD progression.
Autophagy is the process through which cytoplasmic components such as proteins and organelles that need to be degraded are encapsulated and eventually transported to the lysosomes for degradation. Studies have shown that autophagy inhibits the progression of AS, whereas defective autophagy in vascular wall cells enhances its progression.33,34 In this study, we found that metformin and si-TUG1 reduced the proliferation and migration of HUVECs. There is a strong connection between autophagy and vascular wall cell proliferation/migration in AS. Research has suggested that autophagy defects in vascular smooth muscle cells might induce cell proliferation and migration, leading to the acceleration of AS progression.35 However, the upregulation of autophagy in vascular wall cells is known to reduce proliferation and inhibit fibrosis.36
Markers involved in autophagy are classified as autophagy-related genes (ATGs), and approximately 30 ATGs are known to participate in different stages of autophagy,37–39 including Beclin-1, ATG3, ATG5, ATG7, ATG8, and ATG12.40 During autophagy, LC3I is converted to LC3II and p62 enters the autophagosome to be degraded; thus, the LC3II/I ratio and p62 are commonly used as indicators of autophagy.41,42 To explore the effect of TUG1 on autophagy, we measured the levels of autophagy-related proteins and several major signaling pathways. We found that the expression of p-mTOR/mTOR and p62 was reduced when TUG1 was knocked down, whereas that of p-AMPK/AMPK and LC3II/LC3I was elevated, which was accompanied by an increase in ATG3 expression. C.C, which acts through the specific inhibition of p-AMPK in the AMPK/mTOR pathway, is recognized as an autophagy inhibitor. We found that the changes in protein expression induced by si-TUG1 could be reversed by C.C; at the same time, C.C successfully reversed the changes in proliferation and migration mediated by si-TUG1. These data suggest that si-TUG1 activates autophagy via the AMPK/mTOR pathway to suppress proliferation and migration.
It has been reported that metformin can be used to treat diseases through the regulation of lncRNA expression.43,44 Because metformin was found to attenuate TUG1 expression in a time-dependent manner in the present study, we further investigated its correlation with TUG1 expression. The results indicated that metformin activates autophagy via lncRNA TUG1 in HUVECs.
Finally, we established an AS rat model. As expected, immunohistochemistry and Western blotting in the metformin and sh-TUG1 groups were consistent with the results of our in vitro experiments. Interestingly, immunohistochemistry showed an increase in the expression of p62 and a decrease in that of LC3 in the AS model group compared with levels in the control group, indicating that autophagy was somewhat disrupted in rats of the AS model group. Furthermore, we found that atorvastatin treatment activated the AMPK/mTOR pathway; however, to the best of our knowledge, the role of atorvastatin in preventing AS via the AMPK/mTOR pathway has not yet been reported.
Conclusion
In summary, we provide clear evidence that metformin attenuates the progression of AS via lncRNA TUG1. This study not only expands our understanding of the role of metformin in preventing AS, but also provides new perspectives into its molecular mechanisms. TUG1 is also suggested to be potential a therapeutic target for the prevention of AS.
Acknowledgments
This work was supported by the Science Technology Platform and Talent Team Plan Projects in Guizhou Province (Grant 20175405); High-level Innovation Talents Training Program in Guizhou Province (Grant 20164023).
Disclosure
The authors declare no conflicts of interest in this work.
References
1. Rebecca VW, Amaravadi RK. Emerging strategies to effectively target autophagy in cancer. Oncogene. 2016;35(1):1–11. doi:10.1038/onc.2015.99
2. Deng Z, Purtell K, Lachance V, et al. Autophagy receptors and neurodegenerative diseases. Trends in Cell Biology. 2017;27(7):491–504. doi:10.1016/j.tcb.2017.01.001
3. Bravo-San Pedro JM, Kroemer G, Galluzzi L. Autophagy and mitophagy in cardiovascular disease. Circ Res. 2017;120(11):1812–1824. doi:10.1161/CIRCRESAHA.117.311082
4. Schrijvers DM, de Meyer GR, Martinet W. Autophagy in atherosclerosis: a potential drug target for plaque stabilization. Arterioscler Thromb Vasc Biol. 2011;31(12):2787–2791. doi:10.1161/ATVBAHA.111.224899
5. Martianov I, Ramadass A, Serra Barros A, et al. Repression of the human dihydrofolate reductase gene by a non-coding interfering transcript. Nature. 2007;445(7128):666–670. doi:10.1038/nature05519
6. Quinn JJ, Chang HY. Unique features of long non-coding RNA biogenesis and function. Nat Rev Genet. 2016;17(1):47–62. doi:10.1038/nrg.2015.10
7. Viereck J, Thum T. Circulating noncoding RNAs as biomarkers of cardiovascular disease and injury. Circ Res. 2017;120(2):381–399. doi:10.1161/CIRCRESAHA.116.308434
8. Uchida S, Dimmeler S. Long noncoding RNAs in cardiovascular diseases. Circ Res. 2015;116(4):737–750. doi:10.1161/CIRCRESAHA.116.302521
9. Hu YW, Guo FX, Xu YJ, et al. Long noncoding RNA NEXN-AS1 mitigates atherosclerosis by regulating the actin-binding protein NEXN. J Clin Invest. 2019;129(3):1115–1128. doi:10.1172/JCI98230
10. Young TL, Matsuda T, Cepko CL. The noncoding RNA taurine upregulated gene 1 is required for differentiation of the murine retina. Curr Biol. 2005;15(6):501–512. doi:10.1016/j.cub.2005.02.027
11. He C, Liu Z, Jin L, et al. lncRNA TUG1-mediated mir-142-3p downregulation contributes to metastasis and the epithelial-to-mesenchymal transition of hepatocellular carcinoma by targeting ZEB1. Cell Physiol Biochem. 2018;48(5):1928–1941. doi:10.1159/000492517
12. Sun J, Hu J, Wang G, et al. LncRNA TUG1 promoted KIAA1199 expression via miR-600 to accelerate cell metastasis and epithelial-mesenchymal transition in colorectal cancer. J Exp Clin Cancer Res. 2018;37(1):106–116. doi:10.1186/s13046-018-0771-x
13. Bao MH, Szeto V, Yang BB, et al. Long non-coding RNAs in ischemic stroke. Cell Death Differ. 2018;9(3):281–293. doi:10.1038/s41419-018-0282-x
14. Long J, Badal SS, Ye Z, et al. Long noncoding RNA Tug1 regulates mitochondrial bioenergetics in diabetic nephropathy. J Clin Invest. 2016;126(11):4205–4218. doi:10.1172/JCI87927
15. Yu C, Li WB, Liu JB, et al. Autophagy: novel applications of nonsteroidal anti-inflammatory drugs for primary cancer. Cancer Med. 2018;7(2):471–484. doi:10.1002/cam4.1287
16. Chapuis N, Tamburini J, Green AS, et al. Perspectives on inhibiting mTOR as a future treatment strategy for hematological malignancies. Leukemia. 2010;24(10):1686–1699. doi:10.1038/leu.2010.170
17. Kanamori H, Naruse G, Yoshida A, et al. Metformin enhances autophagy and provides cardioprotection in δ-Sarcoglycan deficiency-induced dilated cardiomyopathy. Circ Heart Fail. 2019;12(4):e005418. doi:10.1161/CIRCHEARTFAILURE.118.005418
18. Loi H, Boal F, Tronchere H, et al. Metformin protects the heart against hypertrophic and apoptotic remodeling after myocardial infarction. Front Pharmacol. 2019;10:154–159. doi:10.3389/fphar.2019.00154
19. Goldberg RB, Aroda VR, Bluemke DA, et al. Effect of long-term metformin and lifestyle in the diabetes prevention program and its outcome study on coronary artery calcium. Circulation. 2017;136(1):52–64. doi:10.1161/CIRCULATIONAHA.116.025483
20. Anholm C, Kumarathurai P, Pedersen LR, et al. Liraglutide in combination with metformin may improve the atherogenic lipid profile and decrease C-reactive protein level in statin treated obese patients with coronary artery disease and newly diagnosed type 2 diabetes: A randomized trial. Atherosclerosis. 2019;288:60–66. doi:10.1016/j.atherosclerosis.2019.07.007
21. Natali A, Nesti L, Venturi E, et al. Metformin is the key factor in elevated plasma growth differentiation factor-15 levels in type 2 diabetes: A nested, case-control study. Diabetes Obes Metab. 2019;21(2):412–416. doi:10.1111/dom.13519
22. Livak KJ, Schmittgen TD. Analysis of relative gene expression data using real-time quantitative PCR and the 2(-Delta Delta C(T)) method. Methods. 2001;25(4):402–408. doi:10.1006/meth.2001.1262
23. Fu Y, Sun S, Sun H, et al. Scutellarin exerts protective effects against atherosclerosis in rats by regulating the Hippo-FOXO3A and PI3K/AKT signaling pathways. J Cell Physiol. 2019;234(10):18131–18145. doi:10.1002/jcp.28446
24. Diao S, Sun J, Ma B, et al. Influence of crocetin on high-cholesterol diet induced atherosclerosis in rats via anti-oxidant activity together with inhibition of inflammatory response and p38 MAPK signaling pathway. Saudi J Biol Sci. 2018;25(3):493–499. doi:10.1016/j.sjbs.2016.11.005
25. Mo J, Yang R, Li F, et al. Scutellarin protects against vascular endothelial dysfunction and prevents atherosclerosis via antioxidation. Phytomedicine. 2018;42:66–74. doi:10.1016/j.phymed.2018.03.021
26. Long M, Tao S, Rojo de la Vega M, et al. Nrf2-dependent suppression of azoxymethane/dextran sulfate sodium-induced colon carcinogenesis by the cinnamon-derived dietary factor cinnamaldehyde. Cancer Prev Res (Phila). 2015;8(5):444–454. doi:10.1158/1940-6207.CAPR-14-0359
27. Global Burden of Metabolic Risk Factors for Chronic Diseases Collaboration (BMI Mediated Effects), Lu Y, Hajifathalian K, et al. Metabolic mediators of the effects of body-mass index, overweight, and obesity on coronary heart disease and stroke: a pooled analysis of 97 prospective cohorts with 1.8 million participants. Lancet. 2014;383(9921):970–983. doi:10.1016/S0140-6736(13)61836-X
28. Yang L, Liu Y, Wang S, et al. Association between Lp-PLA2 and coronary heart disease in Chinese patients. J Int Med Res. 2017;459(1):159–169. doi:10.1177/0300060516678145
29. Berry C, Corcoran D, Hennigan B, et al. Fractional flow reserve-guided management in stable coronary disease and acute myocardial infarction: recent developments. Eur Heart J. 2015;36(45):3155–3164. doi:10.1093/eurheartj/ehv206
30. Zhu Y, Yang T, Duan J, et al. MALAT1/miR-15b-5p/MAPK1 mediates endothelial progenitor cells autophagy and affects coronary atherosclerotic heart disease via mTOR signaling pathway. Aging (Albany NY). 2019;11(4):1089–1109. doi:10.18632/aging.101766
31. Ye ZM, Yang S, Xia YP, et al. LncRNA MIAT sponges miR-149-5p to inhibit efferocytosis in advanced atherosclerosis through CD47 upregulation. Cell Death Dis. 2019;10(2):138–153. doi:10.1038/s41419-019-1409-4
32. Cremer S, Michalik KM, Fischer A, et al. Hematopoietic deficiency of the long noncoding RNA MALAT1 promotes atherosclerosis and plaque inflammation. Circulation. 2019;139(10):1320–1334. doi:10.1161/CIRCULATIONAHA.117.029015
33. Osonoi Y, Mita T, Azuma K, et al. Defective autophagy in vascular smooth muscle cells enhances cell death and atherosclerosis. Autophagy. 2018;14(11):1991–2006. doi:10.1080/15548627.2018.1501132
34. Xiong Y, Yepuri G, Forbiteh M, et al. ARG2 impairs endothelial autophagy through regulation of MTOR and PRKAA/AMPK signaling in advanced atherosclerosis. Autophagy. 2014;10(12):2223–2238. doi:10.4161/15548627.2014.981789
35. Grootaert MO, da Costa Martins PA, Bitsch N, et al. Defective autophagy in vascular smooth muscle cells accelerates senescence and promotes neointima formation and atherogenesis. Autophagy. 2015;11(11):2014–2032. doi:10.1080/15548627.2015.1096485
36. Wei YM, Li X, Xu M, et al. Enhancement of autophagy by simvastatin through inhibition of Rac1-mTOR signaling pathway in coronary arterial myocytes. Cell Physiol Biochem. 2013;31(6):925–937. doi:10.1159/000350111
37. Jain K, Paranandi KS, Sridharan S, et al. Autophagy in breast cancer and its implications for therapy. Am J Cancer Res. 2013;3(3):251–265.
38. Kondratskyi A, Yassine M, Kondratska K, et al. Calcium-permeable ion channels in control of autophagy and cancer. Front Physiol. 2013;4:272–284. doi:10.3389/fphys.2013.00272
39. Shimizu S, Yoshida T, Tsujioka M, et al. Autophagic cell death and cancer. Int J Mol Sci. 2014;15(2):3145–3153. doi:10.3390/ijms15023145
40. Chen YJ, Chi CW, Su WC, et al. Lapatinib induces autophagic cell death and inhibits growth of human hepatocellular carcinoma. Oncotarget. 2014;5(13):4845–4854. doi:10.18632/oncotarget.2045
41. Klionsky DJ, Abdelmohsen K, Abe A, et al. Guidelines for the use and interpretation of assays for monitoring autophagy (3rd edition). Autophagy. 2016;12(1):1–222. doi:10.1080/15548627.2015.1100356
42. Mizushima N, Yoshimori T, Levine B. Methods in mammalian autophagy research. Cell. 2010;140(3):313–326. doi:10.1016/j.cell.2010.01.028
43. Yan L, Zhou J, Gao Y, et al. Regulation of tumor cell migration and invasion by the H19/let-7 axis is antagonized by metformin-induced DNA methylation. Oncogene. 2015;34(23):3076–3084. doi:10.1038/onc.2014.236
44. Wu P, Tang Y, Fang X, et al. Metformin suppresses hypopharyngeal cancer growth by epigenetically silencing long non-coding RNA SNHG7 in FaDu Cells. Front Pharmacol. 2019;10:143–153. doi:10.3389/fphar.2019.00143
 © 2020 The Author(s). This work is published and licensed by Dove Medical Press Limited. The
full terms of this license are available at https://www.dovepress.com/terms
and incorporate the Creative Commons Attribution
- Non Commercial (unported, 3.0) License.
By accessing the work you hereby accept the Terms. Non-commercial uses of the work are permitted
without any further permission from Dove Medical Press Limited, provided the work is properly
attributed. For permission for commercial use of this work, please see paragraphs 4.2 and 5 of our Terms.
© 2020 The Author(s). This work is published and licensed by Dove Medical Press Limited. The
full terms of this license are available at https://www.dovepress.com/terms
and incorporate the Creative Commons Attribution
- Non Commercial (unported, 3.0) License.
By accessing the work you hereby accept the Terms. Non-commercial uses of the work are permitted
without any further permission from Dove Medical Press Limited, provided the work is properly
attributed. For permission for commercial use of this work, please see paragraphs 4.2 and 5 of our Terms.