Back to Journals » Diabetes, Metabolic Syndrome and Obesity » Volume 14
Metabolomic Signature Between Metabolically Healthy Overweight/Obese and Metabolically Unhealthy Overweight/Obese: A Systematic Review
Authors Cheng D, Zhao X, Yang S ![]() , Cui H, Wang G
, Cui H, Wang G
Received 3 December 2020
Accepted for publication 28 January 2021
Published 4 March 2021 Volume 2021:14 Pages 991—1010
DOI https://doi.org/10.2147/DMSO.S294894
Checked for plagiarism Yes
Review by Single anonymous peer review
Peer reviewer comments 2
Editor who approved publication: Prof. Dr. Juei-Tang Cheng
Dihe Cheng, Xue Zhao, Shuo Yang, Haiying Cui, Guixia Wang
Department of Endocrinology and Metabolism, The First Hospital of Jilin University, Changchun, 130021, People’s Republic of China
Correspondence: Guixia Wang
Department of Endocrinology and Metabolism, The First Hospital of Jilin University, Changchun, 130021, People’s Republic of China
Tel +15843081103
Email [email protected]
Abstract: The clinical manifestations of overweight/obesity are heterogeneous and complex. In contrast to metabolically unhealthy overweight/obese (MUO), a particular sub-group of obese patients who are considered as metabolically healthy overweight/obese (MHO), display favorable metabolic profiles characterized by high levels of insulin sensitivity, normal blood pressure, as well as favorable lipid, inflammation, hormone, liver enzyme, and immune profiles. While only a few available studies focused on the metabolic files underlying the obese phenotypes, the current review aimed to perform a systematic review of available studies focusing on describing the metabolomic signature between MUO and MHO. We did the systematic search for literature on MEDLINE (PubMed), the Cochrane Library, EMBASE, and searched for the references of relevant manuscripts from inception to 29 May 2020. After critical selection, 20 studies were eligible for this systematic review and evaluated by using QUADOMICS for quality assessment. Eventually, 12 of 20 studies were classified as “high quality”. Branched-chain amino acids (isoleucine, leucine, and valine), aromatic amino acids (phenylalanine and tyrosine), lipids (palmitic acid, palmitoleic acid, oleic acid, eicosapentaenoic acid, and docosahexaenoic acid), and acylcarnitines (propionyl carnitine) levels might be elevated in MUO. The current results suggested that MHO showed a favorable trend in the overall metabolic signature. More longitudinal studies are needed to elaborate deeply on the metabolic pathway and the relationship between metabolic patterns and the occurrence of the disease.
Keywords: metabolically unhealthy overweight/obese, metabolically healthy overweight/obese, metabolomics, amino acid, lipid
Introduction
Obesity is defined as an excess of body fat and alters the state of metabolism and physiology leading to an increased risk of all-cause mortality, especially cardiovascular disease and type 2 diabetes mellitus.1,2 Additionally, obese individuals are more likely to suffer cancer, asthma, gallbladder disease, osteoarthritis, and chronic pain.3 It is estimated that more than 1.9 billion adults are overweight and 650 million are obese throughout the world, and approximately 2.8 million deaths were reported as a result of overweight or obese.4 Hence, overweight/obesity represents a major public health concern in both developing and developed countries.
However, the clinical manifestations of overweight/obesity are heterogeneous and complex. In contrast to metabolically unhealthy overweight/obese (MUO), a particular sub-group of obese patients who are considered as metabolically healthy overweight/obese (MHO), display favorable metabolic profiles characterized by high levels of insulin sensitivity, normal blood pressure, as well as favorable lipid, inflammation, hormone, liver enzyme, and immune profiles.5 Currently, there are still no unique criteria to define metabolic health, resulting in the prevalence of the MHO phenotype widely varying. The prevalence estimates (6 to 75%) depends on which criteria are used and some socio-demographic variables such as gender, age, and race/ethnicity.6 Several previous studies have indicated that the MHO group is at a lower risk of type 2 diabetes mellitus (T2DM), cardiovascular disease, and mortality compared with the MUO group.7,8 Paradoxically, there are also studies reporting inconsistent results that the MHO phenotype is not protected from obesity-related metabolic complications relative to other phenotypes.9–11
Modern metabolomics is a comprehensive and systematic identification and quantification of small molecular weight metabolites (<1500 Da) in biological samples at a given point of time.12 The metabolome represents a set of all metabolites present in cell, tissue, organ, or organism at a given time and can capture the dynamic physiological conditions corresponding to the clinical outcomes of interest. Nuclear magnetic resonance (NMR) and mass spectrometry (MS), coupled with different separation techniques, dominate in metabolomics research.12 The potential use of metabolomics in the biomedical field is the discovery of new biomarkers for prognosis and/or diagnosis of diseases, such as obesity, diabetes, metabolic syndrome.13–15 Our previous work showed metabolomics profiles might be useful biomarkers and predictors for childhood obesity and diabetic kidney disease.16,17
Even though the concept of MHO remains controversial, a profound understanding of the underlying metabolic regulation between the MHO and the MUO is necessary to enhance the current knowledge of the development and regulation pathways of different overweight/obesity-related metabolic profiles, and to optimize prevention and treatment strategies. Recent literature on metabolic signature in overweight/obesity mainly focused on the comparisons between normal weight and overweight/obese individuals and only a few studies focused on the metabolic profiles underlying the different overweight/obese phenotypes. Thus, the current work aimed to perform a systematic review of available studies focusing on describing the metabolomic signature between MUO and MHO.
Methods
Literature Search Strategy
We did the systematic search for papers on MEDLINE (PubMed), the Cochrane Library, EMBASE and searched for the references of relevant manuscripts. Studies were identified in the databases by applying a publication date of 29 May 2020, using the following relevant keywords: “metabolic healthy” OR “metabolically healthy” OR “metabolic benign” OR “metabolically benign” OR “metabolic syndrome” AND “body mass index” OR “overweight” OR “obesity” OR “adiposity” OR “obese” AND “metabolomics” OR “metabolome” OR “mass spectrometry” OR “magnetic resonance spectroscopy” OR “metabolic signature” OR “metabolomic profiles”.
During this process, two independent investigators (Dihe Cheng and Xue Zhao) finished this work to reduce selection bias. If there were disputes, a third investigator (G. Wang) joined in to resolve the disagreements.
Inclusion and Exclusion Criteria
Studies were considered eligible for the following inclusion criteria: (1) were conducted in the human population; (2) focused on biomarkers for metabolic healthy overweight/obese and metabolic unhealthy overweight/obese; (3) metabolic health overweight/obese was used as the control group, and there were two ways to define metabolically healthy overweight/obese: (i) metabolically healthy overweight/obese was clearly defined in the literature included or (ii) the included literature did not define metabolic health overweight/obese, but did define overweight/obese without metabolic syndrome. Overweight/obesity without metabolic syndrome was also considered as metabolically healthy overweight/obesity in the current systematic review; (4) stratified subjects according to body mass index (BMI) categories or defined overweight/obesity; (5) utilized a metabolomics approach, such as MS, NMR spectroscopy, or ultrahigh pressure liquid chromatography mass spectrometry (UPLC-MS); (6) the types of studies were observational, including cross-sectional, cohort, and case-control studies; (7) only papers published in English were included. Studies were excluded if they were categorized as animal studies, editorials, literature reviews, case reports, and conference abstracts.
Data Extraction and Analysis
From each study, we extracted the following information: authors, year of publication, country, population (tissue), study design, platform, sample size, participant characteristics, and significant findings. During this process, two independent investigators (Dihe Cheng and Shuo Yang) finished this work to reduce selection bias. Due to the high heterogeneity in study population characteristics, platforms, analysis methods, and outcomes, a quantitative meta-analysis could not be implemented.
Quality Assessment
We evaluated the quality of the studies independently and in duplicate based on QUADOMICS.18,19 QUADOMICS is an adaptation of QUADAS to the special nature of ‘-omics’-based diagnostic research including in systematic reviews. Points were summed (up to 1 point per criterion), and studies with scores 0–10 were considered as “low quality”, while scores 11–16 were considered as “high quality”.
Results
Literature Search and Study Characteristics
The process for the selection of studies according to the PRISMA statement was shown in Figure 1. Initially, among the 2746 abstracts and titles reviewed, 2723 were excluded. After retrieved 23 full-text articles, 19 of them were included in our present systematic review.
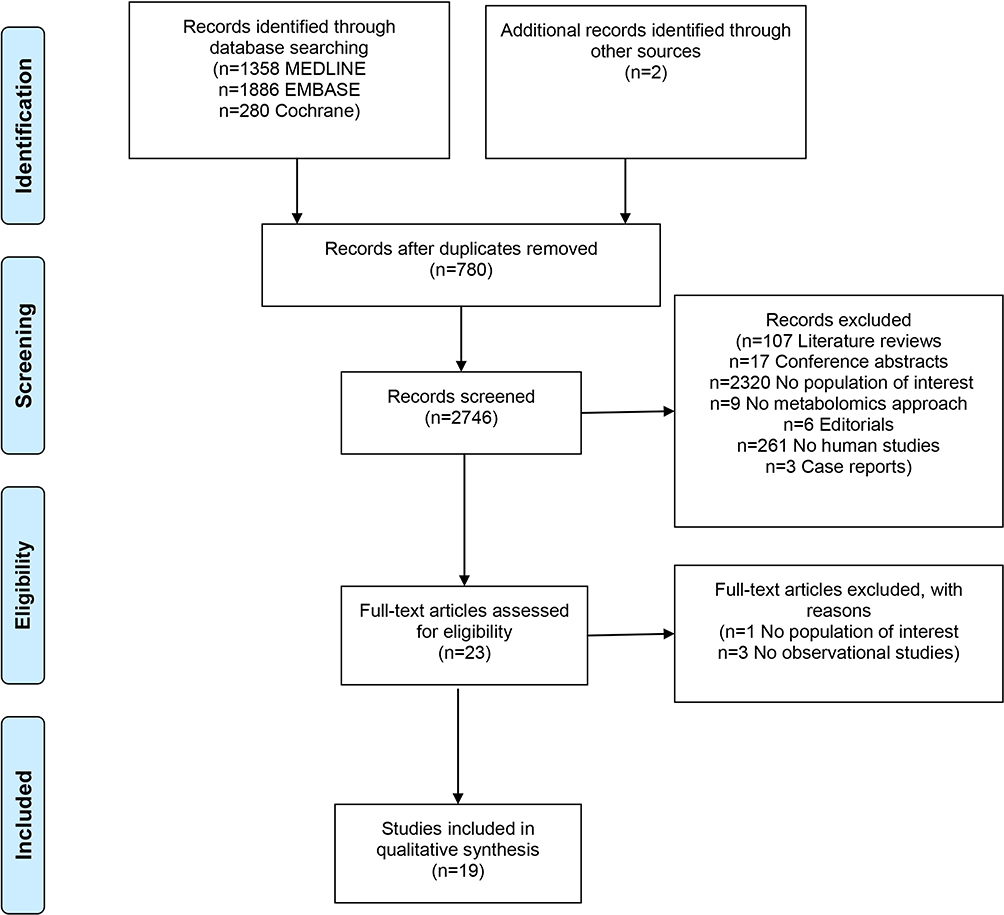 |
Figure 1 PRISMA flow diagram of this systematic review.Note: Adapted from Moher D, Liberati A, Tetzlaff J, Altman DG, The PRISMA Group (2009). Preferred Reporting Items for Systematic Reviews and Meta-Analyses: The PRISMA Statement. PLoS Med 6(7): e1000097. |
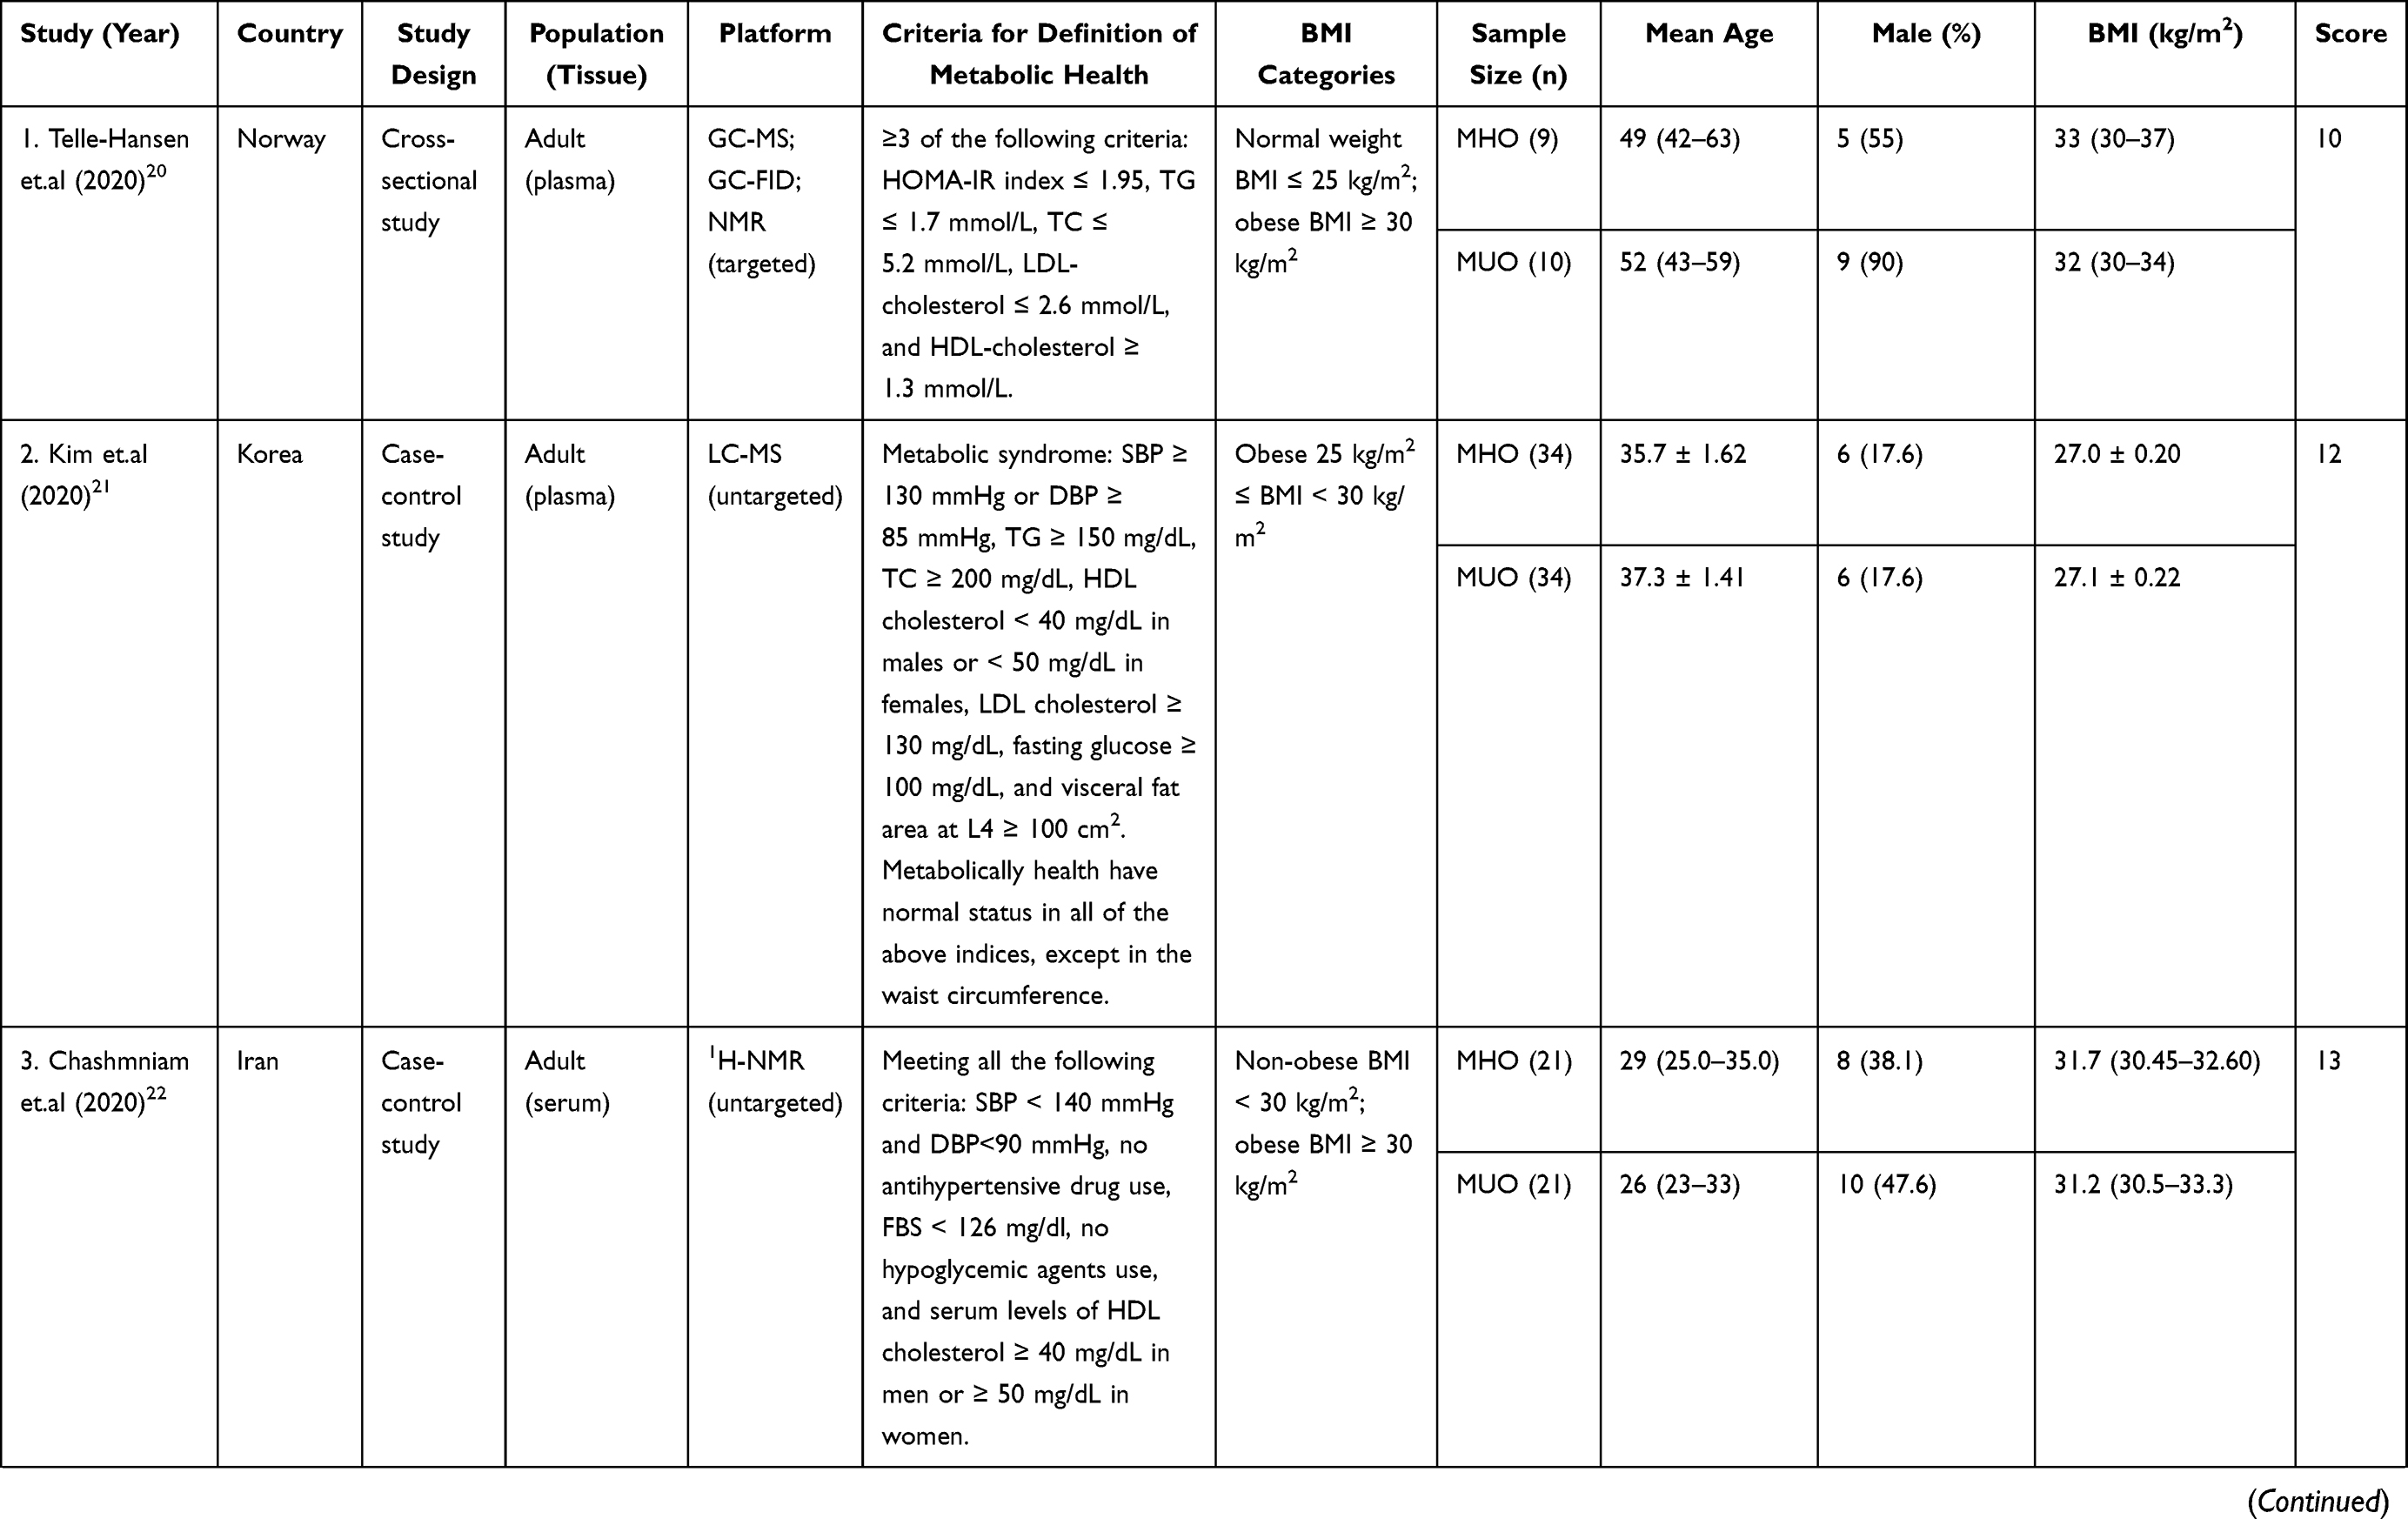
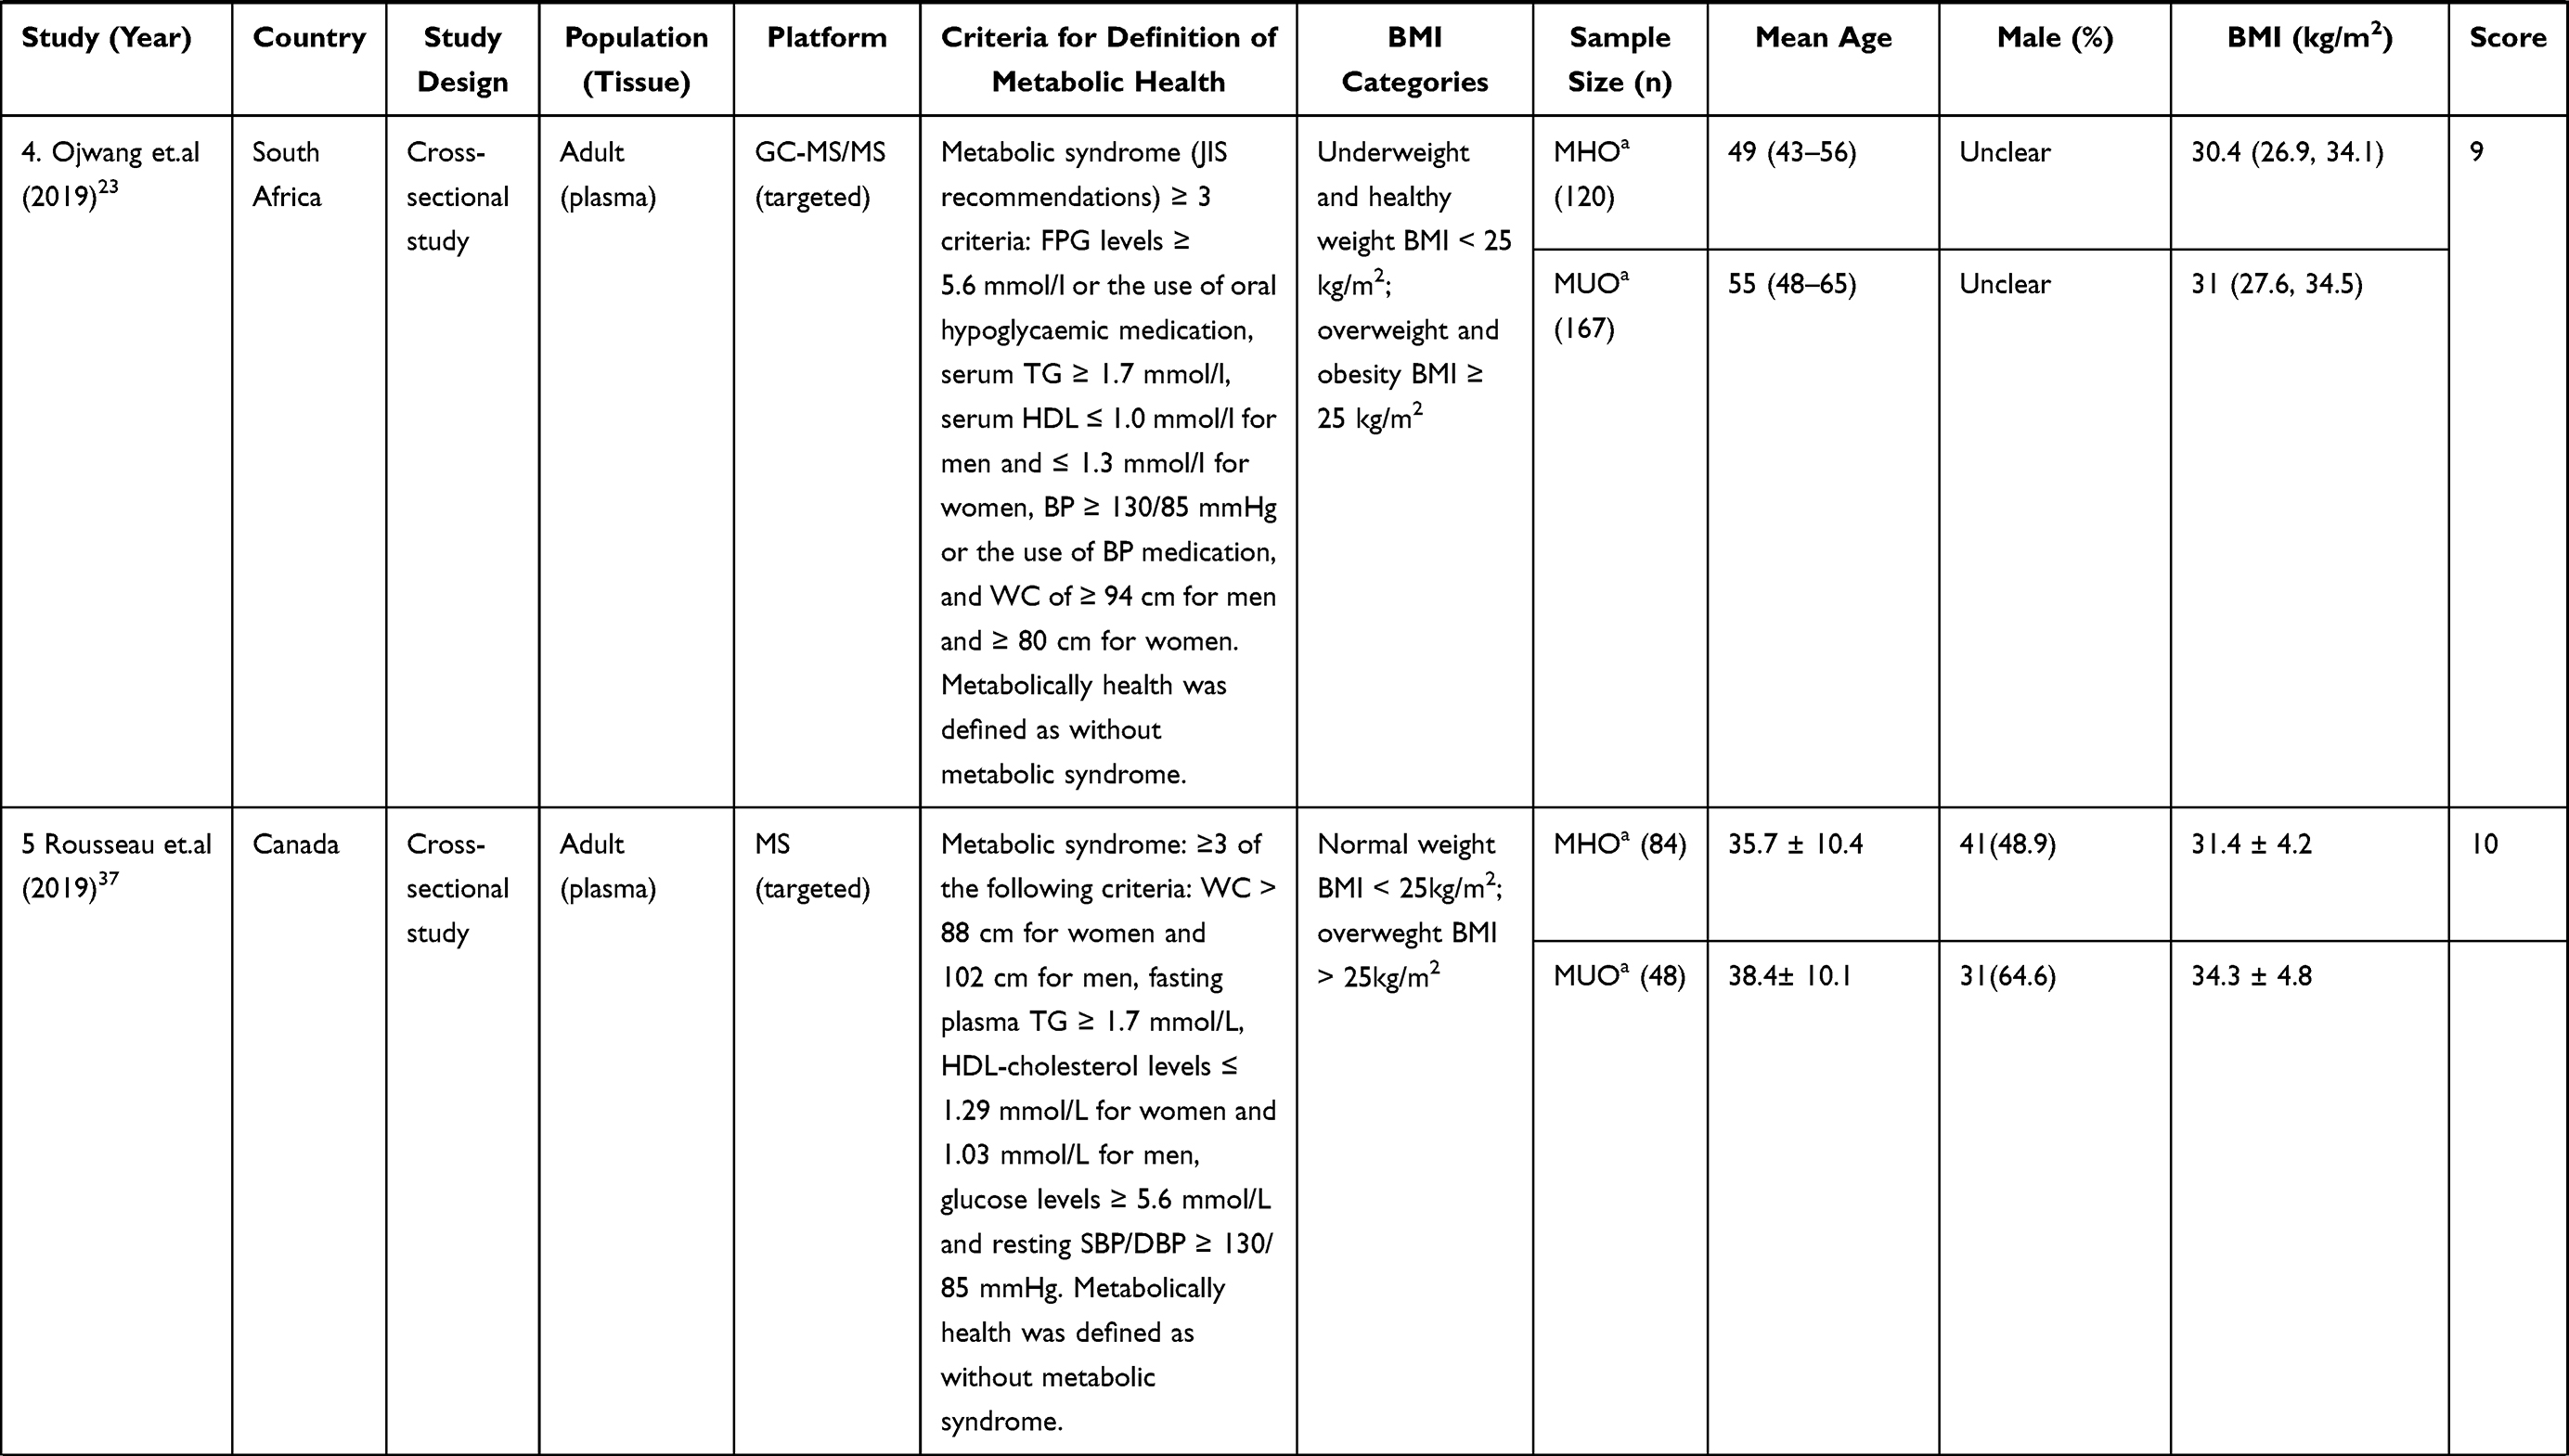
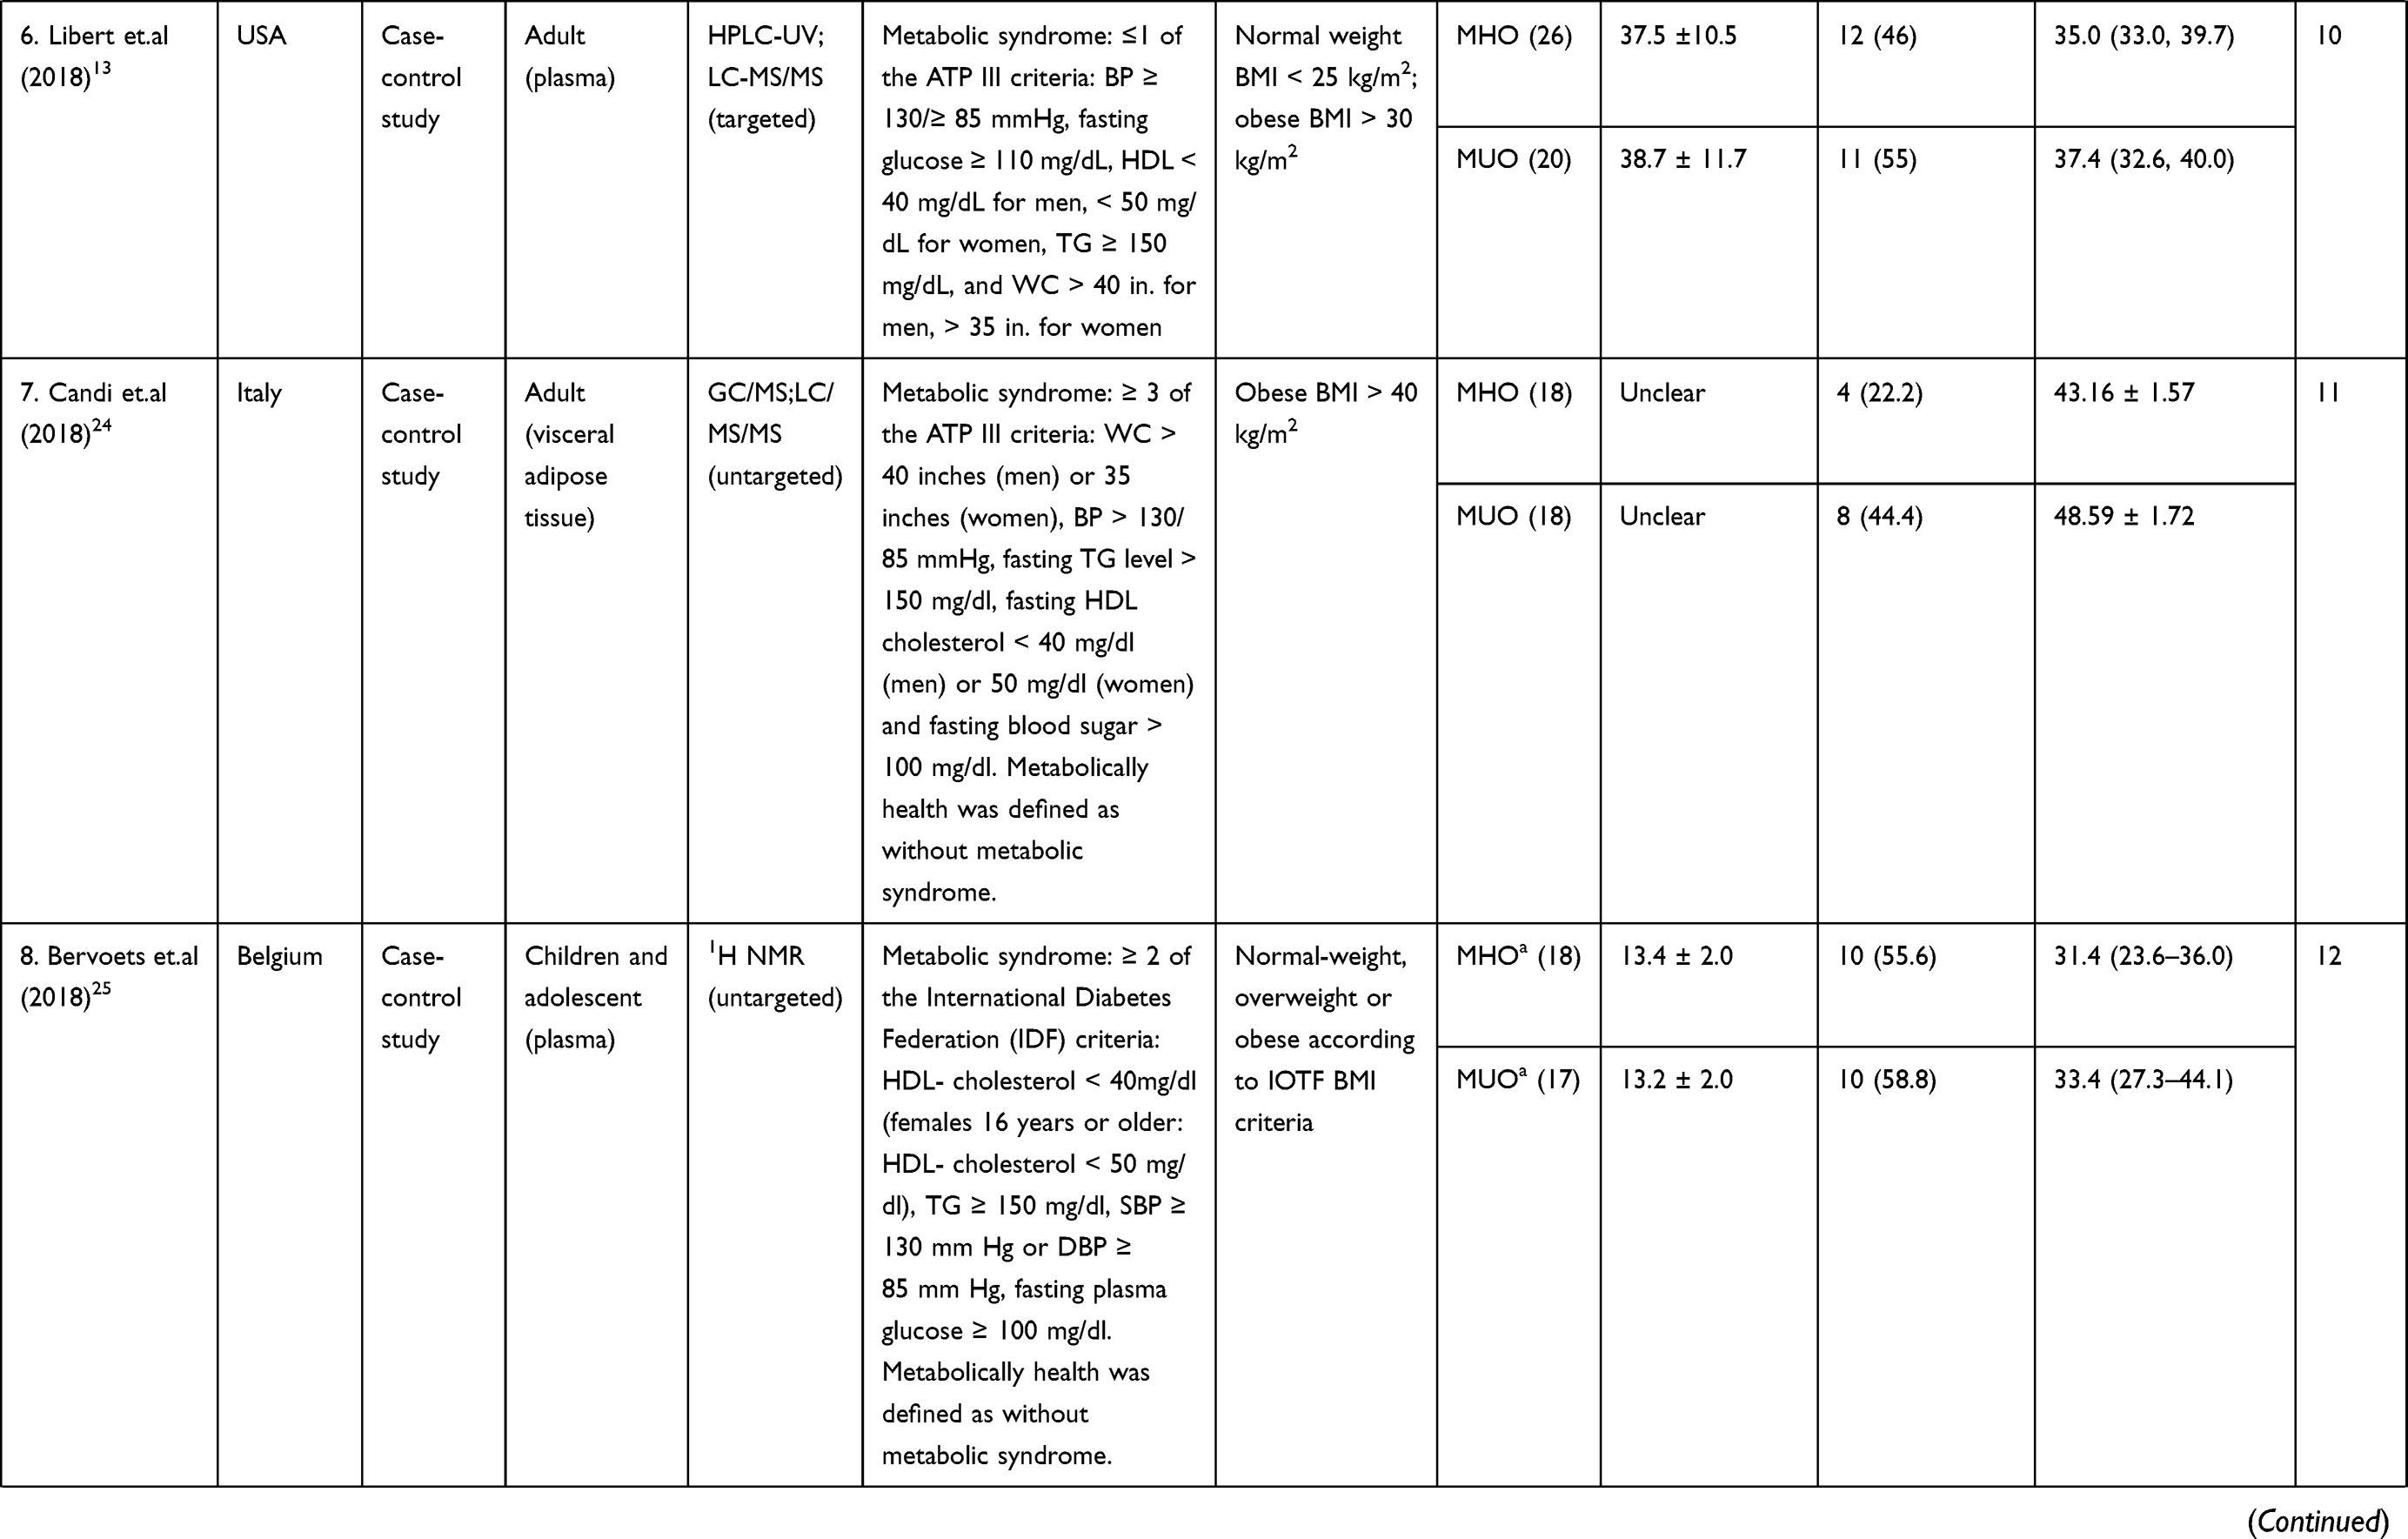
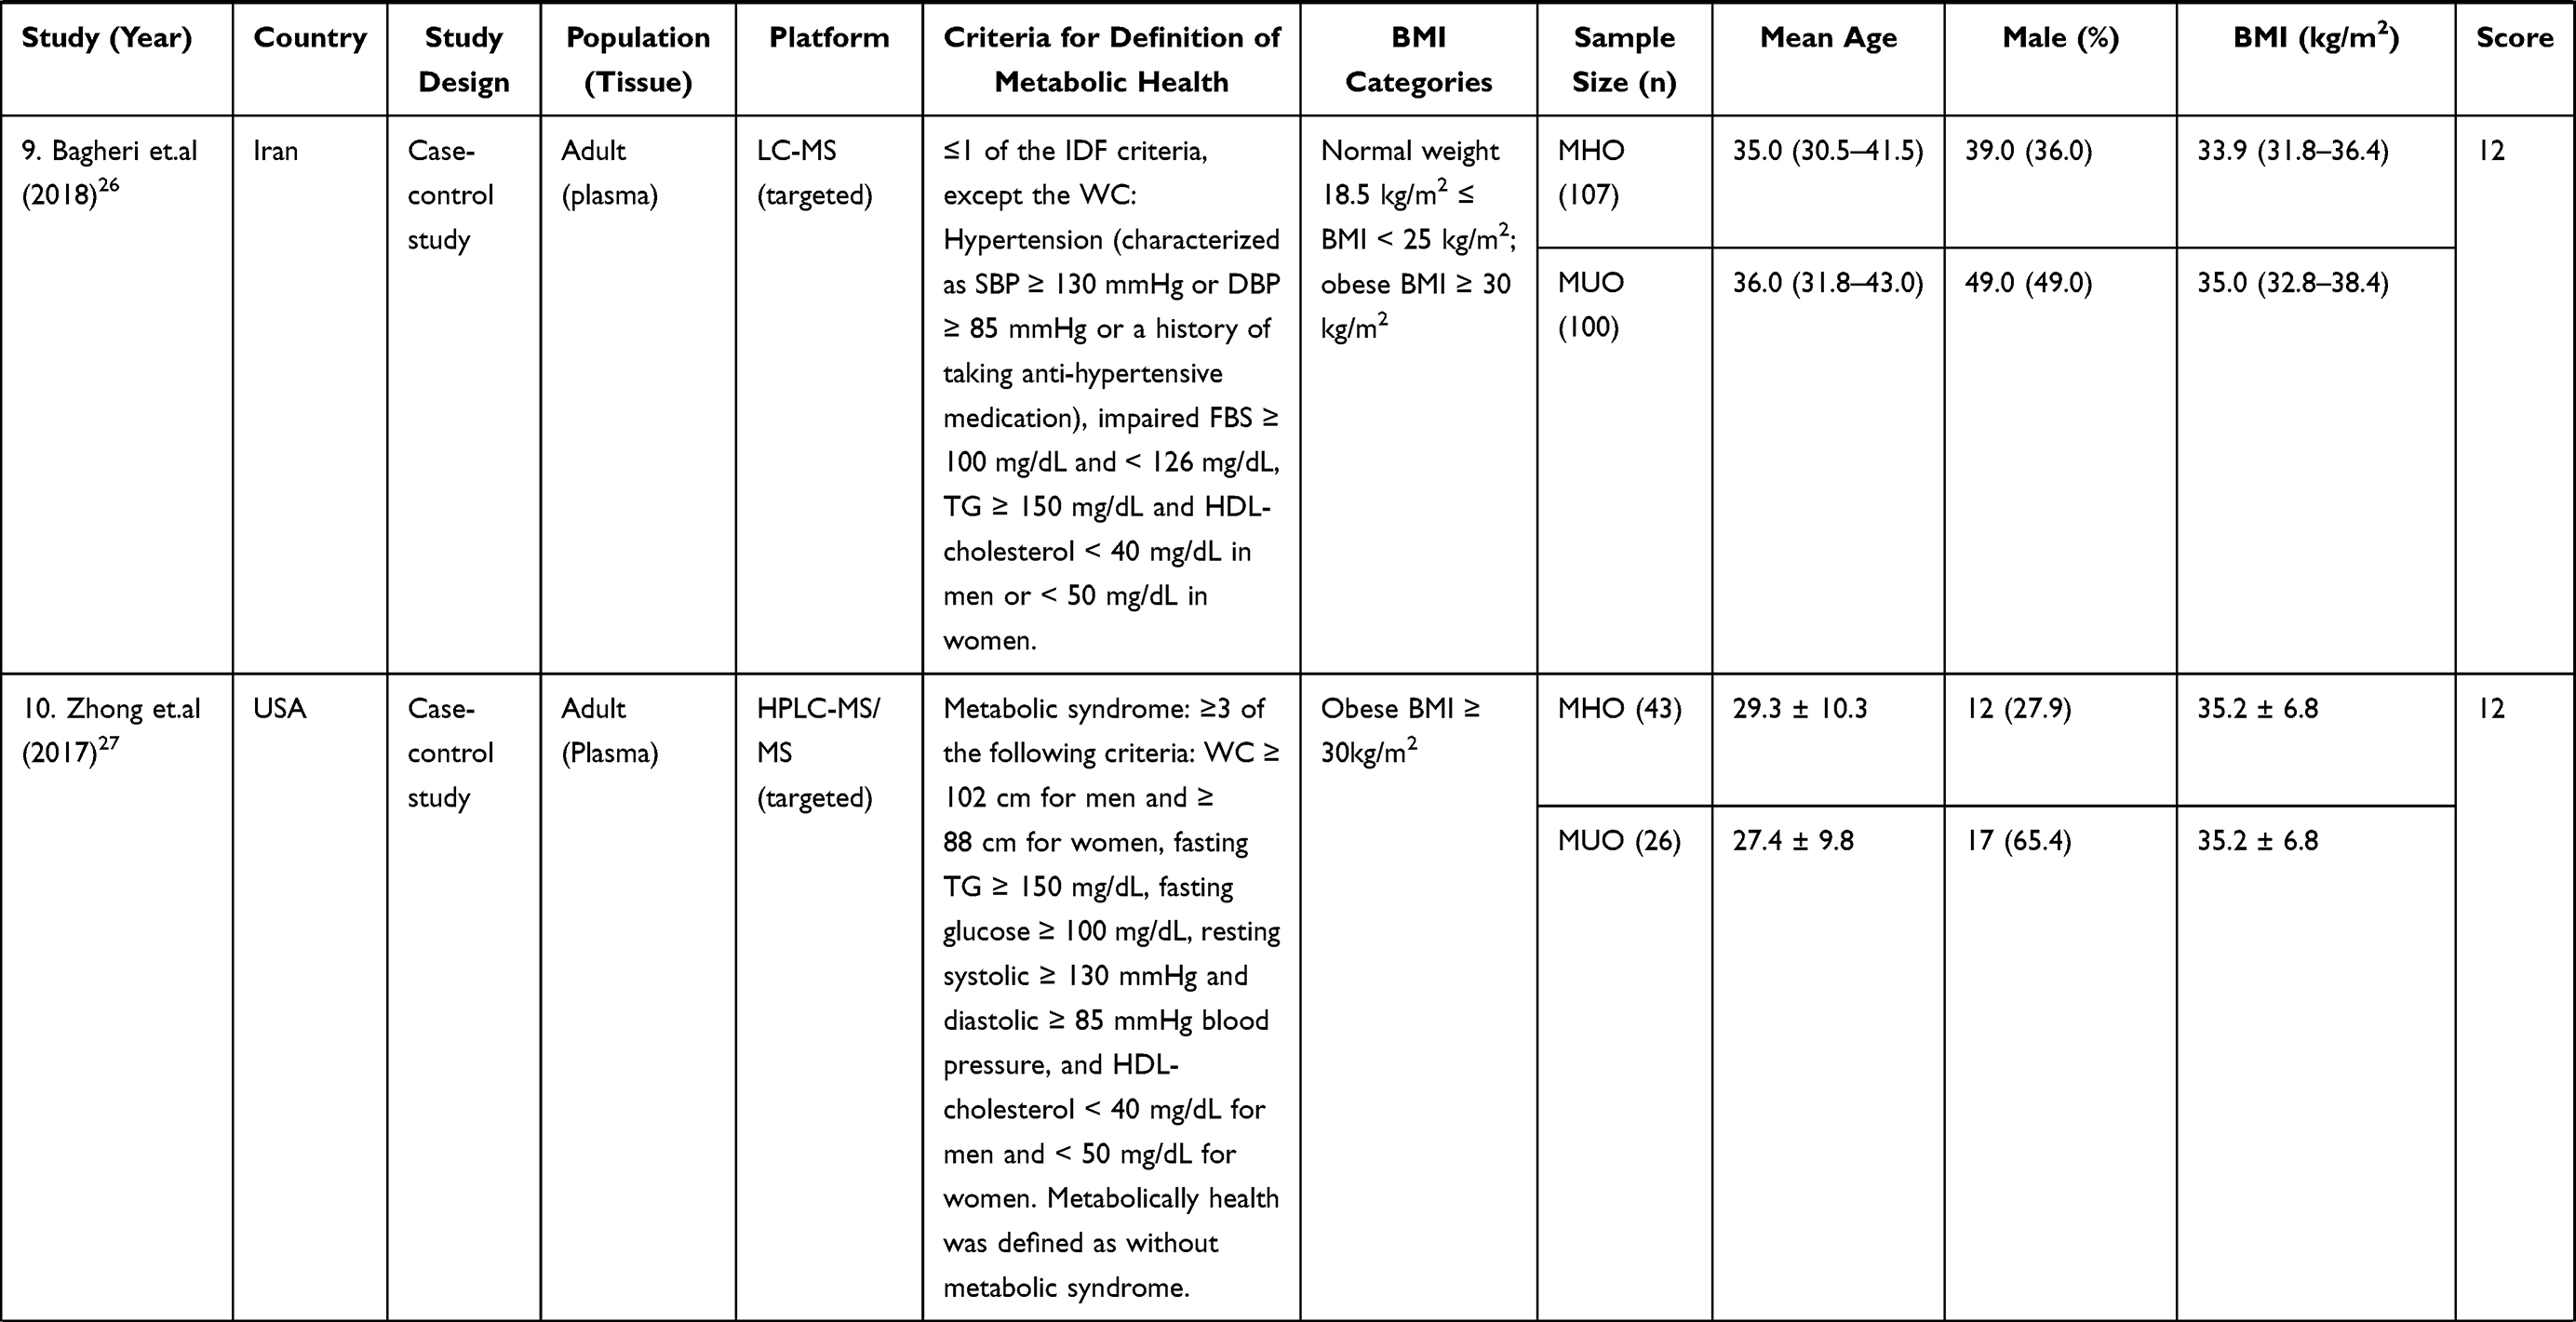
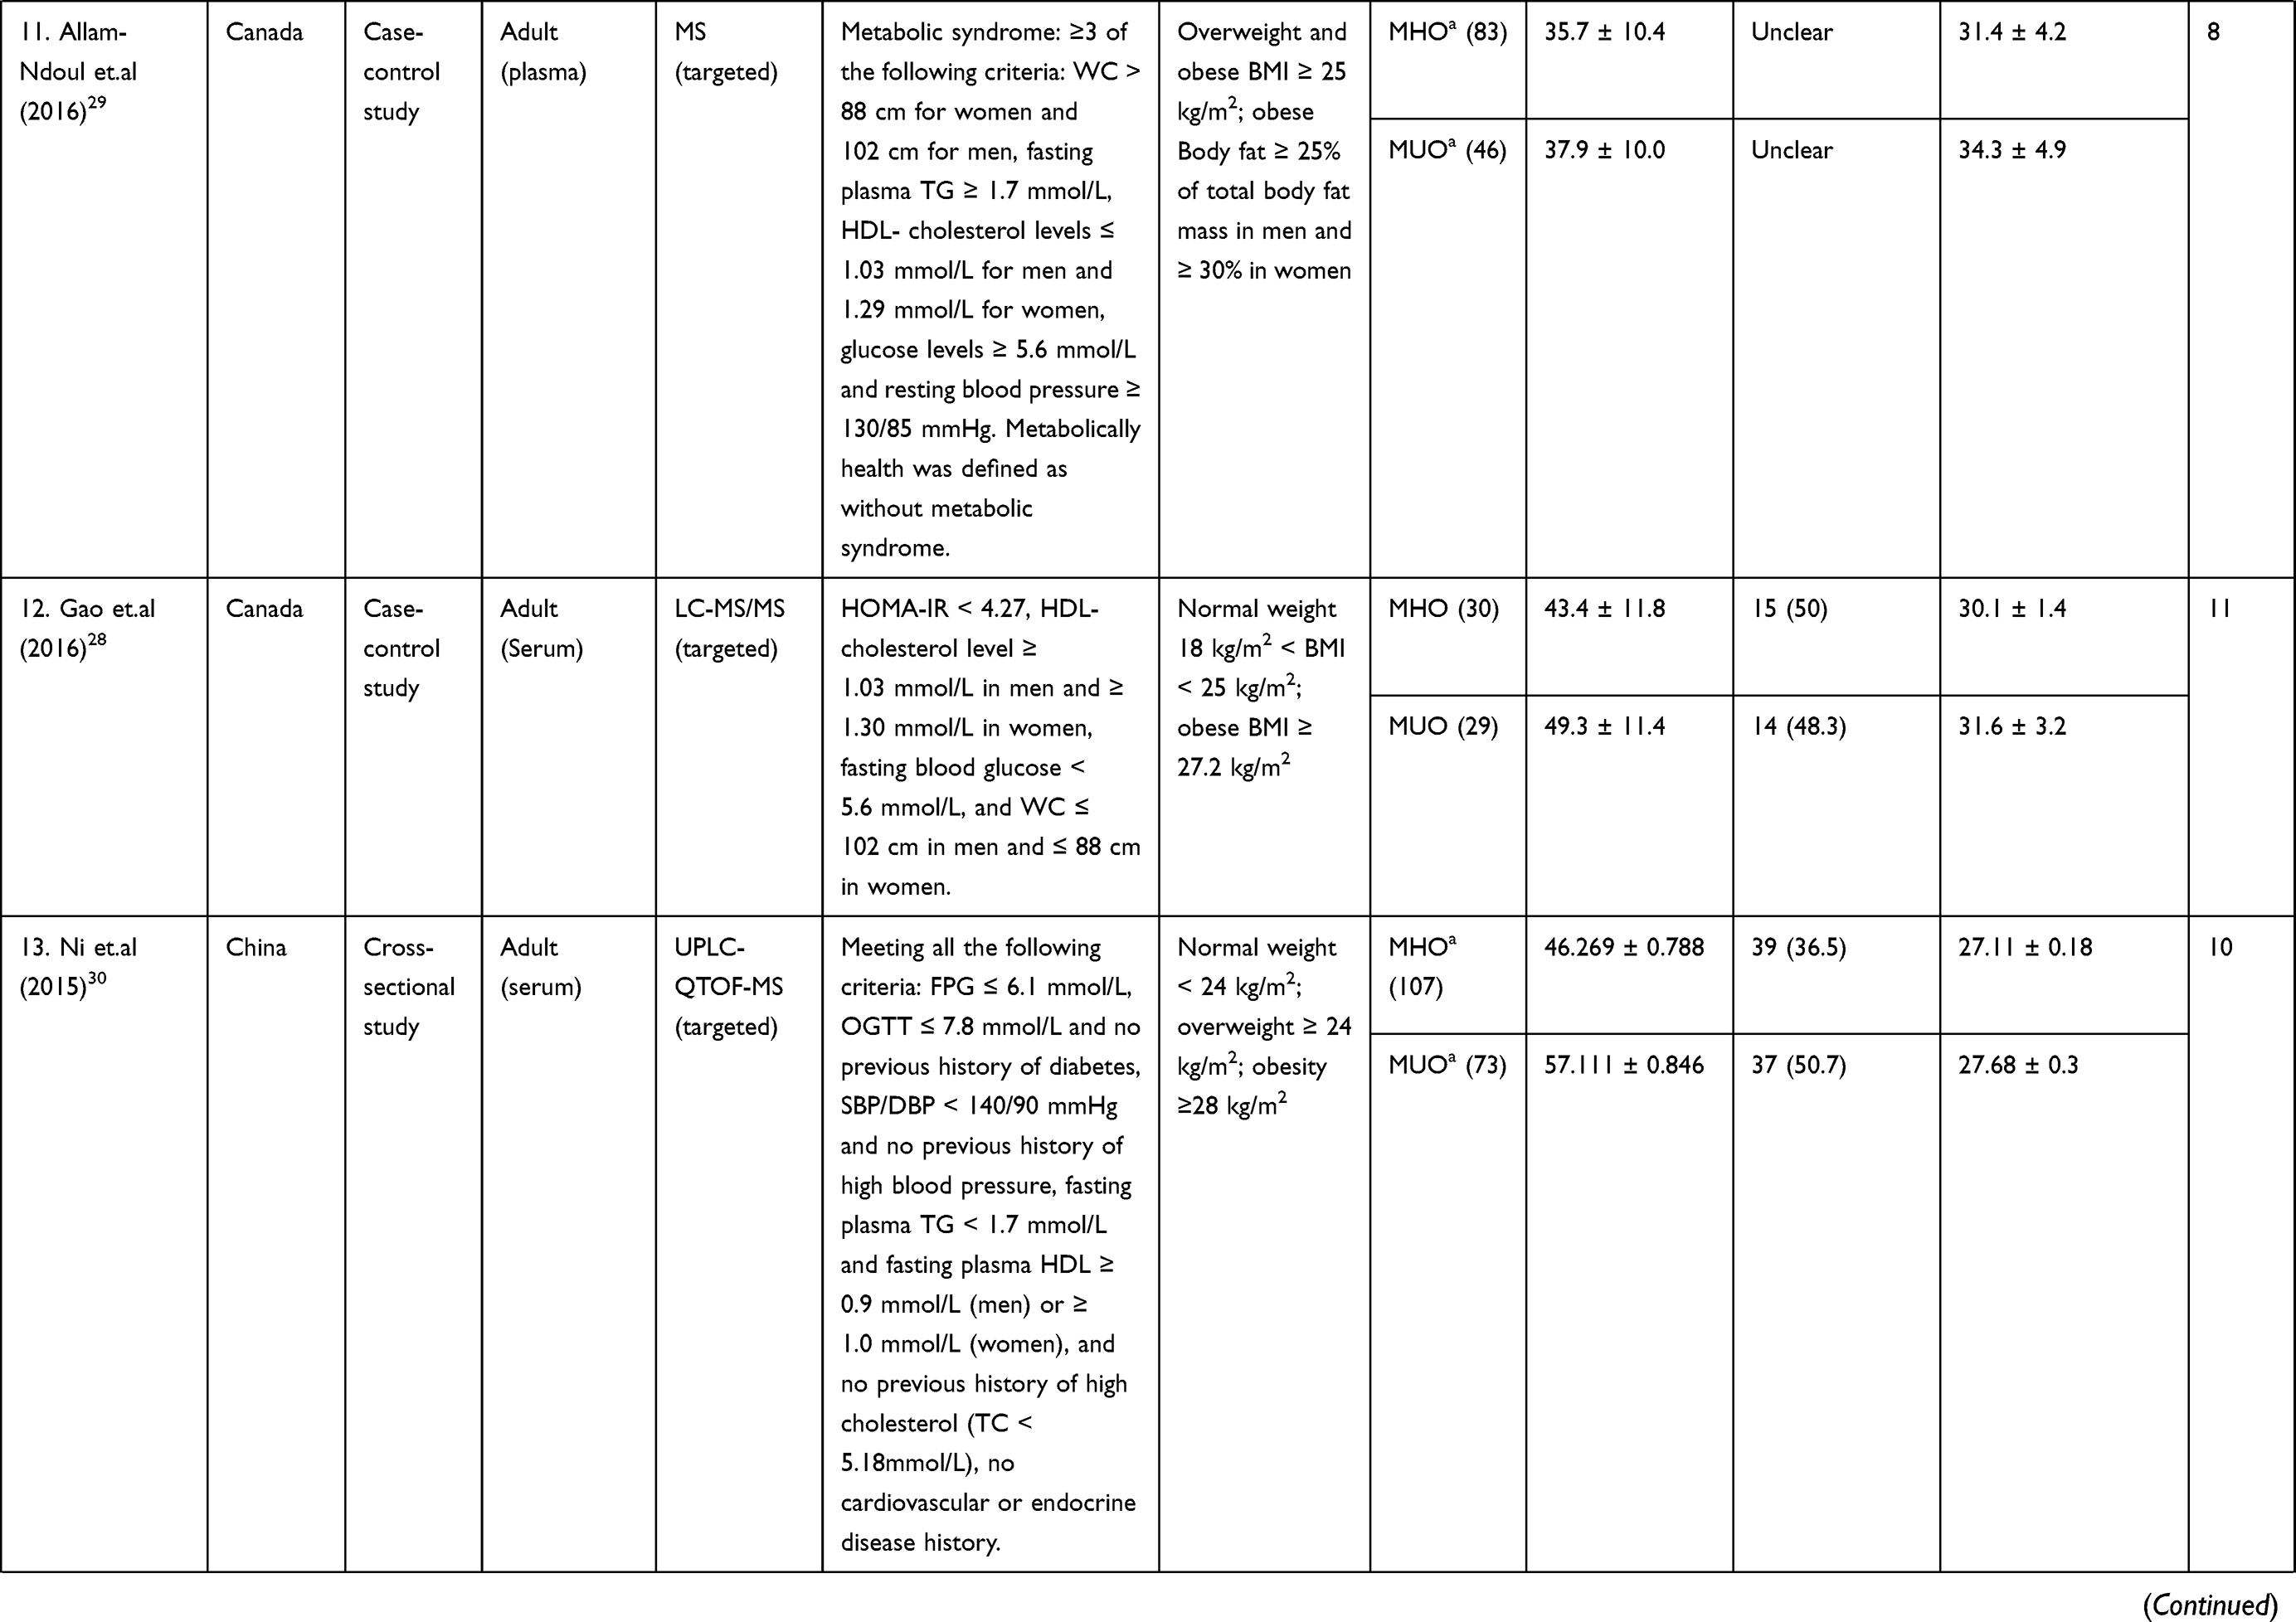
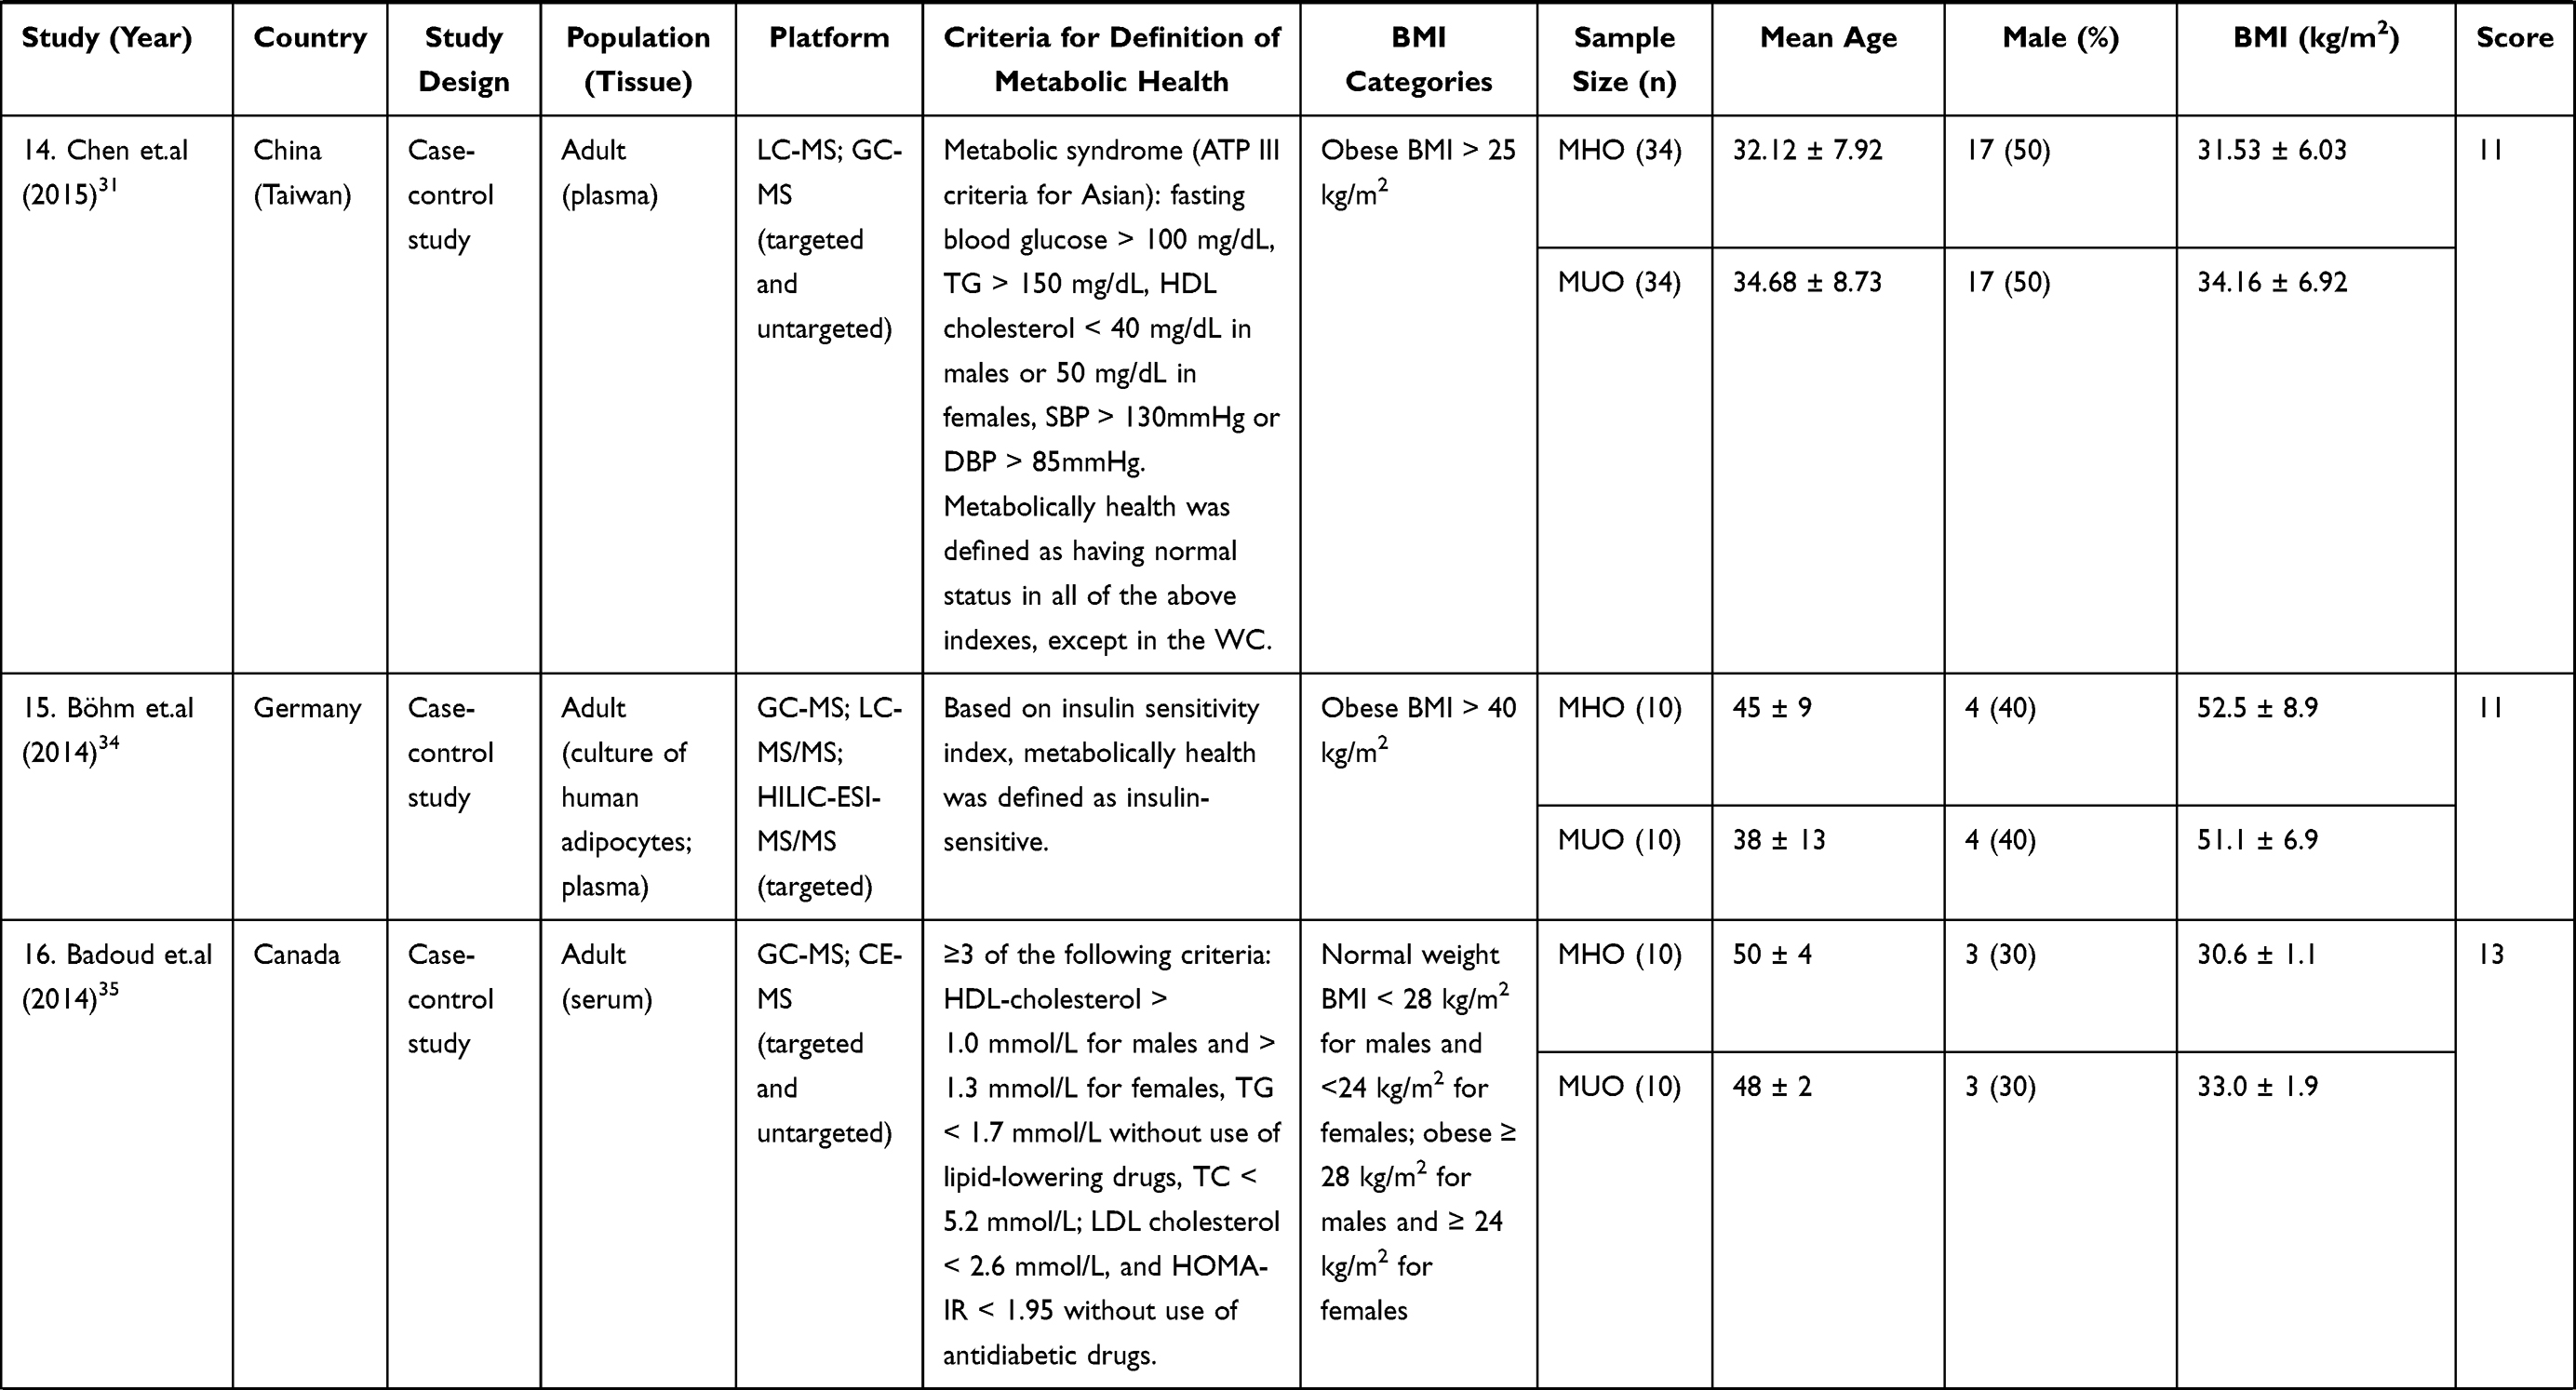
A total of 19 articles (20 studies) were included,13,20–37 5 of which were cross-sectional studies,20,23,33,36,37 13 of which were case-control studies,13,21,22,24–29,31–32,34–35 and 1 article described both cross-sectional and cohort studies.30 2 of them used the same population, but used different metabolomic analysis method.32,35(Table 1). All the 20 studies were published between 2013 and 2020. The definitions of metabolic healthy overweight/obese were different in Table 1. Overweight/obesity in one study was defined by body fat or BMI,29 and in others was defined by BMI but with different cut off point.13,20–28,30–37 Sample types were multiple, as 11 studies used plasma,13,20,21,23,25–27,29,31,36,37 7 studies used serum,22,28,30,32,33,35 1 study used visceral adipose tissue,24 1 study used both cultured human adipocytes and plasma.34 Only 1 study focused on children or adolescents,25 and the subjects of rest studies were adults.13,20–24,26–37 19 studies included both males and females,13,20–32,34–37 and 1 study only focused on females.33 14 studies used targeted methods,13,20,23,26–30,32–34,36,37 4 studies used untargeted methods,21,22,24,25 and 2 study used both targeted and untargeted methods.31,35
 |
 |
 |
 |
 |
 |
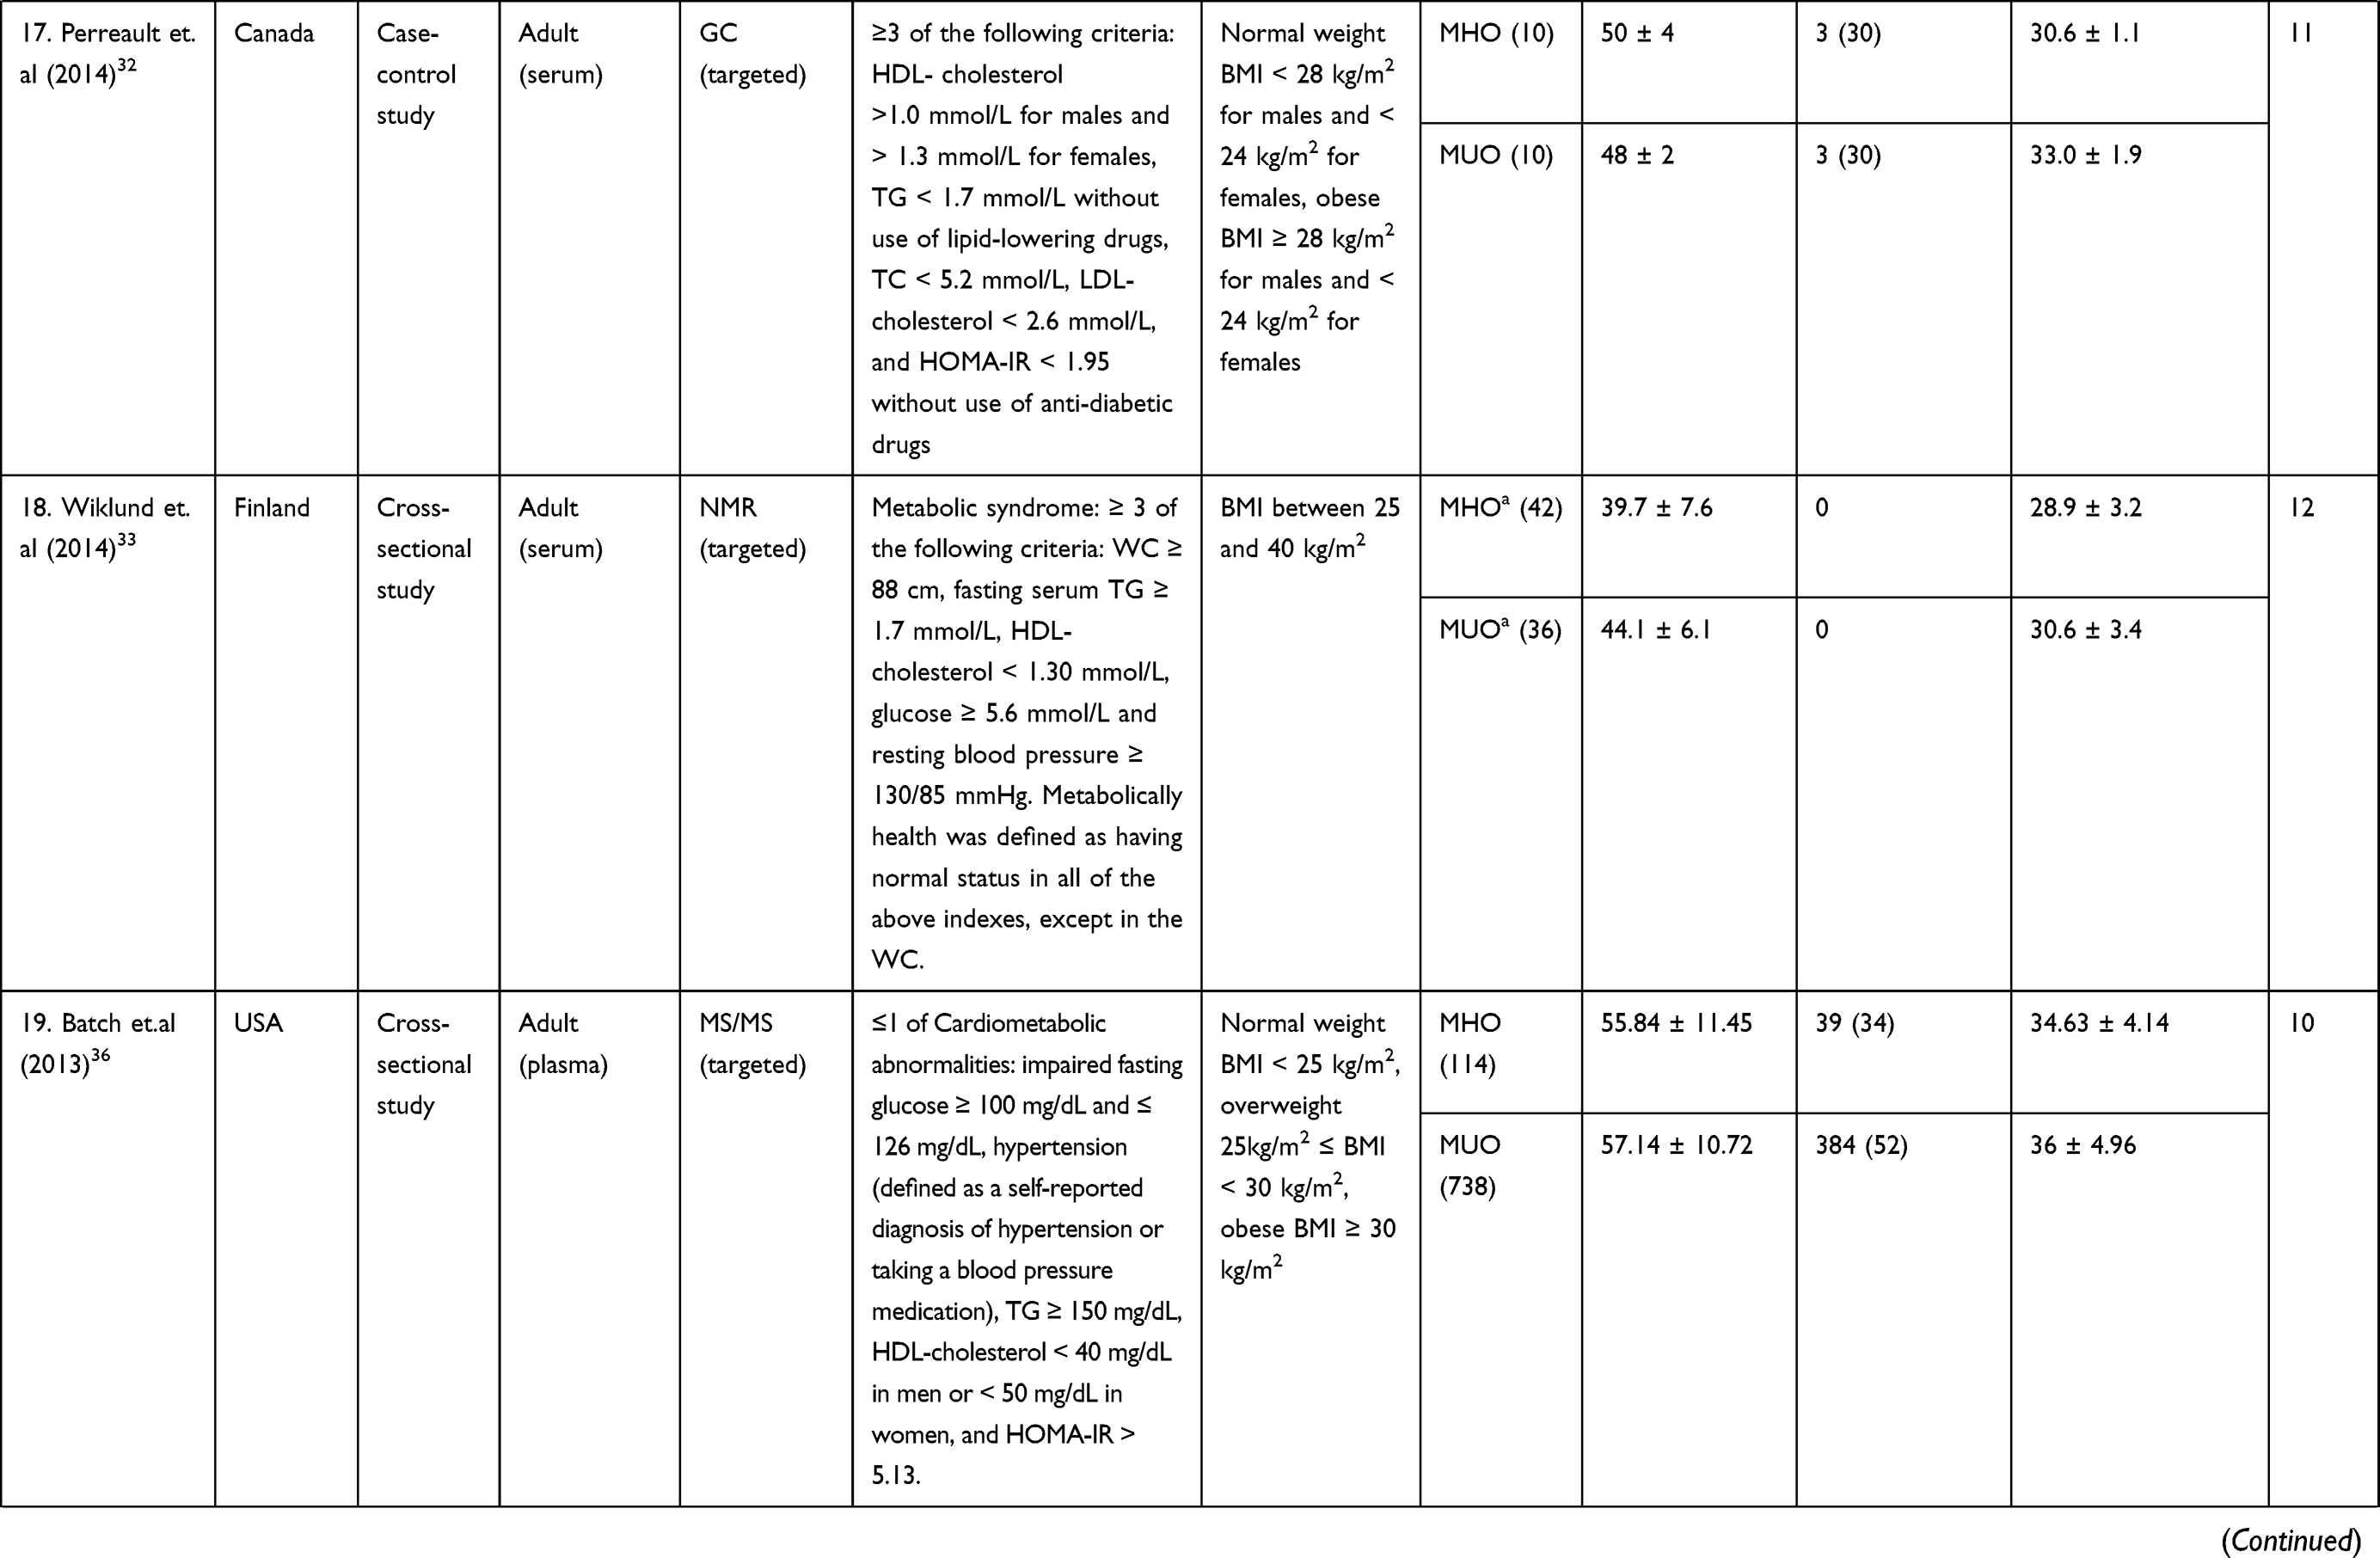 |
Table 1 Characteristics of Studies Identifying Metabolomic Signature Compared Between Metabolically Unhealthy Overweight/Obese and Metabolically Healthy Overweight/Obese |
Comparison of the Metabolomic Signature Between Metabolically Healthy Overweight/Obese and Metabolically Unhealthy Overweight/Obese
Table 2 summarized the different metabolomic signatures between MHO and MUO. By summarizing the metabolites identified, branched-chain amino acids (isoleucine, leucine, and valine), aromatic amino acids (phenylalanine and tyrosine), lipids (palmitic acid, palmitoleic acid, oleic acid, eicosapentaenoic acid, and docosahexaenoic acid), and acylcarnitines (propionyl carnitine) levels might be elevated in MUO.
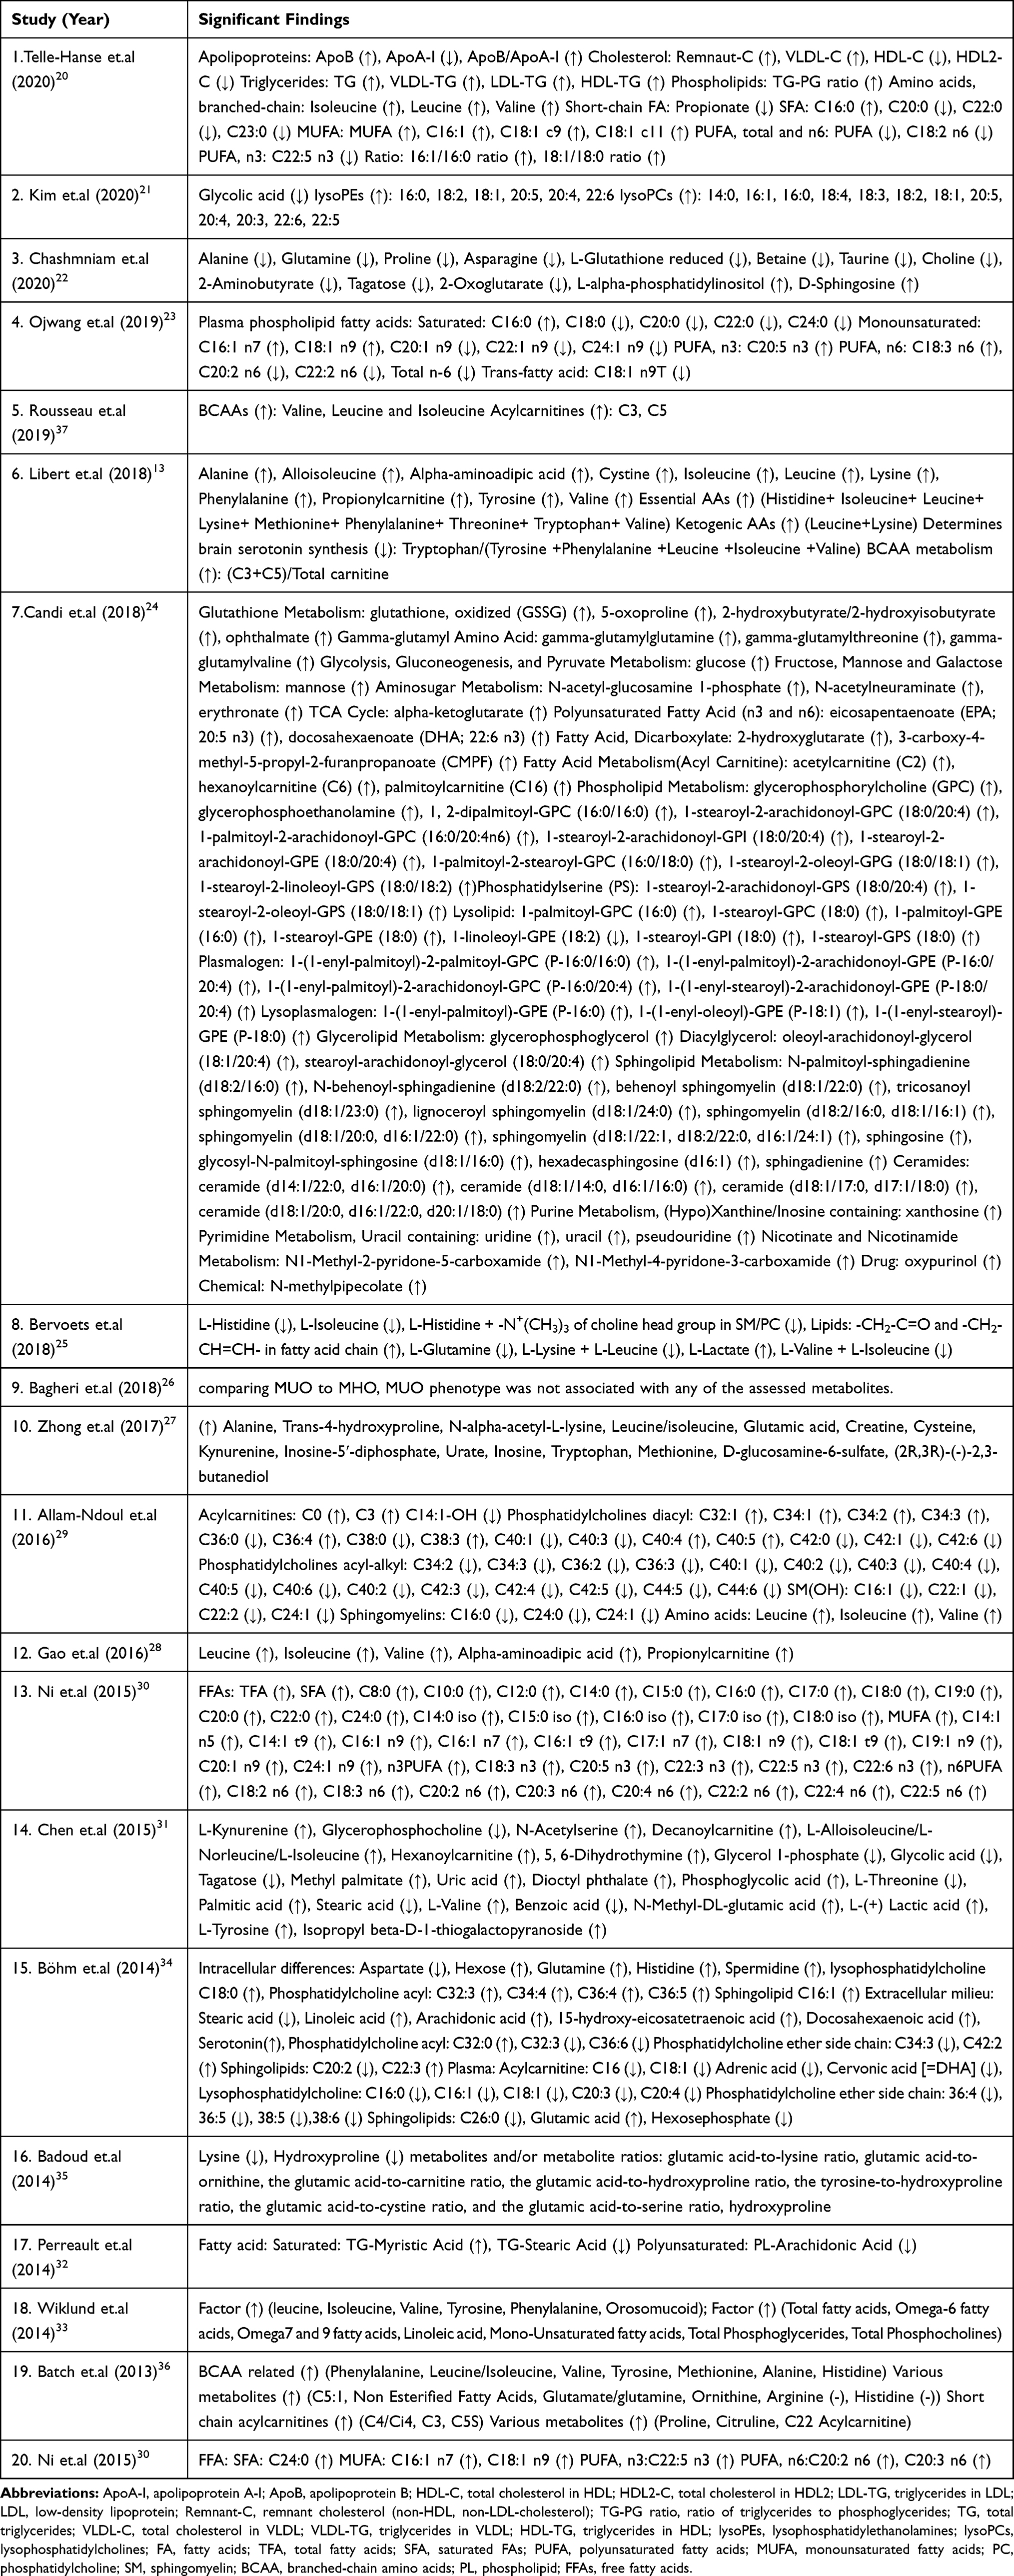 |
Table 2 Significant Findings Compared Between Metabolically Unhealthy Overweight/Obese and Metabolically Healthy Overweight/Obese |
Quality Assessment
According to QUADOMICS,18,19 we conducted a quality assessment process (see the score in Table 1). 12 of 20 studies were classified as “high quality”. The general characteristics of the selected studies and methodological quality assessment were independently checked by Dihe Cheng and Haiying Cui.
Discussion
To the best of our knowledge, this is the first systematic review focusing on describing the metabolomic signature between MUO and MHO. MHO is different from the metabolomic characteristics of MUO and has drawn much attention. MHO group is described at a lower risk of type 2 diabetes, cardiovascular disease, and mortality compared with the MUO group.7,8 Although the results are controversial, the metabolomic signature in different overweight/obese phenotypes may help to identify the risk of developing metabolic diseases, which may lead to an appropriate treatment strategy.
Metabolomic Signature Between Metabolically Healthy Overweight/Obese and Metabolically Unhealthy Overweight/Obese
Amino Acid
Branched-chain amino acids (BCAAs), composed of isoleucine, leucine, and valine, levels of which were higher in MUO compared with MHO in many of the included studies, however, Kim and Badoud21,35 did not find significant differences in BCAAs between MHO and MUO. Such inconsistencies may result from a different definition of MHO and a lack of a unified research platform. BCAAs are often associated with some metabolically unfavorable indicators, especially lipid metabolism. Petri K Wiklund found factor which composed of BCAAs, aromatic amino acids, and orosomucoid was associated with very low density lipoprotein, and inversely with high density lipoprotein.33 Telle-Hansen also discovered that there was a strong positive correlation between BCAAs and triglyceride and a negative correlation between BCAAs and high density lipoprotein cholesterol.20 Results showed BCAAs were significantly reduced in plasma of MUO when compared with MHO in children and adolescents.25 This finding may indicate that compared with adults, metabolic regulation mechanisms may be different in children and adolescents. The increased levels of BCAAs are associated with obesity and the risk of T2DM.14,15,38 Defective BCAAs oxidative metabolism might lead to a further accumulation of BCAAs and toxic intermediates in general obese subjects.39 A hypothesized mechanism linked the increased levels of BCAAs and T2DM involved leucine-mediated activation of the mammalian target of rapamycin complex 1 (mTORC1), which results in uncoupling of insulin signaling at an early stage.40 Higher BCAAs were usually considered as a consequence rather than a cause of insulin resistance, reflecting an abnormal protein breakdown. However, strong evidence suggests that elevations of BCAAs contribute to insulin resistance. Infusions of BCAAs in humans acutely elevated stimulate secretion of insulin and glucagon, and worsen insulin sensitivity.41 The elevation of plasma BCAAs may last more than 10 years before the development of diabetes.42 A locus near PPMIK that was associated with BCAAs levels was correlated with the incidence of diabetes, suggesting that the BCAAs related genetic factors lead to diabetes.43 Given that BCAAs have been extensively studied, BCAAs may be the most promising biomarker for distinguishing obesity phenotypes and may be a contributing factor to phenotypical deleterious development.
Aromatic amino acids (AAAs) are another important class of amino acids. Evidence has shown that AAAs were associated with a higher risk of T2DM after a median follow-up of 3.8 years.44 Among AAAs, phenylalanine, and tyrosine may serve as biomarkers to distinguish MUO from MHO.13,31,33,36 Phenylalanine was higher in obese pregnant women compared to their overweight pregnant counterparts.45 Tyrosine is a hydroxylation product of phenylalanine metabolism and is metabolized in the liver. In Chinese adults, tyrosine over 46 μmol/L was associated with increased odds of T2DM.46 Thus, the elevated levels of AAAs, especially phenylalanine and tyrosine, are parallel to metabolic disorders, indicating that they may serve as biomarkers of MUO.
Besides BCAAs and AAAs, other related amino acids have also been identified. Plasma amino acid concentrations increased in obese people compared with non-obese people, likely as a consequence of increased insulin resistance and protein catabolism.47 The Lower glutamine-to-glutamic acid ratio might serve as an indicator for metabolic unhealthy,35 and glutamine level was higher in MHO compared with MUO.22,25 Since glutamine indeed is thought to have a beneficial effect on cardiometabolic risk,48 it’s not surprising that it appeared in a heart-protected obesity phenotype. Besides, among these studies, one showed that glutamic acid was positively associated with glycosylated hemoglobin (HbA1c), whereas the glutamine-to-glutamic acid ratio was inversely associated with HbA1c.35 This may explain that balanced levels of glutamine and glutamic acid may be important for blood glucose control. A Higher level of alanine was observed in the MHO group compared with MUO in an Iran study.22 However, in other studies included, high levels of alanine were found in MUO.13,27,36 Alanine previously has been shown to increase glucagon secretion in humans49 and related to higher levels of homeostasis model assessment of insulin resistance (HOMA-IR).50 Methionine, an essential amino acid, levels were found higher in the MUO group.27,36 In the general obese population, the plasma concentration of methionine can track insulin resistance and/or predict risk toward the development of T2DM.51 Alpha-aminoadipic acid is a product of lysine degradation and its levels were found lower in MHO.13,28 Since insulin sensitizer therapy significantly reduced αlpha-aminoadipic acid,52 the lower level of alpha-aminoadipic acid in MHO may be a result of increased insulin sensitivity. Levels of kynurenine were higher in MUO.27,31 Kynurenine pathway metabolites have been proposed as biomarkers for the initiation and progression of atherosclerosis and diabetes.53 Although results were inconsistent, histidine levels may also be elevated in the MUO group,13,34,36 consistent with its changes in diabetes progression.54 The above amino acids have been identified, but few studies were focusing on them, which may easily lead to bias conclusions. More metabolomic studies are needed to better identify the amino acids mentioned above.
Lipid
In the included studies, it seemed that saturated fatty acids (SFAs) especially long-chain SFAs did not show strong correlations with MUO compared with unsaturated fatty acids, except the most abundant fatty acid, palmitic acid (C16:0).20,23,30 Blood concentration of palmitic acid was elevated in obese patients compared with non-obese people, leading to inflammatory responses through toll-like receptors (TLR), TLR2, and TLR4.55 It is also reported that palmitic acid is associated with metabolic syndrome,56 and contributes to the development of metabolic syndrome through white adipocyte dysregulation and death, chronic low-grade inflammation, insulin resistance, leptin resistance, and adipokine release dysregulation.57 Among SFAs, only stearic acid (C18:0) was most associated with MHO.23,31,32,34 Interestingly, higher baseline stearic acid/palmitic acid was found to be associated with a greater probability of diabetes remission after bariatric surgery.58 It possibly indicates that an increase in stearic acid/palmitic ratio may deliver a favorable change.
Most of the time, unsaturated fatty acids (UFAs) are generally considered beneficial as opposed to SFAs. However, a systematic review and meta-analysis suggested that an increase of omega-3, omega-6, or total polyunsaturated fatty acids (PUFAs) showed little or no effect on the prevention and treatment of T2DM.59 In another meta-analysis, monounsaturated fatty acids (MUFAs) levels were associated with future cardiovascular events.60 Among the studies we included, the only cohort study showed that fasting concentrations of a panel of UFAs were elevated up to 10 years before the onset of metabolic syndrome.30 This may explain a linkage between cause and result while the other studies are cross-sectional or case-control studies.
The difference of UFAs was common between MUO and MHO groups, but the results were inconsistent. On the whole, among MUFAs, palmitoleic acid (C16:1 n7) and oleic acid (C18:1 n9) seemed to be associated with the MUO group.23,30 Shreds of evidence have shown that palmitoleic acid has been associated with an increased risk of metabolic syndrome,61,62 and oleic acid may predispose to obesity and obesity-related disorders.63 Among PUFAs, levels of and eicosapentaenoic acid (EPA, C20:5 n3),23,24,30 and docosahexaenoic acid (DHA, C22:6 n3)24,30,34 increased in the MUO group. EPA and DHA are the most important n-3 PUFAs, and they are associated with a lower risk of developing metabolic syndrome.64 Moderate supplementation with EPA and DHA improved the insulin resistant condition in patients with chronic renal failure on maintenance hemodialysis.65 Besides, EPA and DHA supplements also are beneficial to reducing and preventing cardiovascular disease.66,67 The mechanism underlying why these two PUFAs levels were increased in the MUO group is unclear. It is undemonstrable to conclude that high levels of EPA and DHA contribute to developing MUO. A possible explanation of the increased levels of EPA and DHA in MUO might be a result of barriers to utilization or consumption, which may be unique manifestations of obesity combined with metabolic unhealthy. There are also other fatty acids, for example, C20:0, C22:0, C24:0, C22:5 n3, C18:2 n6, C18:3 n6, C20:2 n6, C20:3 n6, levels of which may have an increased or decreased trend in MUO compared with MHO. However, due to the limited number of studies, more researches are needed to further explore whether these fatty acids can be used as biomarkers to distinguishing overweight/obese phenotypes. In addition to the differences in metabolomics studies, more attention should be paid to differences in dietary intake, for example, many studies used plasma or serum and blood fatty acids are closely related to diet.
Acylcarnitine
Acylcarnitines (ACs) are intermediate oxidative metabolites formed intracellularly from carnitine during the metabolism of long-chain fatty acids and BCAAs. We observed some differences in acylcarnitine levels in the collected literature between the MUO group and the MHO group.29,34,36,37 Results showed that propionylcarnitine, a product of mitochondrial BCAAs (especially isoleucine and valine) catabolism,68 has been identified the most frequently. The associations of increased levels of acylcarnitines in diabetes69,70 and general obesity16 have been investigated. Excessive accumulation of acylcarnitine may indicate β-oxidation dysfunction, mitochondrial stress, and insulin resistance,71 and these may be related to the metabolic characteristics of MUO.
Relevance and Significance to Other Systematic Reviews of Obesity Metabolomics
In the current systematic review, the difference of metabolites between the MHO group and the MUO group showed more information about metabolic effects, since both groups were overweight/obese. However, other systematic reviews of metabolomics in overweight/obesity showed more information about obesity effects,14,16,72 since the difference of metabolites were identified between normal weight and overweight/obese. In previous systematic reviews, metabolites that different between obese and normal people, such as BCAAs, were also found different between MUO and MHO in our study. Perhaps elevated and reduced levels of these metabolites indicate unfavorable metabolic signature. The current results suggested that MHO showed a favorable trend in the overall metabolic signature. A study showed that obese individuals with no metabolic abnormalities had a higher risk of coronary heart disease, cerebrovascular disease, and heart failure compared with normal weight healthy individuals during a mean follow-up of 5.4 years. Meanwhile, these risks increased with an increasing number of metabolic abnormalities.73 A meta-analysis demonstrated that the pooled adjusted relative risk (RR) for the incident of T2DM was 4.03 (95% CI=2.66–6.09) in healthy obese adults and the risk among unhealthy obese subjects was approximately two times that of healthy obese individuals.74 The above studies have approved that compared with patients with MUO, patients with MHO have a lower risk of developing metabolic diseases. The favorable metabolic signature is consistent with a lower risk of metabolic disease in MHO patients.
Significance of Metabolomic Signature of Overweight/Obesity Phenotype
The metabolic phenotype of overweight/obesity is not immutable, while a subject’s status can switch from metabolically healthy to metabolically unhealthy. During an 8-year follow-up, a prospective community-based cohort study showed several healthy obese individuals moved to unhealthy groups.75 Similarly, in one of the studies included, 50 subjects out of 62 metabolic healthy people turned metabolically unhealthy and only 12 maintained metabolic health, about 12 years later.30 Correspondingly, a transition from metabolically unhealthy to healthy obesity can be achieved. A study observed that 25% of women from the MUO group changed to MHO after a 12-week energy-restricted diet intervention.76 Thus, the health condition of obesity is more of a dynamic change. MHO can serve as an appropriate primary goal that helps motivate patients toward the long-term goals of obesity treatment, and MHO can also warn that the patient’s health condition is moving in a progressive direction. Therefore, it is essential for clinical treatment and prevention. However, clinical significance alone does not seem to support the importance of MHO’s presence. Some health care professionals still suggest that the definition of MHO may be considered meaningless as a transitional state or as a “honeymoon period”. The current systematic reviews focused on the metabolic signature between MUO and MHO and noted that underlying metabolic mechanisms might be different in these two obesity phenotypes, all of which add support to the importance of MHO’s existence. Moreover, metabolomic signature as a biomarker of MHO and MUO may contribute to weight loss, treatment, and prevention of overweight/obesity.
Limitations and Prospects
Despite significant findings that explain differences between the MUO and MHO groups, this systematic review has limitations. Firstly, there is still no consensus about the criteria applied to define metabolically healthy and unhealthy overweight/obese in the current literature. However, rigorous criteria would have a significant impact on the types and numbers of metabolites that might be detected. Secondly, there is only one prospective study, and the rest are non-prospective studies. These non-prospective studies did not show the differences in metabolites have occurred before the progression to an unhealthy status in obese patients and therefore causal relationship is merely a hypothesis. Thirdly, levels of physical activity and calorie intake may critically attribute to the levels of various metabolites, it should be considered that the different levels of confounding factor control may lead to differences in conclusions. Fourthly, in this systematic review, more than half of the studies had a total sample size of less than 100 and small sample sizes also may reduce the credibility of the results.
It has been previously shown that MHO subjects have a potential risk to become metabolically unhealthy. However, how the progression happened remained unknown. The underlying metabolic pathways and metabolic mechanisms are still not yet identified. Because the disease itself is dynamic, more longitudinal studies are needed to elaborate more deeply on the metabolic pathway and the relationship between metabolic patterns and disease occurrence.
Conclusion
Metabolomics is a tool with the potential for a better understanding of the disease progression and metabolic pathways. The present systematic review presents the first study to show valuable information on specific metabolite patterns on signatures of the metabolically healthy and unhealthy phenotypes in patients with overweight/obesity. Branched-chain amino acids (isoleucine, leucine, and valine), aromatic amino acids (phenylalanine and tyrosine), lipids (palmitic acid, palmitoleic acid, oleic acid, eicosapentaenoic acid, and docosahexaenoic acid), and acylcarnitines (propionyl carnitine) levels might be elevated in MUO. The current results suggested that MHO showed a favorable trend in the overall metabolic signature. Due to the limited literature, more research on the metabolomic signature already identified is needed.
Acknowledgments
This work was supported by grants (belonging to Guixia Wang) from the National Key R &D Program of China [2016YFC0901204], the National Natural Science Foundation of China [81670732], and Jilin Provincial Development and Reform Commission [2017C019].
Disclosure
The authors report no conflicts of interest in this work.
References
1. Flegal KM, Kit BK, Orpana H, Graubard BI. Association of all-cause mortality with overweight and obesity using standard body mass index categories: a systematic review and meta-analysis. JAMA. 2013;309(1):71–82. doi:10.1001/jama.2012.113905
2. Riaz H, Khan MS, Siddiqi TJ, et al. Association between obesity and cardiovascular outcomes: a systematic review and meta-analysis of mendelian randomization studies. JAMA Network Open. 2018;1(7):e183788. doi:10.1001/jamanetworkopen.2018.3788
3. Guh DP, Zhang W, Bansback N, Amarsi Z, Birmingham CL, Anis AH. The incidence of co-morbidities related to obesity and overweight: a systematic review and meta-analysis. BMC Public Health. 2009;9:88.
4. Ahirwar R, Mondal PR. Prevalence of obesity in India: a systematic review. Diabetes Metab Syndr. 2019;13(1):318–321.
5. Primeau V, Coderre L, Karelis AD, et al. Characterizing the profile of obese patients who are metabolically healthy. Int j Obesity. 2011;35(7):971–981.
6. Rey-López JP, de Rezende LF, Pastor-Valero M, Tess BH. The prevalence of metabolically healthy obesity: a systematic review and critical evaluation of the definitions used. Obesity Rev. 2014;15(10):781–790.
7. Phillips CM. Metabolically healthy obesity: definitions, determinants and clinical implications. Rev Endocr Metab Disord. 2013;14(3):219–227.
8. Stefan N, Häring HU, Hu FB, Schulze MB. Metabolically healthy obesity: epidemiology, mechanisms, and clinical implications. Lancet Diabetes Endocrinol. 2013;1(2):152–162.
9. Feng T, Vegard M, Strand LB, et al. Metabolically healthy obesity and risk for atrial fibrillation: the HUNT Study. Obesity. 2019;27(2):332–338.
10. Liang P, Xi L, Shi J, et al. Prevalence of polycystic ovary syndrome in Chinese obese women of reproductive age with or without metabolic syndrome. Fertil Steril. 2017;107(4):1048–1054. doi:10.1016/j.fertnstert.2016.12.029
11. Lotti F, Rastrelli G, Maseroli E, et al. Impact of metabolically healthy obesity in patients with andrological problems. J Sex Med. 2019;16(6):821–832. doi:10.1016/j.jsxm.2019.03.006
12. Bujak R, Struck-Lewicka W, Markuszewski MJ, Kaliszan R. Metabolomics for laboratory diagnostics. J Pharm Biomed Anal. 2015;113:108–120. doi:10.1016/j.jpba.2014.12.017
13. Libert DM, Nowacki AS, Natowicz MR. Metabolomic analysis of obesity, metabolic syndrome, and type 2 diabetes: amino acid and acylcarnitine levels change along a spectrum of metabolic wellness. PeerJ. 2018;6:e5410. doi:10.7717/peerj.5410
14. Rangel-Huerta OD, Pastor-Villaescusa B, Gil A. Are we close to defining a metabolomic signature of human obesity? A systematic review of metabolomics studies. Metabolomics. 2019;15(6):93. doi:10.1007/s11306-019-1553-y
15. Guasch-Ferré M, Hruby A, Toledo E, et al. Metabolomics in prediabetes and diabetes: a systematic review and meta-analysis. Diabetes Care. 2016;39(5):833–846. doi:10.2337/dc15-2251
16. Zhao X, Gang X, Liu Y, Sun C, Han Q, Wang G. Using metabolomic profiles as biomarkers for insulin resistance in childhood obesity: a systematic review. J Diabetes Res. 2016;2016:8160545. doi:10.1155/2016/8160545
17. Zhang Y, Zhang S, Wang G. Metabolomic biomarkers in diabetic kidney diseases—A systematic review. J Diabetes Complications. 2015;29(8):1345–1351. doi:10.1016/j.jdiacomp.2015.06.016
18. Lumbreras B, Porta M, Márquez S, Pollán M, Parker LA, Hernández-Aguado I. QUADOMICS: an adaptation of the Quality Assessment of Diagnostic Accuracy Assessment (QUADAS) for the evaluation of the methodological quality of studies on the diagnostic accuracy of ‘-omics’-based technologies. Clin Biochem. 2008;41(16–17):1316–1325. doi:10.1016/j.clinbiochem.2008.06.018
19. Whiting P, Rutjes AW, Reitsma JB, Bossuyt PM, Kleijnen J. The development of QUADAS: a tool for the quality assessment of studies of diagnostic accuracy included in systematic reviews. BMC Med Res Methodol. 2003;3(1):25. doi:10.1186/1471-2288-3-25
20. Telle-Hansen VH, Christensen JJ, Formo GA, Holven KB, Ulven SM. A comprehensive metabolic profiling of the metabolically healthy obesity phenotype. Lipids Health Dis. 2020;19(1):90. doi:10.1186/s12944-020-01273-z
21. Kim M, Yoo HJ, Ko J, Lee JH. Metabolically unhealthy overweight individuals have high lysophosphatide levels, phospholipase activity, and oxidative stress. Clin Nutrition. 2020;39(4):1137–1145. doi:10.1016/j.clnu.2019.04.025
22. Chashmniam S, Madani NH, Ghoochani BFNM, Safari-Alighiarloo N, Khamseh ME. The metabolome profiling of obese and non-obese individuals: metabolically healthy obese and unhealthy non-obese paradox. Iran J Basic Med Sci. 2020;23(2):186–194. doi:10.22038/IJBMS.2019.37885.9004
23. Ojwang AA, Smuts CM, Zec M, Wentzel-Viljoen E, Kruger IM, Kruger HS. Comparison of dietary and plasma phospholipid fatty acids between normal weight and overweight black South Africans according to metabolic health: the PURE study. Prostaglandins Leukot Essent Fatty Acids. 2019;102039.
24. Candi E, Tesauro M, Cardillo C, et al. Metabolic profiling of visceral adipose tissue from obese subjects with or without metabolic syndrome. Biochem J. 2018;475(5):1019–1035. doi:10.1042/BCJ20170604
25. Bervoets L, Massa G, Guedens W, Reekmans G, Noben J-P, Adriaensens P. Identification of metabolic phenotypes in childhood obesity by 1 H NMR metabolomics of blood plasma. Fut Sci OA. 2018;4(6):6. doi:10.4155/fsoa-2017-0146
26. Bagheri M, Farzadfar F, Qi L, et al. Obesity-Related Metabolomic Profiles and Discrimination of Metabolically Unhealthy Obesity. J Proteome Res. 2018;17(4):1452–1462. doi:10.1021/acs.jproteome.7b00802
27. Zhong F, Xu M, Bruno RS, Ballard KD, Zhu J. Targeted high performance liquid chromatography tandem mass spectrometry-based metabolomics differentiates metabolic syndrome from obesity. Exp Biol Med. 2015;29(8):773–780. doi:10.1177/1535370217694098
28. Gao X, Zhang W, Wang Y, et al. Serum metabolic biomarkers distinguish metabolically healthy peripherally obese from unhealthy centrally obese individuals. Nutr Metab. 2016;13:1. doi:10.1186/s12986-016-0095-9
29. Allam-Ndoul B, Guénard F, Garneau V, et al. Association between Metabolite profiles, metabolic syndrome and obesity status. Nutrients. 2016;8(6):6. doi:10.3390/nu8060324
30. Ni Y, Zhao L, Yu H, et al. Circulating unsaturated fatty acids delineate the metabolic status of obese individuals. EBioMed. 2015;2(10):1513–1522.
31. Chen HH, Tseng YJ, Wang SY, et al. The metabolome profiling and pathway analysis in metabolic healthy and abnormal obesity. Int j Obesity. 2015;39(8):1241–1248.
32. Perreault M, Zulyniak MA, Badoud F, et al. A distinct fatty acid profile underlies the reduced inflammatory state of metabolically healthy obese individuals. PLoS One. 2014;9(2):e88539.
33. Cheng S, Wiklund PK, Pekkala S, et al. Serum metabolic profiles in overweight and obese women with and without metabolic syndrome. Diabetol Metab Syndr. 2014;6:1.
34. Böhm A, Halama A, Meile T, et al. Metabolic signatures of cultured human adipocytes from metabolically healthy versus unhealthy obese individuals. PLoS One. 2014;9:4.
35. Badoud F, Lam KP, DiBattista A, et al. Serum and adipose tissue amino acid homeostasis in the metabolically healthy obese. J Proteome Res. 2014;13(7):3455–3466.
36. Batch BC, Shah SH, Newgard CB, et al. Branched chain amino acids are novel biomarkers for discrimination of metabolic wellness. Metabolism. 2013;62(7):961–969.
37. Rousseau M, Guénard F, Garneau V, et al. Associations between dietary protein sources, plasma BCAA and short-chain acylcarnitine levels in adults. Nutrients. 2019;11:1.
38. Haufe S, Witt H, Engeli S, et al. Branched-chain and aromatic amino acids, insulin resistance and liver specific ectopic fat storage in overweight to obese subjects. Nutr Metabol Cardiovasc Dis. 2016;26(7):637–642.
39. Yoon MS. The emerging role of branched-chain amino acids in insulin resistance and metabolism. Nutrients. 2016;8:7.
40. Lynch CJ, Adams SH. Branched-chain amino acids in metabolic signalling and insulin resistance. Nat Rev Endocrinol. 2014;10(12):723–736.
41. Krebs M, Brehm A, Krssak M, et al. Direct and indirect effects of amino acids on hepatic glucose metabolism in humans. Diabetologia. 2003;46(7):917–925.
42. Wang TJ, Larson MG, Vasan RS, et al. Metabolite profiles and the risk of developing diabetes. Nat Med. 2011;17(4):448–453.
43. Lotta LA, Scott RA, Sharp SJ, et al. Genetic predisposition to an impaired metabolism of the branched-chain amino acids and risk of type 2 diabetes: a mendelian randomisation analysis. PLoS Med. 2016;13(11):e1002179.
44. Ruiz-Canela M, Guasch-Ferré M, Toledo E, et al. Plasma branched chain/aromatic amino acids, enriched Mediterranean diet and risk of type 2 diabetes: case-cohort study within the PREDIMED Trial. Diabetologia. 2018;61(7):1560–1571.
45. Houttu N, Mokkala K, Laitinen K. Overweight and obesity status in pregnant women are related to intestinal microbiota and serum metabolic and inflammatory profiles. Clin nutr. 2018;37(6 Pt A):1955–1966.
46. Li J, Cao YF, Sun XY, et al. Plasma tyrosine and its interaction with low high-density lipoprotein cholesterol and the risk of type 2 diabetes mellitus in Chinese. J Diabetes Investig. 2019;10(2):491–498.
47. Gaggini M, Carli F, Rosso C, et al. Altered amino acid concentrations in NAFLD: impact of obesity and insulin resistance. Hepatology. 2018;67(1):145–158.
48. Cheng S, Rhee EP, Larson MG, et al. Metabolite profiling identifies pathways associated with metabolic risk in humans. Circulation. 2012;125(18):2222–2231.
49. Müller WA, Faloona GR, Unger RH. The effect of alanine on glucagon secretion. J Clin Invest. 1971;50(10):2215–2218.
50. Wewer Albrechtsen NJ, Færch K, Jensen TM, et al. Evidence of a liver-alpha cell axis in humans: hepatic insulin resistance attenuates relationship between fasting plasma glucagon and glucagonotropic amino acids. Diabetologia. 2018;61(3):671–680.
51. Adams SH. Emerging perspectives on essential amino acid metabolism in obesity and the insulin-resistant state. Adv Nutrition. 2011;2(6):445–456.
52. Irving BA, Carter RE, Soop M, et al. Effect of insulin sensitizer therapy on amino acids and their metabolites. Metabolism. 2015;64(6):720–728.
53. Liu JJ, Movassat J, Portha B. Emerging role for kynurenines in metabolic pathologies. Curr Opin Clin Nutr Metab Care. 2019;22(1):82–90.
54. Rojas DR, Kuner R, Agarwal N. Metabolomic signature of type 1 diabetes-induced sensory loss and nerve damage in diabetic neuropathy. J Mol Med. 2019;97(6):845–854.
55. Korbecki J, Bajdak-Rusinek K. The effect of palmitic acid on inflammatory response in macrophages: an overview of molecular mechanisms. Inflammation Res. 2019;68(11):915–932.
56. Sethom MM, Fares S, Feki M, et al. Plasma fatty acids profile and estimated elongase and desaturases activities in Tunisian patients with the metabolic syndrome. Prostaglandins Leukot Essent Fatty Acids. 2011;85(3–4):137–141.
57. Fatima S, Hu X, Gong RH, et al. Palmitic acid is an intracellular signaling molecule involved in disease development. Cell Mol Life Sci. 2019;76(13):2547–2557.
58. Zhao L, Ni Y, Yu H, et al. Serum stearic acid/palmitic acid ratio as a potential predictor of diabetes remission after Roux-en-Y gastric bypass in obesity. FASEB J. 2017;31(4):1449–1460.
59. Brown TJ, Brainard J, Song F, Wang X, Abdelhamid A, Hooper L. Omega-3, omega-6, and total dietary polyunsaturated fat for prevention and treatment of type 2 diabetes mellitus: systematic review and meta-analysis of randomised controlled trials. BMJ. 2019;366:l4697.
60. Würtz P, Havulinna AS, Soininen P, et al. Metabolite profiling and cardiovascular event risk: a prospective study of 3 population-based cohorts. Circulation. 2015;131(9):774–785.
61. Zong G, Ye X, Sun L, et al. Associations of erythrocyte palmitoleic acid with adipokines, inflammatory markers, and the metabolic syndrome in middle-aged and older Chinese. Am J Clin Nutr. 2012;96(5):970–976.
62. Mayneris-Perxachs J, Guerendiain M, Castellote AI, et al. Plasma fatty acid composition, estimated desaturase activities, and their relation with the metabolic syndrome in a population at high risk of cardiovascular disease. Clin nutr. 2014;33(1):90–97.
63. Malodobra-Mazur M, Cierzniak A, Dobosz T. Oleic acid influences the adipogenesis of 3T3-L1 cells via DNA Methylation and may predispose to obesity and obesity-related disorders. Lipids Health Dis. 2019;18(1):230.
64. Guo XF, Li X, Shi M, Li D. n-3 polyunsaturated fatty acids and metabolic syndrome risk: a meta-analysis. Nutrients. 2017;9:7.
65. Rasic-Milutinovic Z, Perunicic G, Pljesa S, et al. Effects of N-3 PUFAs supplementation on insulin resistance and inflammatory biomarkers in hemodialysis patients. Ren Fail. 2007;29(3):321–329.
66. Tavazzi L, Maggioni AP, Marchioli R, et al. Effect of n-3 polyunsaturated fatty acids in patients with chronic heart failure (the GISSI-HF trial): a randomised, double-blind, placebo-controlled trial. Lancet. 2008;372(9645):1223–1230.
67. Siscovick DS, Barringer TA, Fretts AM, et al. Omega-3 polyunsaturated fatty acid (fish oil) supplementation and the prevention of clinical cardiovascular disease: a science advisory from the american heart association. Circulation. 2017;135(15):e867–e884.
68. Newgard CB, An J, Bain JR, et al. A branched-chain amino acid-related metabolic signature that differentiates obese and lean humans and contributes to insulin resistance. Cell Metab. 2009;9(4):311–326.
69. Mai M, Tönjes A, Kovacs P, Stumvoll M, Fiedler GM, Leichtle AB. Serum levels of acylcarnitines are altered in prediabetic conditions. PLoS One. 2013;8(12):e82459.
70. Aichler M, Borgmann D, Krumsiek J, et al. N-acyl taurines and acylcarnitines cause an imbalance in insulin synthesis and secretion provoking β cell dysfunction in type 2 diabetes. Cell Metab. 2017;25(6):1334–1347.e1334.
71. Koves TR, Ussher JR, Noland RC, et al. Mitochondrial overload and incomplete fatty acid oxidation contribute to skeletal muscle insulin resistance. Cell Metab. 2008;7(1):45–56.
72. Rauschert S, Uhl O, Koletzko B, Hellmuth C. Metabolomic biomarkers for obesity in humans: a short review. Ann Nutr Metab. 2014;64(3–4):314–324.
73. Caleyachetty R, Thomas GN, Toulis KA, et al. Metabolically healthy obese and incident cardiovascular disease events among 3.5 million men and women. J Am Coll Cardiol. 2017;70(12):1429–1437.
74. Bell JA, Kivimaki M, Hamer M. Metabolically healthy obesity and risk of incident type 2 diabetes: a meta-analysis of prospective cohort studies. Obesity Rev. 2014;15(6):504–515.
75. Lee SK, Kim SH, Cho GY, et al. Obesity phenotype and incident hypertension: a prospective community-based cohort study. J Hypertens. 2013;31(1):145–151.
76. Ruiz JR, Ortega FB, Labayen I. A weight loss diet intervention has a similar beneficial effect on both metabolically abnormal obese and metabolically healthy but obese premenopausal women. Ann Nutr Metab. 2013;62(3):223–230.
 © 2021 The Author(s). This work is published and licensed by Dove Medical Press Limited. The
full terms of this license are available at https://www.dovepress.com/terms
and incorporate the Creative Commons Attribution
- Non Commercial (unported, 3.0) License.
By accessing the work you hereby accept the Terms. Non-commercial uses of the work are permitted
without any further permission from Dove Medical Press Limited, provided the work is properly
attributed. For permission for commercial use of this work, please see paragraphs 4.2 and 5 of our Terms.
© 2021 The Author(s). This work is published and licensed by Dove Medical Press Limited. The
full terms of this license are available at https://www.dovepress.com/terms
and incorporate the Creative Commons Attribution
- Non Commercial (unported, 3.0) License.
By accessing the work you hereby accept the Terms. Non-commercial uses of the work are permitted
without any further permission from Dove Medical Press Limited, provided the work is properly
attributed. For permission for commercial use of this work, please see paragraphs 4.2 and 5 of our Terms.