Back to Journals » Diabetes, Metabolic Syndrome and Obesity » Volume 13
Metabolic Syndrome Among Working Adults in Eastern Ethiopia
Authors Motuma A ![]() , Gobena T
, Gobena T ![]() , Teji Roba K
, Teji Roba K ![]() , Berhane Y
, Berhane Y ![]() , Worku A
, Worku A
Received 22 September 2020
Accepted for publication 26 November 2020
Published 14 December 2020 Volume 2020:13 Pages 4941—4951
DOI https://doi.org/10.2147/DMSO.S283270
Checked for plagiarism Yes
Review by Single anonymous peer review
Peer reviewer comments 2
Editor who approved publication: Prof. Dr. Juei-Tang Cheng
Aboma Motuma,1 Tesfaye Gobena,2 Kedir Teji Roba,1 Yemane Berhane,3 Alemayehu Worku4
1School of Nursing and Midwifery, College of Health and Medical Sciences, Haramaya University, Harar, Ethiopia; 2Department of Environmental Health Science, College of Health and Medical Sciences, Haramaya University, Harar, Ethiopia; 3Department of Epidemiology and Biostatistics, Addis Continental Institute of Public Health, Addis Ababa, Ethiopia; 4Department of Epidemiology and Biostatistics, School of Public Health, Addis Ababa University, Addis Ababa, Ethiopia
Correspondence: Aboma Motuma
School of Nursing and Midwifery, College of Health and Medical Sciences, Haramaya University, P.O. Box: 235, Harar, Ethiopia
Tel +251921454975
Fax +251256668081
Email [email protected]
Purpose: Metabolic syndrome (MetS) has become a public health challenge in low-income countries due to changing lifestyle and the food environment. However, studies on the prevalence of metabolic syndrome and associated factors are limited in Ethiopia. Therefore, this study assessed the prevalence of MetS and its associated factors among working adults in eastern Ethiopia.
Methods: A cross-sectional study was conducted involving 1,164 working adults from December 2018 to February 2019. Data were collected following the World Health Organization (WHO) STEPwise approach. The data collection tools include a structured questionnaire, anthropometric, and biochemical measurements. Prevalence was calculated using International Diabetes Federation criteria. A Poisson regression model with robust variance estimation was used to investigate the independent variable’s association with MetS. An adjusted prevalence ratio with 95% confidence interval was reported to show associations.
Results: The prevalence of MetS was 20.1% (95% CI=17.8– 22.4) among the participants. It was more prevalent among females (APR:=1.62, 95% CI=1.31– 2.00), those of 35– 44 years of age (APR:=3.14, 95% CI=1.19– 8.28), 45– 54 years of age (APR=4.42, 95% CI=1.66– 11.77), and 55– 64 years of age (APR=6.03, 95% CI=2.27– 16.06), khat chewers (APR=1.30, 95% CI=1.06– 1.60), those with 8 or more hours of sedentary behavior (APR=2.29, 95% CI=1.88– 2.80), and those consuming alcohol 5– 6 days per week (APR=1.81, 95% CI=1.20– 2.74). The prevalence was significantly lower in those eating five or more fruits and vegetables servings per day (APR=0.04, 95% CI=0.01– 0.27).
Conclusion: A high prevalence of MetS was observed among working adults in eastern Ethiopia. Strengthening workplace health promotion programs is necessary to reduce the negative consequences of MetS in workplaces and protect productivity.
Keywords: prevalence, associated factors, metabolic syndrome, working adults, Ethiopia
Introduction
Metabolic syndrome (MetS) is globally recognized as a significant public health challenge and a threat to socio-economic developments.1 MetS consists of clusters of several physical or biochemical risk factors which include overweight or obesity, inactive lifestyle, and insulin resistance.2 Evidence exists that individuals with MetS are at a higher risk of developing cardiovascular diseases and diabetes.3 The core components of MetS are hyperglycemia, central obesity, dyslipidemia, and elevated blood pressure.1
The global prevalence of MetS is highly dependent on race, age, and gender.4 The MetS used to be considered a problem of high-income countries until recently. As recent studies reveal, however, the indicated high prevalence of MetS in low- and middle-income countries is due to the epidemiologic transition, urbanization, and lifestyle.5 Urbanization leads to increased consumption of high-energy processed diets, limited physical activities, increased tobacco smoking, and increased consumption of alcohol in sub-Saharan Africa.6
An accelerated nutritional transition (consumption of calorie-dense foods), increased sedentary lifestyle, and a parallel increase in obesity were observed in Ethiopia.7 In addition, the demographic transition with a more aging population is also contributing to the high prevalence of MetS.8 A study in north Ethiopia among young men and women indicated that the risk factors for MetS are more common in urban dwellers than rural residents.9,10 The study also showed that 26% of adults were overweight.9 Other common risk factors in Ethiopia include hypertension, physical inactivity, and abdominal obesity.9,–11–13
Few studies have determined the prevalence of MetS among the working population in Ethiopia. For instance, a study conducted in Addis Ababa involving bank workers and teacher of government schools found that the prevalence of Mets was 17.9% based on International Diabetes Federation (IDF) definitions.14 A recent study involving working adults in north Ethiopia has identified a high prevalence of 40% of MetS among public employees.9 Despite the widespread recognition of the problem, the predictors of MetS are not widely known in the working adults in Ethiopia. Therefore, the current study aimed to assess the prevalence and associated factors of MetS among working adults in eastern Ethiopia.
Materials and Methods
Study Setting and Period
The study was conducted on permanent employees of Haramaya University in eastern Ethiopia, which is one of the largest employers in the region. Haramaya University is a public institution and offers all kinds of jobs to provide academic, research, and lodging services to its students and staff members. The university staff constitute a working segment of the population. The university has 7,176 employees (28.1% females and 71.9% males), of which 1,500 (21.1%) are academic and 5,676 (78.9%) are administrative.15 The university has nine colleges, one institute, and four special clinics for students and employees. The university also runs a specialized referral hospital affiliated to the College of Health and Medical Sciences. The university was suitable for this study because of its amount of employees and the diversity of jobs, ranging from high level academic work to the low level manual work. In addition, the population was logistically easy to capture and perform follow-up studies in the future, if possible. This study was conducted from December 1, 2018 to February 29, 2019.
Study Design and Population
A cross-sectional study was conducted among permanent employees of Haramaya University in eastern Ethiopia. The study involved all employees who worked for at least for 6 months at the university. All departments and units of the university were considered for the study. The study participants were selected from each unit proportional to the size of their respective department staff size. In each unit, the study participants were selected randomly using the payroll roster as the sampling frame. The sample size was calculated using Open Epi 3.1 based on a single population proportion formula by considering the prevalence of MetS 17.9% according to IDF criteria taken from a study conducted in Ethiopia.14 Assuming a 95% confidence level, a margin of error of 2%, and a 5% non-response rate, the calculated sample size was 1,200.
Data Collection
Data were collected through face-to-face interviews using structured questionnaires adopted from the WHO STEPS manual.16 The tool allowed us to collect study participants’ socio-demographic, behavioral, and clinical characteristics. Following the STEPS manual, questions related to substance use were tailored to reflect Ethiopia’s local context.16 The questionnaire was initially prepared in English and translated into the local languages (Amharic and Afan Oromo) by fluent speakers and back-translated into English by bilingual experts to ensure the translation’s consistency and accuracy. The questionnaire was pre-tested at another nearby public university. Before data collection, questions and the translation were refined based on the feedback obtained during the pre-test. The data were collected and supervised by health professionals. A 5-day training was focused on the content of the questionnaire, data collection techniques, and ethical conduct of human research was offered. The field supervisors closely supervised the data collection processes and checked a sample of filled questionnaires for completeness.
Anthropometric data (weight, height, waist and hip circumference) were collected according to the WHO STEPS manual.16 Anthropometric measurements were carried out using standard procedures and calibrated instruments. Weight was measured with the participants bare footed and wearing light clothes using a digital weight scale and measuring to the nearest 0.1 kg. Height was measured using a stadiometer with the participant’s shoes and any hats or hair ornaments removed. During height measurement, the participants face away from the wall with their heels together and the back as straight as possible. The head, shoulders, buttocks, and heels should be in contact with the vertical surface. With the subject looking straight ahead, the head projection is placed at the crown of the head. The participant steps away from the wall and the height measurement is recorded to the nearest 0.1 cm. Waist circumference (WC) was measured in centimeters at the midpoint of the line between the lower margin of the last palpable rib and the top of the iliac crest (hip bone). Hip circumference was taken around the maximum circumference of the buttocks using an inelastic measuring tape.16
Blood pressure (BP) was measured using a digital measuring device (Microlife BP A50, Microlife AG, Switzerland) with participants sitting after resting for at least 5 minutes. The measurement was performed on a non-dominant hand while relaxing on a flat surface in a sitting position with back supported. Three consecutive measurements of blood pressure were taken in a 5-minute interval. The average of the last two systolic and diastolic blood pressure measurements were used for analysis.16
Six milliliters of venous blood were taken into a sterile vacuum tube (Gel Clot Activator) from study participants after 8-hours of overnight fasting. Then, the blood specimen was allowed to sit for 10–20 minutes for clot formation.17 The specimen was then centrifuged at 3,000 revolutions per minute to extract the serum which was stored at −20°C.18 A serum sample was used to examine High-Density Lipoprotein-cholesterol (HDL-c), triglyceride, and fasting blood glucose in the Haramaya University’s specialized hospital clinical chemistry laboratory using the Mindray BS-200 chemistry analyzer (Shenzen Mindray Bio-Medical electronics Co. Ltd, China).19 Fasting serum triglyceride and blood sugar were analyzed using standard enzymatic colorimetric method (HUMAN Gesellschaft fur Biochemica und Diagnostica mbH Max-Planck-Ring, Germany), while HDL-c was analyzed using direct homogenous standard enzymatic assay colorimetric test (HUMAN Gesellschaft fur Biochemica und Diagnostica mbH Max-Planck-Ring, Germany).18 Lipid profile and fasting blood glucose concentrations were reported in mg/dL.17 The proper functioning of instruments, laboratory reagents, and technical performances were checked using quality control samples. Standard operating procedures (SOPs) were followed starting from the sample collection up to result reporting.17 All laboratory procedures were handled by laboratory technologists. Normal and pathological quality control materials were run every day to detect any analytical errors and validate the laboratory values.17 Blood serum for fasting blood glucose and lipid analysis were kept and stored at −80°C in a refrigerator after processed.
Variables and Measurements
The outcome variable MetS was assessed using the WHO STEPS manual for non-communicable diseases surveillance in developing countries.16 The prevalence of MetS was measured using IDF criteria if participants had 1) central obesity (waist circumference ≥94 cm in males and ≥80 cm in females) plus two of any of the following components of MetS: 2) Triglycerides ≥150 mg/dL, 3) reduced HDL-C (<40 mg/dL in males and <50 mg/dL in females), 4) high BP (systolic BP ≥130 or diastolic BP ≥85 mmHg), and 5) increased fasting plasma glucose ≥100 mg/dL.20 Measurements were assigned zero when below the lowest cut-off value and one if the measurements were at or above the cut-off value for each component of MetS. When the sum value of the components of MetS measurements were ≥2 plus waist circumference coded as one indicated the presence of MetS, while the sum value of component of MetS ≤1 plus waist circumference coded as zero and one was considered as no MetS. Then, MetS was grouped into two categories, which were coded as one “yes” and zero “no”.
The study subjects’ age was recorded based on their response and categorized into 19–24 years, 25–34 years, 35–44 years, 45–54 years, and 55–64 years of age groups based on WHO STEPwise.16 Education was categorized as less than or equal to grade 8, grade 9–12, college educated, and postgraduate, with codes as 0, 1, 2, and 3, respectively. Occupational roles of this institution are delineated into two categories by the Human Resource Office: labor physical efforts and heavy manual work, and office work involved in desk work, research, teaching, or both. The study participants’ income cut-off was set to roughly correspond to the poverty line in accordance with the World Bank.21
Smoking status was categorized as never smoker, former smoker, and current smoker. The average serving of fruits and vegetables per day was categorized into no servings, 1–2 servings, 3–4 servings, five or more servings. Alcohol consumption was measured based on the WHO STEPwise approach.16 In this study, we asked participants, “Have you ever consumed any alcohol, beer, wine, spirits, beherawi, and homemade alcohol (local made) like teji, arake (katikalla), tella, and bordie during the past 12 months?“
If the answer was yes, we asked them “How frequently have you had at least one standard alcoholic drink?” For those participants that only consumed a few sips of alcohol during the past 12 months, the answer was considered “never”. If they respond with yes, they were asked how frequently they had at least one standard alcohol drink (<1, 1–4, 5–6, 7 consumption days per week).16
Khat (catha edulis) is a plant which contains the alkaloid cathinone and chemicals that are similar to amphetamines usually consumed by chewing the green leaf, which is commonly used for excitement and social recreations in East African countries.22 Khat is a strong stimulant that causes mild-to-moderate psychological dependence, although not as strong as that of alcohol or tobacco, and it can have serious health and economic problems.23 Study participants were asked about khat chewing at the time of survey, with “yes or no” questions.
The physical activity level was assessed by computing metabolic equivalent (MET)-minutes per week for vigorous intensity physical activity, moderate intensity physical activity, and walking. The sum MET-minutes per week was categorized as high (above 3,000 MET-minutes), moderate (between 2,999 and 600 MET-minutes), and low (less than 600 MET-minutes).16 Body mass index was calculated as weight in kilograms over height in meters squared, and was categorized according to WHO criteria (underweight: BMI<18.5 kg/m2; normal: BMI=18.5–24.9 kg/m2; overweight: BMI=25.0–29.9 kg/m2; and obese: BMI≥30.0 kg/m2).16
Sedentary behavior was measured using the Sedentary Behavior Questionnaire (SBQ), which contains nine items.24 It was measured based on the weekdays and weekends and was analyzed separately with weighted values (5x for weekdays sitting and 2x for weekends sitting, divided by 7) to obtain an accurate estimate for total sedentary behavior per day.24 Sedentary behavior was coded as zero for less than 8 hours per day, or coded as one for 8 hours or above per day. Dietary diversity intake was measured using the dietary diversity questionnaire.25 The value was computed by summing up what was consumed of the nine food groups in the last 24 hours.25 Thus, the dietary diversity score ranged from 0–9. We used a Food and Agriculture Organization (FAO) recommended cut-off point, which is the mean dietary diversity score. Accordingly, <6.25 was coded as zero, and ≥6.25 was coded as one.25
Statistical Analysis
Data were cleaned, coded, and entered by using EPiData Version 3.1 software and analyzed by using STATA version 14 (Stata Corp, USA) statistical software. The outcome variable was dichotomized as MetS=1 (yes) and MetS=0 (no). Factors associated with MetS were examined using the Poisson regression analysis model with robust variance estimation. The backward regression was fitted with selected socio-demographic and lifestyle variables. The results were reported as adjusted prevalence ratios (APRs) with 95% CI. The statistical level of significance was set at alpha=5%. The explanatory variables were tested for multi-collinearity before taking them into multivariable models using correlation matrix for the regression coefficients, using the standard errors, and variance inflation factors value. Possible interactions between covariates were tested. Akaike’s and Bayesian information criterion were used to test for model fitness.
Ethical Considerations
This study was conducted following the principles of the Declaration of Helsinki and the study protocol was approved by the Institutional Health Research Ethics Review Committee (IHRERC) of the Colleges of Health and Medical Sciences (CHMS), Haramaya University (Ref. No. IHRERC/196/2018). All participants were well informed about the study and written informed consent was obtained from each study participant before data collection. An explanation was given to the study subjects on the study procedure, risk, benefit, confidentiality, and about their right to withdraw from the study at any point. Individuals with high blood pressure, hyperglycemia, and hyperlipidemia were advised to visit the university clinic for further investigation and appropriate management.
Results
Socio-Demographic Characteristics of Study Participants
A total of 1,200 study participants were invited for this study, and 1,164 consented to participate, with a 97% response rate. Of the 1,164 consented individuals, 409 (35.1%) were manual workers and 755 (64.9%) were office workers. Females constitute 566 (48.6%); 722 (62.0%) were Orthodox Christians; 739 (63.5%) had at least diploma level college education, and 667 (57.3%) were married (Table 1).
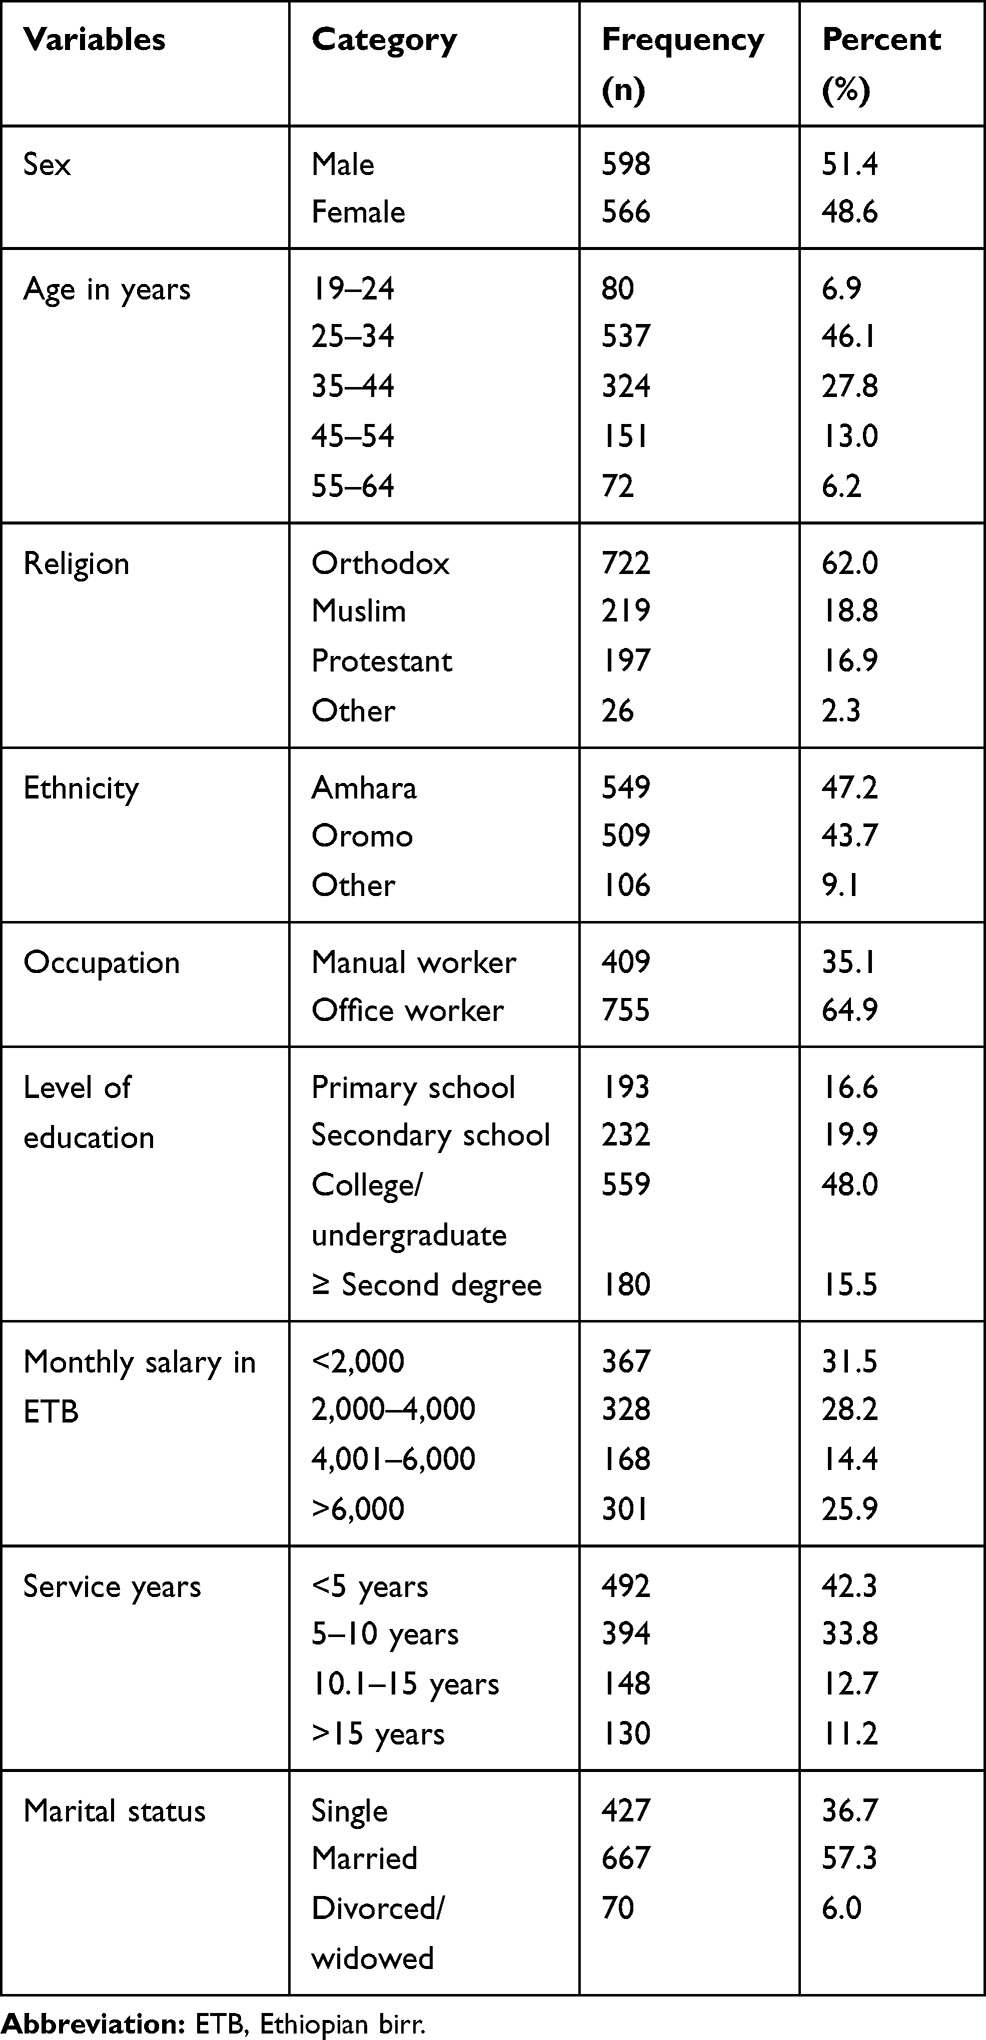 |
Table 1 Socio-Demographic Characteristics of the Study Participants (N=1,164) |
Lifestyle and Behavioral Characteristics
As Table 2 indicates, most of the participants (638, 54.8%) were normal weight, while 305 (26.2%) were overweight. Of the 1,164 consented individuals 108 (9.3%) were obese, out of which 80 (14.1%) were females. Regarding smoking status, 59 (5.1%) reported being current smokers, out of which 56 (94.9%) were males. About 28 (2.4%) of the participants reported daily alcohol consumption during the past years, out of which 19 (3.2%) were males and nine (1.6%) were females. Similarly, 236 (20.3%) of the participants reported that they had sedentary behavior. Regarding khat chewing, the overall prevalence of khat chewing during a life time was 396 (34.0%), out of which 285 (72.0%) were males, and 111 (28.0%) were females. Out of the total study participants, 93 (8.0%) reported consuming five or more servings of fruits and vegetables per day (Table 2).
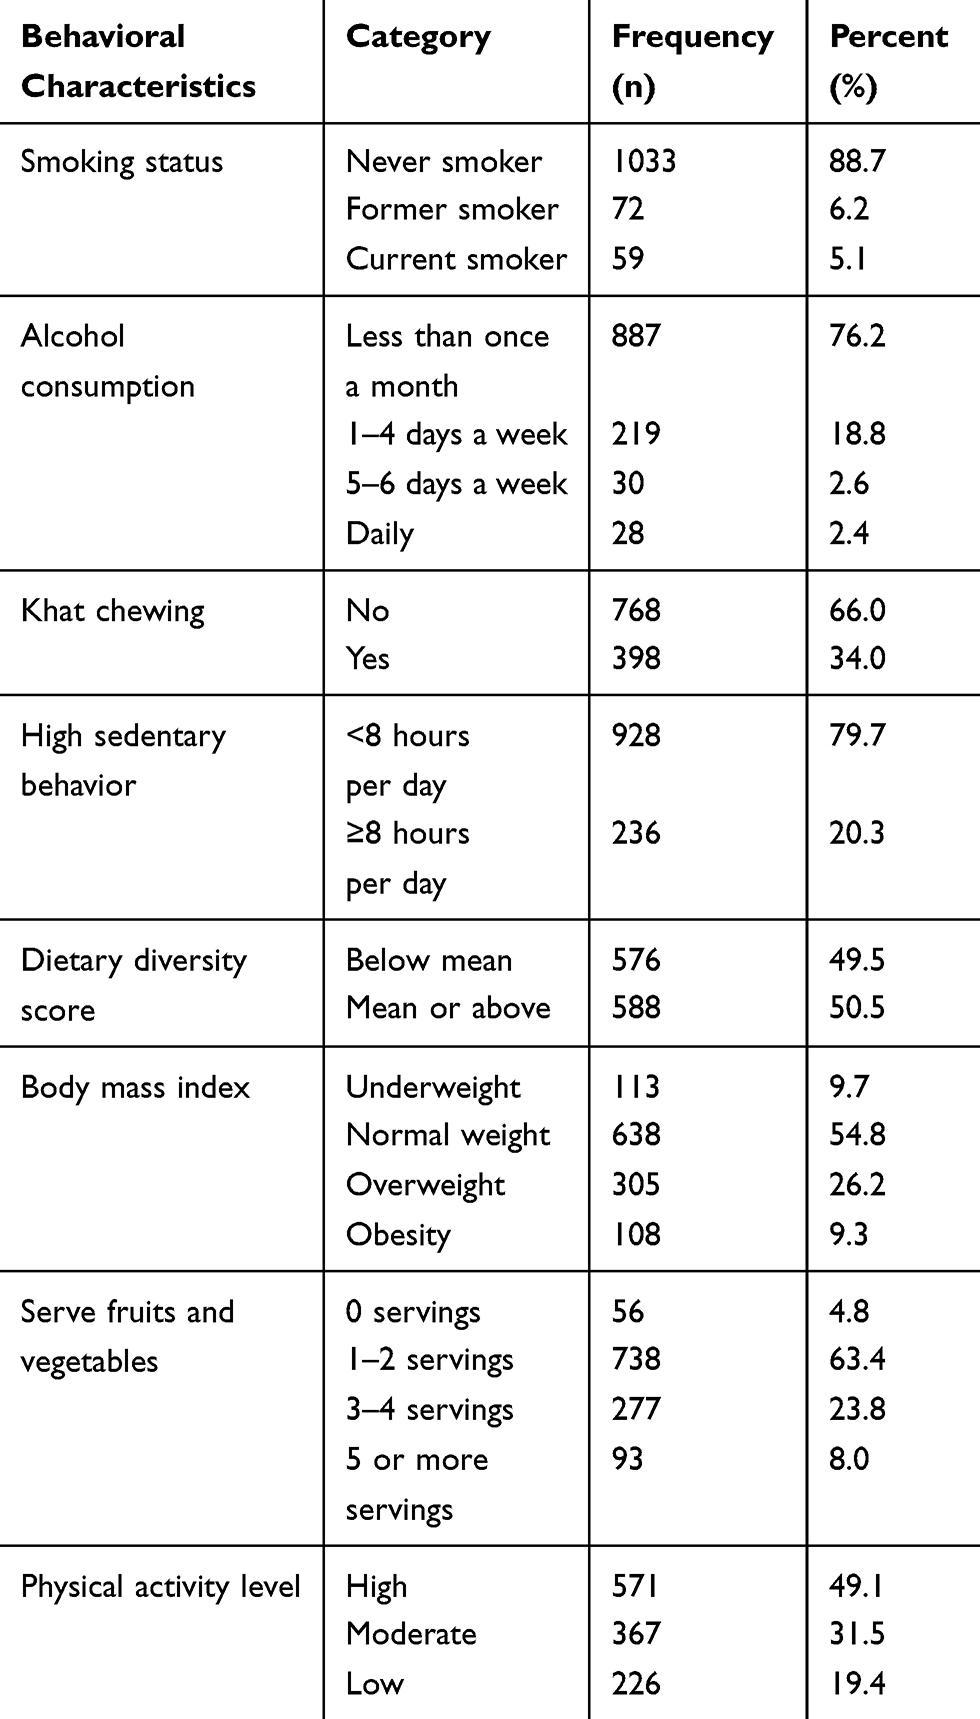 |
Table 2 Lifestyle and Behavioral Characteristics Among Working Adults in Eastern Ethiopia, 2020 (n=1,164) |
Prevalence of Metabolic Syndrome and Its Components
Using the IDF criteria, the prevalence of MetS was 20.1% among the participants, out of which 23.5% were females and 16.9% were males (Figure 1). The prevalence of MetS was 83 (35.5%) among the age group of 35–44 years followed by the age group of 45–54 years, 69 (29.5%) (Figure 2). The mean age of individuals with MetS was 42 (±9.4) years compared to those without MetS 33.7 (±8.8) years. The components of MetS were summarized in Figure 3. Accordingly, out of the five components of MetS abdominal obesity was 545 (46.8%), high blood pressure was 468 (40.2%), and elevated triglyceride was 379 (32.6%) (Figure 3).
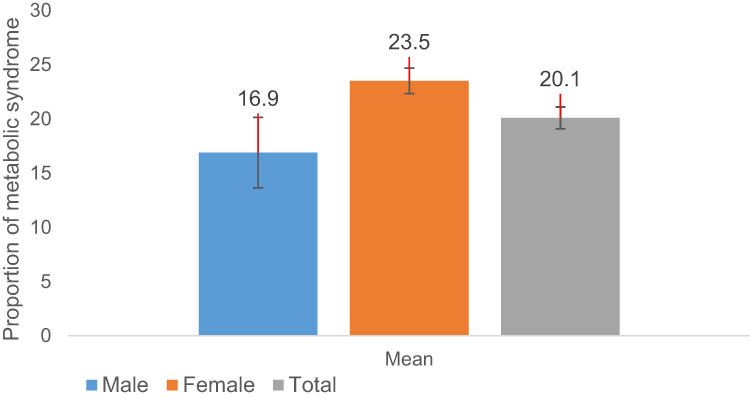 |
Figure 1 Proportion of metabolic syndrome by sex among working adults in Haramaya University Eastern Ethiopia (n=1,164), 2020. Notes: Blue bars represents males; read bars represents females; gray bars represents overall participants. |
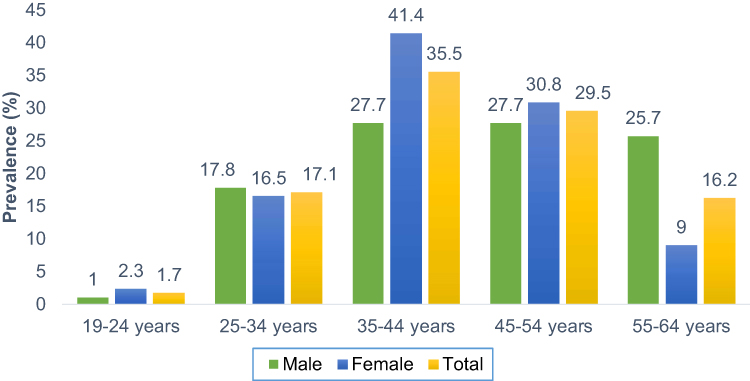 |
Figure 2 Prevalence of metabolic syndrome by age groups and sex among working adults in Haramaya University, Eastern Ethiopia (n=1,164), 2020. Notes: Green bars represents males; blue bars represents females; yellow bars represents overall participants. |
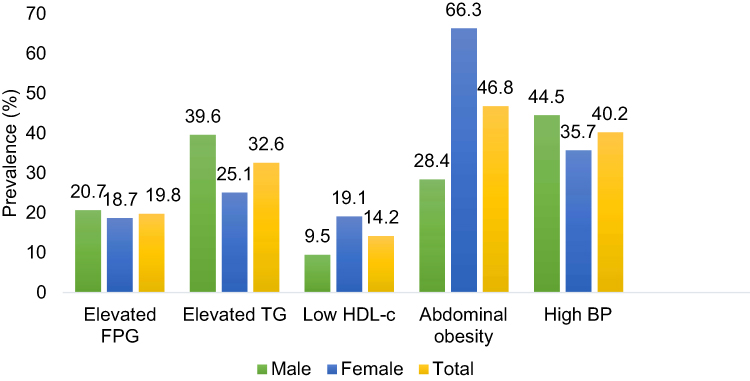 |
Figure 3 Prevalence of metabolic syndrome components by gender among working adults in Haramaya University Eastern Ethiopia according to the criteria of the IDF (n=1,164), 2020. Abbreviations: Elevated FPG, elevated fasting plasma sugar; Elevated TG, elevated triglyceride; Low HDL_c, low high density lipoprotein cholesterol; High BP, high blood pressure; IDF, international diabetes federation. Notes: Green bars represent males; blue bars represent females; yellow bars represent overall participants. |
Factors Associated with MetS Among the Participants
In a multivariable analysis, the prevalence of MetS was higher among the females (APR=1.62, 95% CI=1.31–2.00), older ages (APR=6.03, 95% CI=2.27–16.06), khat chewers (APR=1.30; 95% CI=1.06–1.60), those with sedentary behaviors (APR=2.29; 95% CI=1.88–2.80), and daily alcohol consumers (APR=1.57; 95% CI=1.16–2.13). MetS prevalence was significantly lower among those who reported consuming five or more servings of fruits and vegetables (APR=0.04; 95% CI=0.01–0.27) (Table 3).
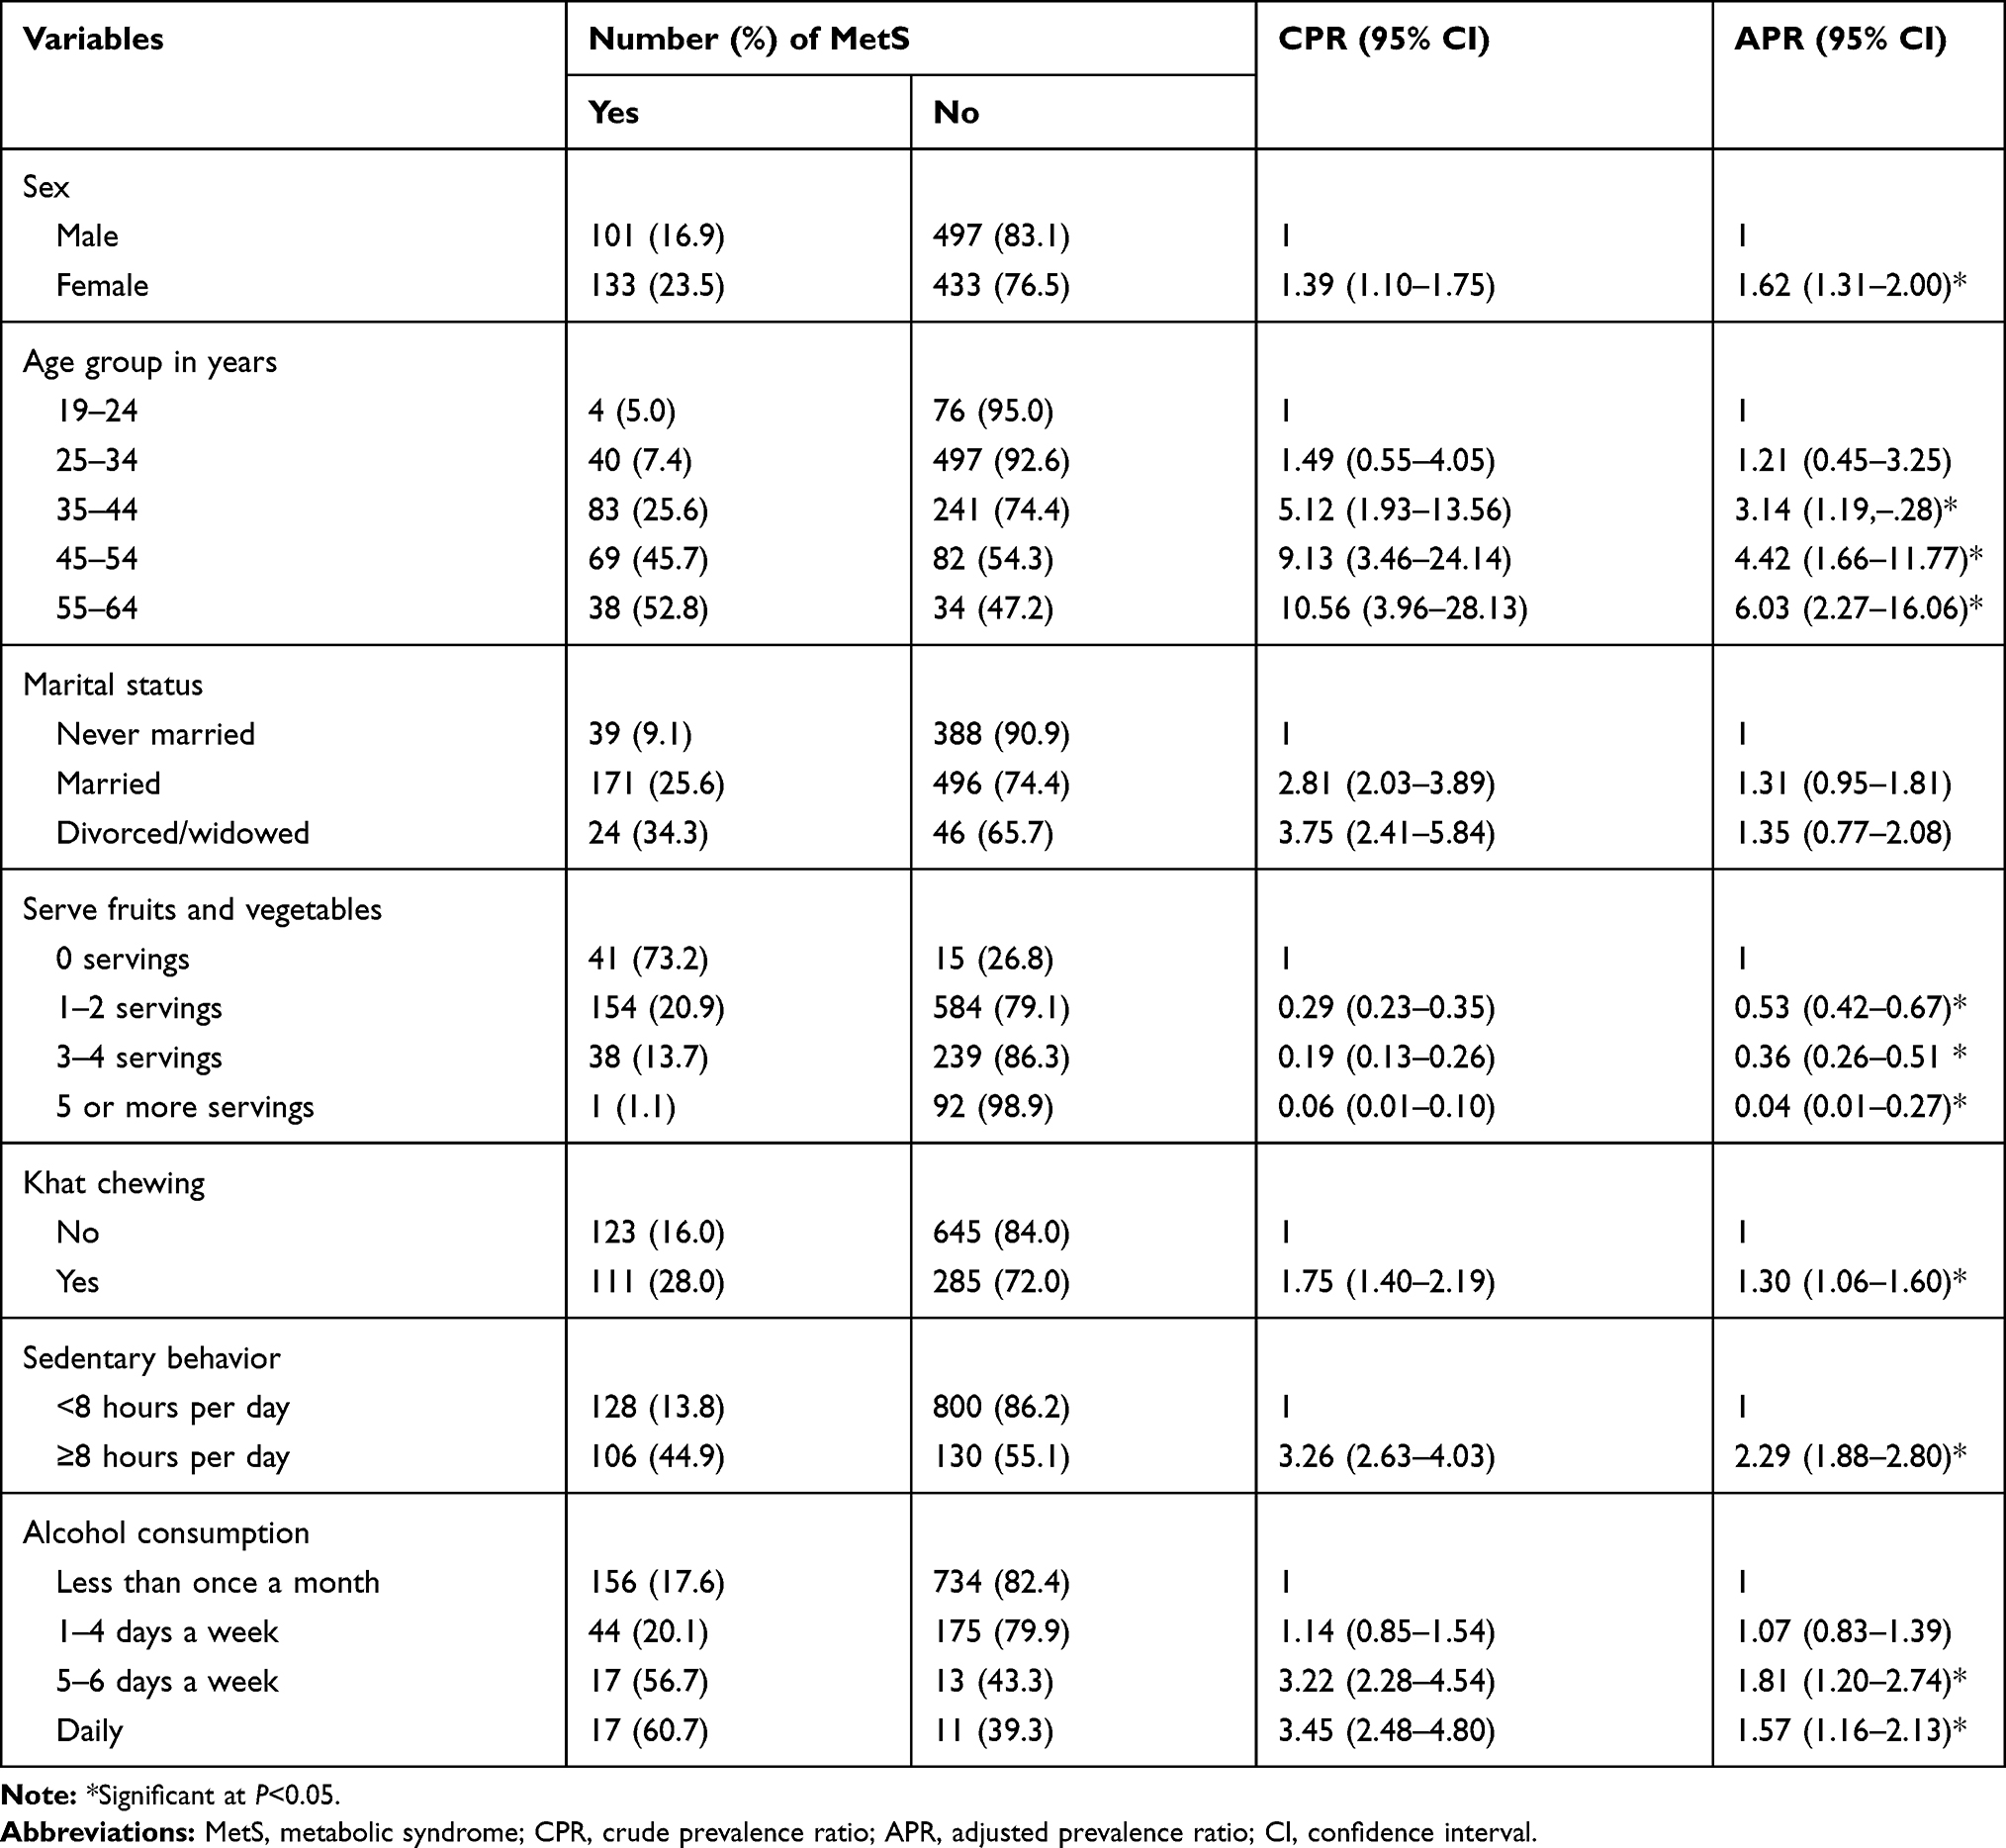 |
Table 3 Factors Associated with Metabolic Syndrome Among Working Adults in Eastern Ethiopia (n=1,164), 2020 |
Discussion
The study found a high prevalence of MetS in the study population. The prevalence was higher among females, older ages, khat chewers, those with sedentary behaviors, and consumers of alcohol regularly compared to their comparison groups, while MetS prevalence was low among individuals who reported consuming five or more servings of fruits and vegetables daily.
Using IDF criteria, the prevalence of MetS among the study population was 20.1%, which is much higher than a prevalence of 17.9% reported in Addis Ababa involving bank workers and teachers in Ethiopia.14 The finding of the current study is consistent with the pooled review among a healthy adult population in Ghana with the mean age of 36.7 years and a cross-sectional study conducted in Nigeria involving teachers and bank workers that found an incidence of 20–21.5% in working adults.26,27 The prevalence of MetS in the working adults was much higher than the prevalence of 4.8% reported in a national survey in Ethiopia,10 but the national survey had 88.5% of participants from rural areas. The high prevalence of MetS in our study could be due to a more sedentary lifestyle, increased pressure from the high work load, and changes in dietary patterns.28,29 The high prevalence of overweight and obesity in the study population is consistent with other studies in Ethiopia among university employees.30 Nevertheless, the MetS prevalence we observed was lower than the average prevalence for working adults in sub-Saharan African countries.3,9,31 The difference could be due to the age variation of the study populations. For instance, in our study population, most of the participants (53.0%) were younger than 35 years of age. A previous study in Cameroon among working adults in a local enterprise comprised a mean age of 45.5 years with a range of 23–62 years, and a small sample size.3 Similarly, in a previous study in Mekelle, Ethiopia, the mean age of the study population was 40 years among public office workers within a range of 25–65 years.9 On the contrary, a recent study conducted on employees of a commercial company in Togo shows the mean age of the study population was 45 years with a small sample size.31 In addition, the inconsistencies could be due to differences in methodological, socio-cultural, and dietary habits.
In this study the most prevalent componentsof MetS were increased waist circumference, elevated blood pressure, and high triglycerides, which are consistent with previous studies reported in sub-Saharan Africa.3,32,33 Blood pressure, fasting plasma glucose level, and triglyceride component of MetS were higher in men compared to women; however, waist circumference and low HDL-c were higher among women. This work is in line with a study reported in Nigeria.27
The high prevalence of MetS among females was previously reported in the African populations.34–37 In the African population the waist circumference is a crucial determinant factor of MetS.38 Females are seldom allowed to do physical exercise in Ethiopia. They are supposed to stay home, look after children, and take care of household chores. One possible reason for abdominal obesity among women could be the post-delivery high-fat diet consumed along with post-partum sedentarism. Most women find it difficult to return to their pre-pregnancy weight before subsequent pregnancies.39 Another reason could be premenopausal and menopausal women are at a high risk of MetS,40 with increased risk of central obesity and insulin resistance.41
In this study the prevalence of MetS increased dramatically with age in both men and women, which corroborates with several other population studies.37,42 The result could be explained in light of the changes in body metabolism and energy expenditure in adults coupled with physical inactivity and adoption of unhealthy lifestyles such as alcohol consumption as age increases.30,43 Older age also predisposes to an increase in insulin resistant abdominal adipose tissue.31 As age increases fat is prone to be accumulated in the abdomen and releases free fatty acids into the serum, leading to higher insulin resistance, elevated serum triglyceride levels, and increased low density lipoprotein-cholesterol levels, consequently leading to a greater risk of MetS.42
In this study partcipants who consume fruits and vegetables sufficently had a lower prevalence of MetS, as previously reported in Ethiopia.37,44 Fruits and vegetables consumption provides dietary fiber and other essential nutrients that lower the risk of MetS.45 Additionally, fruits and vegetables have significant antioxidant effects which reduce the risk of MetS by removing reactive oxygen and reducing low density lipoprotiens.46
Consistent with previous studies, alcohol consumption was significantly associated with MetS in this study.44 This is because alcohol consumption tends to increase triglyceride levels and subsequently increases low HDL cholesterol level and abdominal obesity,47 and alcohol is also known to cause insulin resistance.50
The findings related to khat consumption are consistent with studies in countries where khat consumption is common; Khat chewers’ had an increased risk of developing MetS than those who did not chew.48,49 Moreover, evidence shows in Yemen khat chewing was positively associated with the level of dyslipidemia compared to non-chewers.50
The findings related to sedentary behavior are also consistent with previous studies in working adults.51,52 Sedentary behavior prompts lower energy expenditure and increases insulin resistance.53,54 Evidence indicates that increased uninterrupted sitting may be associated with impaired cardio-metabolic risks due to low energy expenditure, reduced insulin activity, and reduced skeletal muscle activity.55 Most working adults spend much of their time at work sitting; therefore, policymakers must give special attention to specific strategies to reduce sedentary time in the workplace.53
Limitations
This study is subject to certain limitations, such as social desirability bias, that may affect the reporting of lifestyle habits (smoking, khat chewing, and alcohol consumption) as they are socially unacceptable in the university community. Thus, the associations observed are likely to be underestimated. Anthropometric measurements are also prone to errors; however, this study was conducted with the highest precautions in training anthropometric data collections, equipment calibration, and standardization of procedure to minimize the possibility of errors. This study delimits the relevance of its result to working adults in eastern Ethiopia, which cannot be generalized to the general population of Ethiopia. The results of this study must be interpreted with caution as the study population was drawn only from one institution.
Conclusion
About one in five working adults in this study exhibited MetS. Being female, older age, khat chewing, alcohol consumption, and sedentary behaviors were positively associated with MetS, whereas fruits and vegetables consumption reduced MetS. Therefore, the findings support the need for designing appropriate workplace health promotion interventions to promote a healthy lifestyle and increased productivity. We recommend regularly conducting this kind of study in a representative sample to guide public health interventions.
Abbreviations
BMI, Body Mass Index; CVD, Cardiovascular Disease; HDL, High Density Lipoprotein; IDF, International Diabetes Federation; LDL, Low Density Lipoprotein; MetS, Metabolic Syndrome; TG, Triglyceride; DDS, Dietary Diversity Score.
Data Sharing Statement
All data analyzed for this article are available with the corresponding author and can be obtained on reasonable request.
Acknowledgments
The authors would like to thank Haramaya University for funding this study. We would also like to thank Hiwot Fana Specialized Teaching Hospital Laboratory Department for meticulously conducting the laboratory work. The authors also thank the study participants, data collectors, and Addis Continental Institute of Public Health (ACIPH) for their cooperation and support.
Author Contributions
All authors made substantial contributions to the conception and design of the study, acquisition, analysis, and interpretation of data, took part in drafting the article or revising it critically for important intellectual content, and gave final approval of the version to be accountable for all aspects of the work.
Funding
This study was fully funded by Haramaya University Scientific Research Grant number (HURG-2017-02-02-05) after the proposal of the study has been defended. The funder has no role in designing the study and collection, analysis, and interpretation of data and in writing the manuscript.
Disclosure
The authors have no conflict of interest in this work.
References
1. Saklayen MG. The global epidemic of the metabolic syndrome. Curr Hypertens Rep. 2018;20(2):12. doi:10.1007/s11906-018-0812-z
2. Chen Z, Wu S, Huang J, Yuan J, Chen H, Chen Y. Metabolic syndrome increases cardiovascular risk in a population with prediabetes: a prospective study in a cohort of Chinese adults. J Diabetes Investig. 2019;10(3):673–679. doi:10.1111/jdi.12958
3. Mfeukeu-Kuate L. Prevalence of metabolic syndrome and cardiovascular risk profile in Cameroon: a cross-sectional study in a Sub-Saharan African (SSA) setting. EC Cardiol. 2018;5:596–605.
4. Kaur J. A comprehensive review on metabolic syndrome. Cardiol Res Pract. 2014;943162.
5. Misra A, Khurana L. Obesity and the metabolic syndrome in developing countries. J Clin Endocrinol Metab. 2008;93(11_supplement_1):s9–s30. doi:10.1210/jc.2008-1595
6. Assah FK, Ekelund U, Brage S, Mbanya JC, Wareham NJ. Urbanization, physical activity, and metabolic health in sub-Saharan Africa. Diabetes Care. 2011;34(2):491–496. doi:10.2337/dc10-0990
7. Baye K, Hirvonen K. Accelerating progress in improving diets and nutrition in Ethiopia. Int Food Policy Res Inst. 2020;144.
8. Admassie A, Nuru S, Megquier S. Harnessing the Demographic Dividend in Ethiopia. Popul Ref Bureau. 2017;16(08):2017.
9. Gebremariam LW, Chiang C, Yatsuya H, et al. Non-communicable disease risk factor profile among public employees in a regional city in northern Ethiopia. Sci Rep. 2018;8(1):9298. doi:10.1038/s41598-018-27519-6
10. Gebreyes YF, Goshu DY, Geletew TK, et al. Prevalence of high bloodpressure, hyperglycemia, dyslipidemia, metabolic syndrome and their determinants in Ethiopia: evidences from the National NCDs STEPS Survey, 2015. PLoS One. 2018;13(5):e0194819. doi:10.1371/journal.pone.0194819
11. Esaiyas A, Teshome T, Kassa D. Prevalence of hypertension and associate risk factors among workers at Hawassa University, Ethiopia: an institution based cross sectional study. J Vasc Med Surg. 2018;6(01):2. doi:10.4172/2329-6925.1000354
12. Tariku T, Bilal S, Tariku S, Naod F. Prevalence and factors associated with diabetes mellitus and impaired fasting glucose level among members of federal police commission residing in Addis Ababa, Ethiopia. BMC Endocr Disord. 2016;16(1):68. doi:10.1186/s12902-016-0150-6
13. Bacha YD, Roba KT, Ayele Kebede D. Type 2 diabetes mellitus among government employees in harar, Eastern Ethiopia: a cross-sectional study. 2015.
14. Tran A, Gelay B, Belaineh G, Lemma S, Berhane Y, Bekele Tamirat EA. Prevalence of metabolic syndrome among working adults in Ethiopia. Int J Hypertens. 2011;2011:1–8. doi:10.4061/2011/193719
15. Alebachew W, Semahegn A, Ali T, Mekonnen H. Prevalence, associated factors and consequences of substance use among health and medical science students of Haramaya University, eastern Ethiopia, 2018: a cross-sectional study. BMC Psychiatry. 2019;19(1):343. doi:10.1186/s12888-019-2340-z
16. WHO. WHO STEPS instrument (core and expanded). The WHO STEPwise Approach to Noncommunicable Disease Risk Factor Surveillance (STEPS). Geneva, Switzerland: The World Health Organization; 2016.
17. WHO. Laboratory Quality Management System: Handbook. World Health Organization; 2011.
18. Walsh M, Wener M. Laboratory procedure manual. Natl Health Nutr Exam Survey. 2006.
19. Li Y, Zhuang J, Huang X, et al. Performance evaluation of a new high throughput Mindray BS-2000M1 clinical chemistry system. Clin Biochem. 2014;47(12):1078–1083. doi:10.1016/j.clinbiochem.2014.03.020
20. Alberti KGMM, Zimmet P, Shaw J. Metabolic syndrome—a new world‐wide definition. A consensus statement from the international diabetes federation. Diabetic Med. 2006;23(5):469–480. doi:10.1111/j.1464-5491.2006.01858.x
21. Fosu AK. Growth, inequality and poverty in Sub-Saharan Africa: recent progress in a global context. Oxf Dev Stud. 2015;43(1):44–59. doi:10.1080/13600818.2014.964195
22. Gebissa E. Khat in the Horn of Africa: historical perspectives and current trends. J Ethnopharmacol. 2010;132(3):607–614. doi:10.1016/j.jep.2010.01.063
23. Haile D, Lakew Y, Fernandez-Reyes D. Khat chewing practice and associated factors among adults in Ethiopia: further analysis using the 2011 demographic and health survey. PLoS One. 2015;10(6):e0130460. doi:10.1371/journal.pone.0130460
24. Rosenberg DE, Norman GJ, Wagner N, Patrick K, Calfas KJ, Sallis JF. Reliability and validity of the Sedentary Behavior Questionnaire (SBQ) for adults. J Phys Act Health. 2010;7(6):697–705. doi:10.1123/jpah.7.6.697
25. Kennedy G, Ballard T, Dop MC. Guidelines for Measuring Household and Individual Dietary Diversity. Food and Agriculture Organization of the United Nations; 2011.
26. Ofori-Asenso R, Agyeman AA, Laar A. Metabolic syndrome in apparently “healthy” Ghanaian adults: a systematic review and meta-analysis. Int J Chronic Dis. 2017;2017:1–9. doi:10.1155/2017/2562374
27. Ayogu RN, Nwajuaku C, Udenta EA. Components and risk factors of metabolic syndrome among rural Nigerian workers. Niger Med J. 2019;60(2):53. doi:10.4103/nmj.NMJ_53_19
28. Yeh W-C, Chuang -H-H, Lu M-C, Tzeng I-S, Chen J-Y. Prevalence of metabolic syndrome among employees of a taiwanese hospital varies according to profession. Medicine. 2018;97(31):e11664. doi:10.1097/MD.0000000000011664
29. CheSerek MJ, Wu G-R, Shen L-Y, ShI Y-H, Le G-W. Disparities in the prevalence of metabolic syndrome (MS) and its components among university employees by age, gender and occupation. J Clin Diagn Res. 2014;8(2):65.
30. Janakiraman B, Abebe SM, Chala MB, Demissie SF. Epidemiology of general, central obesity and associated cardio-metabolic risks among University Employees, Ethiopia: a cross-sectional study. Diabetes Metabol Syndr Obes. 2020;13:343. doi:10.2147/DMSO.S235981
31. Hinson AV, Kpata S, Mikponhoue R, Adjobimey M, Ayelo P, Fayomi B. Prevalence of metabolic syndrome and its associated factors among the employees of a commercial company in Togo. SciFed J Public Health. 2017;1(2).
32. Kruger MJ, Nell TA. The prevalence of the metabolic syndrome in a farm worker community in the Boland district, South Africa. BMC Public Health. 2017;17(1):61. doi:10.1186/s12889-016-3973-1
33. Joseph-Shehu EM, Ncama BP. Evaluation of health status and its predictor among university staff in Nigeria. BMC Cardiovasc Disord. 2018;18(1):183. doi:10.1186/s12872-018-0918-x
34. Ben-Yacov L, Ainembabazi P, Stark AH, Kizito S, Bahendeka S. Prevalence and sex-specific patterns of metabolic syndrome in rural Uganda. BMJ Nutr Prev Health. 2020.
35. Wube TB, Nuru MM, Anbese AT. A comparative prevalence of metabolic syndrome among type 2 diabetes mellitus patients in Hawassa University Comprehensive Specialized Hospital using four different diagnostic criteria. Diabetes Metabol Syndr Obes. 2019;12:1877. doi:10.2147/DMSO.S221429
36. Solomon S, Mulugeta W. Disease burden and associated risk factors for metabolic syndrome among adults in Ethiopia. BMC Cardiovasc Disord. 2019;19(1):236. doi:10.1186/s12872-019-1201-5
37. Gebremeskel GG, Berhe KK, Belay DS, et al. Magnitude of metabolic syndrome and its associated factors among patients with type 2 diabetes mellitus in Ayder Comprehensive Specialized Hospital, Tigray, Ethiopia: a cross sectional study. BMC Res Notes. 2019;12(1):603. doi:10.1186/s13104-019-4609-1
38. Owolabi EO, Ter Goon D, Adeniyi OV, Ajayi AI. Optimal waist circumference cut-off points for predicting metabolic syndrome among low-income black South African adults. BMC Res Notes. 2018;11(1):22. doi:10.1186/s13104-018-3136-9
39. Gunderson EP. Childbearing and obesity in women: weight before, during, and after pregnancy. Obstetr Gynecol Clin. 2009;36(2):317–332.
40. Gurka MJ, Vishnu A, Santen RJ, DeBoer MD. Progression of metabolic syndrome severity during the menopausal transition. J Am Heart Assoc. 2016;5(8):e003609. doi:10.1161/JAHA.116.003609
41. Fujimoto WY, Bergstrom RW, Boyko EJ, et al. Type 2 diabetes and the metabolic syndrome in Japanese Americans. Diabetes Res Clin Pract. 2000;50:S73–S76. doi:10.1016/S0168-8227(00)00182-0
42. Ghadieh R, Mosleh JMB, Al Hayek S, Merhi S, Fares JEH. The relationship between hypovitaminosis D and metabolic syndrome: a cross sectional study among employees of a private university in Lebanon. BMC Nutr. 2018;4(1):36. doi:10.1186/s40795-018-0243-x
43. Kerie S, Menberu M, Geneto M, Oyeyemi AL. Metabolic syndrome among residents of Mizan-Aman town, South West Ethiopia, 2017: a cross sectional study. PLoS One. 2019;14(1):e0210969. doi:10.1371/journal.pone.0210969
44. Demilew YM, Firew BS, Conklin AI. Factors associated with noncommunicable disease among adults in Mecha district, Ethiopia: a case control study. PLoS One. 2019;14(5):e0216446. doi:10.1371/journal.pone.0216446
45. Lee M, Lim M, Kim J. Fruit and vegetable consumption and the metabolic syndrome: a systematic review and dose–response meta-analysis. Br J Nutr. 2019;122(7):723–733. doi:10.1017/S000711451900165X
46. Lim M, Kim J. Association between fruit and vegetable consumption and risk of metabolic syndrome determined using the Korean Genome and Epidemiology Study (KoGES). Eur J Nutr. 2019;1–12.
47. Ryu H, Kim Y, Lee J, et al. Office workers’ risk of metabolic syndrome-related indicators: a 10-year cohort study. West J Nurs Res. 2016;38(11):1433–1447. doi:10.1177/0193945916654134
48. Workineh G, Teferi G, Fikru T. Regular Khat (Catha edulis) chewing is associated with elevated diastolic blood pressure among adults in Butajira, Ethiopia: a comparative study. BMC Public Health. 2010;10(1):390. doi:10.1186/1471-2458-10-390
49. Badedi M, Darraj H, Hummadi A, et al. Khat chewing and Type 2 diabetes mellitus. Diabetes Metabol Syndr Obes. 2020;13:307. doi:10.2147/DMSO.S240680
50. Al-Duais MA, Al-Awthan YS. Association between qat chewing and dyslipidaemia among young males. J Taibah Univ Med Sci. 2019;14(6):538–546. doi:10.1016/j.jtumed.2019.09.008
51. Nam JY, Kim J, Cho KH, et al. Associations of sitting time and occupation with metabolic syndrome in South Korean adults: a cross-sectional study. BMC Public Health. 2016;16(1):943. doi:10.1186/s12889-016-3617-5
52. Chini LSN, Greffin S, Lugon JR. Prevalence of metabolic syndrome among workers from the Company of Generation and Distribution of Energy in Rio de Janeiro, Brazil. Cadernos Saúde Coletiva. 2014;22(4):359–364. doi:10.1590/1414-462X201400040009
53. Kim KS, Kim SJ, Kim S, Choi D-W, Ju YJ, Park E-C. Association of self-reported sedentary time with insulin resistance among Korean adults without diabetes mellitus: a cross-sectional study. BMC Public Health. 2018;18(1):1335. doi:10.1186/s12889-018-6237-4
54. Lemes I, Sui X, Fernandes R, et al. Association of sedentary behavior and metabolic syndrome. Public Health. 2019;167:96–102. doi:10.1016/j.puhe.2018.11.007
55. Dunstan DW, Kingwell BA, Larsen R, et al. Breaking up prolonged sitting reduces postprandial glucose and insulin responses. Diabetes Care. 2012;35(5):976–983. doi:10.2337/dc11-1931
 © 2020 The Author(s). This work is published and licensed by Dove Medical Press Limited. The
full terms of this license are available at https://www.dovepress.com/terms
and incorporate the Creative Commons Attribution
- Non Commercial (unported, 3.0) License.
By accessing the work you hereby accept the Terms. Non-commercial uses of the work are permitted
without any further permission from Dove Medical Press Limited, provided the work is properly
attributed. For permission for commercial use of this work, please see paragraphs 4.2 and 5 of our Terms.
© 2020 The Author(s). This work is published and licensed by Dove Medical Press Limited. The
full terms of this license are available at https://www.dovepress.com/terms
and incorporate the Creative Commons Attribution
- Non Commercial (unported, 3.0) License.
By accessing the work you hereby accept the Terms. Non-commercial uses of the work are permitted
without any further permission from Dove Medical Press Limited, provided the work is properly
attributed. For permission for commercial use of this work, please see paragraphs 4.2 and 5 of our Terms.