Back to Journals » Patient Preference and Adherence » Volume 11
Measuring dispositional optimism in patients with chronic heart failure and their healthcare providers: the validity of the Life Orientation Test-Revised
Authors Steca P, Monzani D ![]() , Pierobon A
, Pierobon A ![]() , Avvenuti G, Greco A
, Avvenuti G, Greco A ![]() , Giardini A
, Giardini A
Received 14 April 2017
Accepted for publication 24 June 2017
Published 6 September 2017 Volume 2017:11 Pages 1497—1503
DOI https://doi.org/10.2147/PPA.S139522
Checked for plagiarism Yes
Review by Single anonymous peer review
Peer reviewer comments 3
Editor who approved publication: Dr Johnny Chen
Patrizia Steca,1 Dario Monzani,1 Antonia Pierobon,2 Giulia Avvenuti,2 Andrea Greco,1 Anna Giardini2
1Department of Psychology, University of Milano – Bicocca, Milan, 2Psychology Unit, Istituti Clinici Scientifici Maugeri Spa SB, IRCCS Montescano, Montescano, Italy
Abstract: The Life Orientation Test-Revised (LOT-R) measures dispositional optimism (DO) – an individual difference promoting physical and psychological well-being in healthy adults (HAs) as well as in patients with chronic heart failure (CHF) and healthcare providers (HPs). Controversy has arisen regarding the dimensionality of the LOT-R. Whereas DO was originally defined as a one-dimensional construct, empirical evidence suggests two correlated factors in the LOT-R. This study was the first attempt to identify the best factor structure of the LOT-R in patients with CHF and HPs and to evaluate its measurement invariance among subsamples of patients with CHF, HPs, and a normative sample of HAs. Its validity was also evaluated in patients with CHF. The sample comprised 543 participants (34% HAs; 34% HPs; and 32% CHF patients). Congeneric, two correlated factor, and two orthogonal factor models for the LOT-R were compared by performing confirmatory factor analysis (CFA). Measurement invariance was evaluated by considering differential item functioning (DIF) among subsamples of HPs, patients with CHF, and HAs. In patients with CHF, validity was assessed by considering associations with anxiety and depression. The CFA demonstrated the superior fit of the two orthogonal factor model. Moreover, across patients with CHF, HPs, and HAs, the results highlighted a minimal DIF with only trivial consequences. Finally, negative but weak correlations of DO with anxiety and depression confirmed the validity of the LOT-R in patients with CHF. In summary, these findings supported the validity and suitability of the LOT-R for the assessment of DO in patients with CHF, HPs, and HAs.
Keywords: Life Orientation Test-Revised, dispositional optimism, validity, measurement equivalence, chronic heart failure
Introduction
The Life Orientation Test-Revised (LOT-R)1 is a tool for measuring dispositional optimism (DO), which is defined as a generalized expectancy for positive outcomes.2 Within the framework of expectancy-value models,3 behaviors are described as the product of the interaction between personal goals and expectancies about the future. Optimists view desired goals as obtainable, so they actively face adversity, resulting in perseverance and increased goal attainment.4
DO is relevant to health psychology due to its consequences for mental and physical health. Since optimists tend to adopt engagement coping strategies instead of avoidance ones, such as engaging in proactive behavior to promote their health, they tend to have better outcomes when affected by a disease.3,5 Recent studies found that DO is a protective factor against stroke6,7 and is related to the reduced incidence of coronary heart disease and total mortality8,9 as well as re-hospitalization after coronary bypass surgery.10,11 Therefore, DO is predictive of better cardiovascular health, independently of sociodemographic status, depression, and anxiety. Moreover, its effect may be modulated by other factors, the interacting mechanisms of which are still unknown.12,13
Empirical evidence has linked DO with psychological adjustment in healthcare providers (HPs). These professionals experience a great deal of stress in their work settings. HPs caring for chronic and seriously ill patients often experience distress and negative emotional reactions such as a sense of failure and frustration.14 DO appears to be a favorable individual difference in the healthcare context, where it represents a protective factor against patient-related stress and is positively related to job control in physicians.15 DO is a powerful predictor of job satisfaction in nurses.16 Moreover, nurses with higher DO report lower depression levels17 and lower levels of burnout.18
Thus, it is critical to reliably and validly assess individual differences in DO. The LOT-R1 is currently the most widely employed, easy-to-use self-report questionnaire assessing DO. The LOT-R consists of 10 items, four of which are filler items. Of the remaining six items, half are positively worded, and the others are negatively worded. In the Italian version of the LOT-R, psychometric properties were evaluated with adolescents19 and a sample of adults.20
An important debate has arisen about the factor structure of the LOT-R. Specifically, evidence has questioned its one-dimensionality by showing that the single bipolar factor (1F) model provides a worse fit than the two correlated factor (2CF) model. However, four recent studies have suggested that the two correlated factor structure of the LOT-R may be a methodological artifact related to item wording.19,21–23 Specifically, the unidimensionality of the DO measured by the LOT-R could be preserved by introducing a response style to a two orthogonal factor (2OF) model, in which all of the items load on the first factor measuring DO and the three positively worded items load on the second orthogonal factor representing a response style construct. Although the superior fit of the 2OF model has been demonstrated in healthy populations, no studies have evaluated its appropriateness in samples of patients with chronic heart failure (CHF) or in HPs.
Purpose of the study
The purpose of our study was to identify the best factor structure of the LOT-R in clinical and non-clinical samples of adults by comparing the 1F, 2CF, and 2OF models and to evaluate its measurement invariance among subsamples of patients with CHF, HPs, and a normative sample of healthy adults (HAs).
Once the best-fitting model was identified using confirmatory factor analysis (CFA), its measurement invariance was evaluated by considering Differential Item Functioning (DIF) in subsamples of HPs working with cardiac patients and patients with CHF, compared to a normative sample of HAs not employed in the health field. Measurement invariance is important for evaluating inter-individual differences. DIF is a prerequisite for a meaningful comparison of the level of DO and functioning across groups. As a secondary step in the evaluation of how well the LOT-R functions in patients with CHF, its divergent validity was also assessed by considering the external criteria of anxiety and depression. These two variables were chosen because previous empirical evidence had suggested that the original version of the LOT had poor construct validity due to its shared variance with both anxiety and neuroticism.24 By considering the association of DO with anxiety and depression, our study shed light on the validity of the LOT-R in patients affected by CHF, representing the first attempt to assess the validity of the LOT-R in a clinical population.
Methods
Participants and procedure
The sample comprised 543 participants. The enrollment of HAs, HPs working with cardiac patients, and patients with CHF was conducted in different contexts. Three different subsamples were collected:
- HAs (N=186) were recruited with a “snowball” method: volunteers were solicited by a group of undergraduate students to participate and were encouraged to recruit their acquaintances to participate as well.
- HPs (N=186) who participated in a conference organized by the Italian Association for Cardiovascular Prevention and Rehabilitation (GICR-IACPR) were recruited. All HPs dealt with all types of heart disease, including CHF.
- Patients with CHF (N=171) of NYHA classes II (N=26, 15.2%) or III (N=145, 84.5%) attending the Cardiological Department, Istituti Clinici Scientifici Maugeri Spa SB – Scientific Institute of Montescano (PV) Italy for cardiological rehabilitation were recruited. For the CHF subsample, the following inclusion criteria were adopted: diagnosis of CHF and ability to speak and read fluent Italian. The following exclusion criteria were adopted: severe psychiatric disorders, severe clinical conditions that impeded questionnaire administration, severe cognitive impairment, or refusal to provide consent.
All participants provided written consent after being properly informed. The study was approved by the Institutional Review Board and Central Ethical Committee belonging to the Istituti Clinici Scientifici Maugeri Spa SB (CEC) (approval number: CEC N.791, 19/12/2011). A total of 54% of participants were males. The mean age of the study sample was 50.20 years (min =21; max =85; SD =12.71). Table 1 shows the breakdown of gender and age by subsample, and statistical tests of subsample differences. A chi-square test was conducted to evaluate whether gender differences among subsamples were significant [χ2 (2) =73.81, p<0.001]. Specifically, the proportion of male participants in the CHF subsample was higher than the proportion of males in the remaining two subsamples. The one-way ANOVA undertaken to test for age differences among subsamples was significant [F(2, 542) =60.42, p<0.001], with Tukey’s post hoc comparison showing that people from the HA subsample and the HP subsample were younger than those in the CHF subsample.
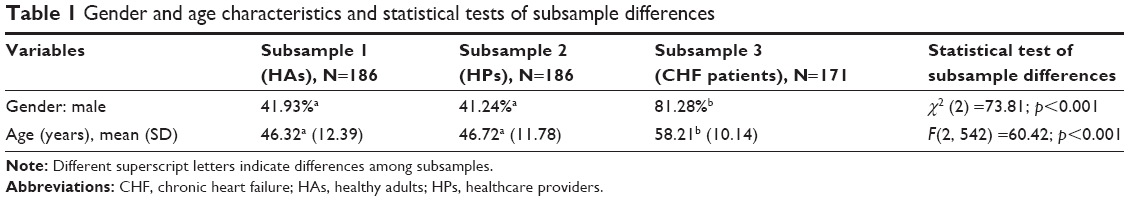 | Table 1 Gender and age characteristics and statistical tests of subsample differences |
Measures
Each participant filled out the Italian version of the LOT-R.19,20 Questions were answered using a 5-point Likert scale (1= strongly disagree, 5= strongly agree).
The CHF subsample was also administered the Hospital Anxiety and Depression Scale (HADS),25,26 a 14-item self-report measure developed to screen for generalized symptoms of depression and anxiety in medical patients.
Data analysis
Data were analyzed through Mplus 7.027 with Maximum Likelihood with Robust Standard Errors (MLR). MLR is an estimation procedure that is robust to violations of normality. The 1F, 2CF, and 2OF models were compared to identify the best factor structure using CFA. The 1F model is a single bipolar factor model proposed by Scheier et al.1 The 2CF model is a bi-factorial model composed of an optimism factor loaded by three positively worded items and a pessimism factor loaded by three negatively worded items. Finally, the 2OF is composed of a latent DO trait plus a response style factor associated with the three positively worded items. As a first step, we considered the overall sample and used CFA to compare the goodness-of-fit of the three alternative models for the LOT-R (ie, 1F, 2CF, and 2OF). Subsequently, the best-fitting model was also evaluated in the three subsamples separately. The goodness-of-fit of this model was evaluated by several fit indices: good model fit was indicated by a non-significant χ2, a comparative fit index (CFI) and Tucker Lewis Index (TLI) above 0.95, a root mean square error of approximation (RMSEA) below 0.06, and a standardized root mean square residual (SRMR) below 0.80.28 In addition, the 90% confidence interval for RMSEA (CIRMSEA) was used to more precisely test the null hypothesis of poor model fit. In a well-fitting model, the upper limit should be below 0.08, and the lower limit should be close to zero. Lastly, the probability of close fit (PCLOSE) was also considered. This measure provided a one-sided test of the null hypothesis of close fit (ie, RMSEA equals 0.05). Jöreskog and Sörbom suggested that the p-value for this test should be above 0.50.29 Moreover, we compared the three alternative models and chose the best-fitting model based on the lowest values observed for the Akaike information criterion (AIC) and the sample size-adjusted Bayesian information criterion (SABIC).30,31
Once the best-fitting model was identified, we proceeded by ascertaining whether items showed DIF across subsamples with a multiple indicators-multiple causes (MIMIC) model. Because of the gender and age differences among our subsamples, the MIMIC model was also controlled for these effects by evaluating age and gender DIF. We chose MIMIC because it has several advantages over multiple-group factor analysis in evaluating measurement invariance. The MIMIC model makes it possible to: 1) analyze relationships between the measurement model and several confounding variables, 2) simultaneously explore the role of continuous (ie, age) and categorical variables (eg, subsample membership and gender) in influencing measurement invariance, 3) introduce continuous variables directly in the model without subjective categorization, and 4) test measurement invariance even with a small sample size.
Our MIMIC model consisted of a measurement model (ie, the best-fitting model) as well as a structural model. The structural model specified the effect of the covariates on latent traits, thereby estimating differences in latent factor means due to covariates. The structural model also included the direct effects of these covariates on indicators (ie, items) holding the latent variables constant. In the first step, these direct effects were constrained to be zero. After running this first model, we examined the modification indices to determine whether the fit of the MIMIC model would be improved by freely estimating a direct effect. The release of constraints was carried out in a stepwise fashion: we first released the constraints that resulted in the greatest χ2 change (ie, highest modification index). We continued releasing one constraint at a time until modification was negligible (ie, Δ χ2 <3.84). A significant direct effect indicated DIF: response probabilities to an item differ between subsample and gender or depend on age despite the fact that people from different subsamples and of different ages and genders were matched for levels of latent factors. The presence of DIF impairs measurement invariance.
The following covariates were introduced into the MIMIC model: subsample membership, age, and gender. Age was entered as a continuous covariate, whereas gender and subsample membership were included as dummy variables. Male gender was the reference group. Subsample membership was entered by creating two dummy variables that represented the HP and CHF patient subsamples, with the HA subsample chosen as the reference group in each dummy variable. Next, we examined whether the estimation of each significant direct effect led to a change in the size of the estimate of group differences in factor means. Specifically, we compared the results of a model with no direct effects to that of a model in which all significant direct effects were freely estimated.
Finally, partial correlations of the DO factor score with observed scores for anxiety and depression were computed to assess the construct validity of the LOT-R in the CHF patient subsample while controlling for the factor score of response style. Factor scores of DO and response style were derived from the last model, with all significant direct effects of covariates on indicators.
Results
Comparing alternative models
The fit statistics of the three alternative models are reported in Table 2. The 2OF model was the only one to display a non-significant χ2. Moreover, it showed the best fit according to conventional criteria [χ2 (6, N=543) =10.99, p=0.089; RMSEA =0.039; CIRMSEA =0.000−0.075; PCLOSE =0.641; CFI =0.992, TLI =0.980, SRMR =0.028] and information criteria AIC and SABIC. This model also fitted adequately in the three subsamples separately [HAs: χ2 (6, N=186) =11.78, p=0.067; RMSEA =0.072; CIRMSEA =0.000−0.133; PCLOSE =0.232; CFI =0.977, TLI =0.942, SRMR =0.030; HPs: χ2 (6, N=186) =1.48, p=0.961; RMSEA =0.000; CIRMSEA =0.000−0.000; PCLOSE =0.988; CFI =1.000, TLI =1.072, SRMR =0.013; CHF patients: χ2 (6, N=171) =5.54, p=0.477; RMSEA =0.000; CIRMSEA =0.000−0.095; PCLOSE =0.641; CFI =1.000, TLI =1.019, SRMR =0.030].
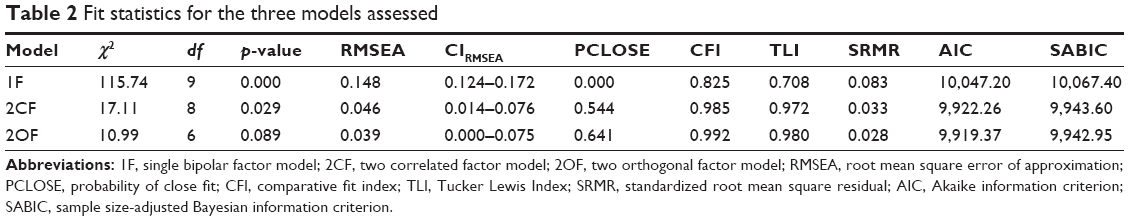 | Table 2 Fit statistics for the three models assessed |
The standardized solution for the 2OF model is displayed in Figure 1. All the items had significant loadings, ranging from 0.35 to 0.75 in absolute value on the DO factor. Moreover, all the positively worded items exhibited moderate loadings on the response style factor.
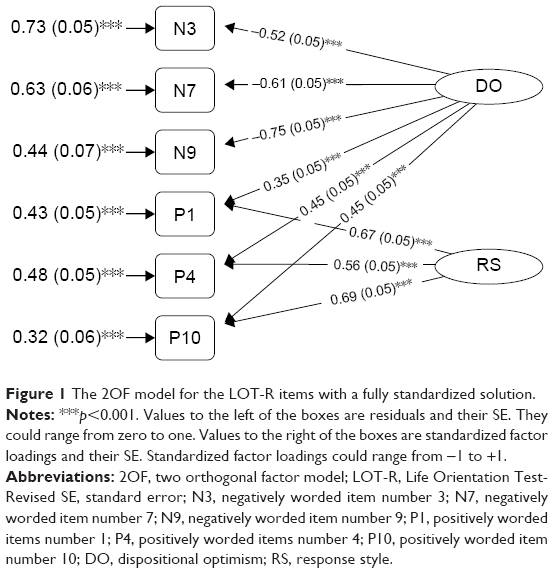 | Figure 1 The 2OF model for the LOT-R items with a fully standardized solution. |
MIMIC analysis of measurement invariance
After adding the covariates, the model fit slightly improved [χ2 (22, N=453) =36.59; p=0.026; RMSEA =0.035; CIRMSEA =0.012−0.055; PCLOSE =0.885; CFI =0.984; TLI =0.972; SRMR =0.032]. The standardized factor loading of DO ranged from 0.22 to 0.74 in absolute value. Moreover, all positively worded items exhibited significant loadings, ranging from 0.56 to 0.73 on the response style factor. Modification indices suggested that model fit could improve by consecutively estimating three direct effects of the covariates on the indicators. Specifically, these effects were gender on Item 3 (β=0.12; S.E. =0.04; p=0.002), HP membership on Item 7 (β=−0.16; S.E. =0.06; p=0.004), and HP membership on Item 4 (β=0.12; S.E. =0.06; p=0.045). After freely estimating all these direct effects, the model showed an excellent fit to the data [χ2 (19, N=453) =12.74; p=0.852; RMSEA =0.000; CIRMSEA =0.000−0.021; PCLOSE =1.000; CFI =1.000; TLI =1.014; SRMR =0.013].
After controlling for DIF, the group differences in both DO and response style remained large for HPs and small for the CHF patient subsample (Table 3). Overall, these results suggested that any bias due to DIF was minimal, and accounting for it had trivial consequences on model results. Considering the results of the model with all significant direct effects, we found that HPs (β=−0.52, S.E. =0.06, p<0.001) and CHF patients (β=−0.21, S.E. =0.06, p<0.01) reported lower levels of optimism than HAs.
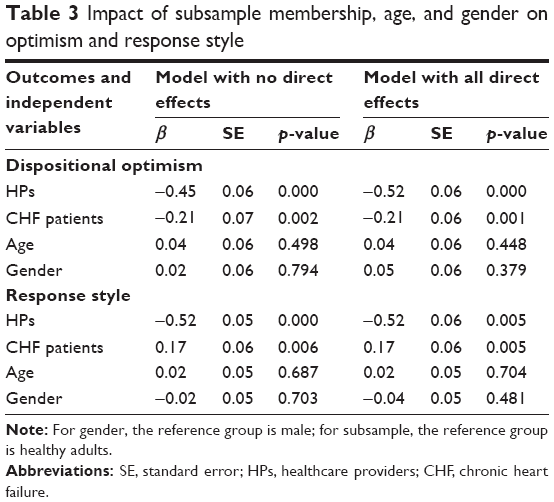 | Table 3 Impact of subsample membership, age, and gender on optimism and response style |
Construct validity
Considering cut-off points for anxiety on the HADS, 115 (66.9%) patients with CHF reported normal scores, whereas 30 (17.4%) reported mild anxiety, 20 (12.2%) reported moderate anxiety, and 6 (3.5%) reported severe anxiety. For depressive symptoms, 135 (78.5%) patients with CHF reported normal scores, whereas 26 (15.7%) reported mild depression, 7 (4.1%) reported moderate depression, and 3 (1.7%) reported severe depression.
After controlling for the factor score of response style, the partial correlation coefficients between the factor score of optimism and the observed score of anxiety and depression in patients with CHF were interpreted as measures of effect size.32 DO is only weakly related to anxiety (r=−0.31, p<0.001) and depression (r=−0.23, p<0.01).
Discussion
The current study represents the first attempt to evaluate the dimensionality, validity, and DIF of the LOT-R in subsamples composed of both HPs and patients affected by CHF. Our results demonstrated the superior fit of the 2OF model over the 1F and the 2CF models in three samples of HAs, HPs, and patients with CHF. Our results also provide support for the one-dimensionality of the DO construct and confirm the construct validity of the LOT-R as a measure of DO. Whereas this model has been previously proposed and supported by empirical evidence within a healthy population,19,21–23 this work is the first empirical test and demonstration of its validity in patients with CHF and HPs.
Moreover, this study is the first to evaluate the psychometric functioning of the LOT-R in samples of patients with CHF and their HPs, in part, by looking at DIF compared to a normative sample of HAs. Measurement invariance is important for evaluating inter-individual differences and represents a necessary prerequisite to effectively compare levels of DO across different groups. First, our results showed that, while controlling for age and gender differences, only two items displayed DIF; compared to healthy individuals, HPs were more likely to endorse Item 4 (ie, “I’m always optimistic about my future”) and less likely to endorse Item 7 (ie, “I hardly ever expect things to go my way”). However, the magnitude of these two DIFs was small. Second, by evaluating the magnitude of the differences in optimism among subsamples by controlling for these DIFs, we demonstrated that the DIF had only a trivial effect on latent mean differences in optimism across subsamples. Overall, these two results suggested that DIF was minimal and that any bias due to DIF across healthy individuals, HPs, and patients with CHF had trivial consequences. Our results also highlighted that both patients with CHF and their HPs displayed lower levels of DO compared to the normative population. Concerning patients with CHF, this result is consistent with evidence showing their poor quality of life, especially in terms of depression.33 CHF is a disabling disease with poor prognosis, impairment of daily activities, and restriction in social life and interpersonal relationships.34 We suggest the possibility that all of these adversities and drawbacks could lead to a decrease in optimism of patients with CHF as well. However, it is noteworthy to highlight that HPs also reported lower generalized expectancy compared to the healthy population. This result is consistent with evidence showing high incidence of burnout, distress, negative emotional reactions, and low psychological adjustment in HPs caring for patients with chronic diseases.14,35 Furthermore, our results provide clues to the possible need to implement interventions on burnout prevention that focus on DO.
Finally, by considering the association between DO, anxiety, and depression, our study confirmed the divergent validity of the LOT-R in patients affected by CHF. Specifically, after controlling for individual response style, DO is negatively but weakly linked to both anxiety and depression. This result may shed light on this important aspect of the validity of this self-report measure. While previous empirical evidence found poor construct validity in the first version of the LOT due to its shared variance with both anxiety and neuroticism,24 our work highlighted only weak associations with anxiety and depression and, thus, confirmed the good discriminant validity of this questionnaire.
Despite their novelty and contribution to the field, current findings should be considered in light of two main limitations. First, our results are limited to the population considered in the study, where the participants represent a nonprobability and convenience sample and, thus, do not necessarily properly represent HAs, HPs, and patients with CHF. Second, correlation analyses were conducted to evaluate the validity of the LOT-R by evaluating the link of DO with depression and anxiety. Future research may also assess predictive validity by testing the effect of DO on subsequent levels of these two variables.
Despite the limitations, our results demonstrate the one-dimensional structure, the good psychometric properties, the measurement invariance, and the validity of the LOT-R in samples of HPs and patients with CHF. They reinforce the theoretical conceptualization of DO as a single bipolar dimension, ranging from pessimism to optimism. As a practical consequence, we advise that future research should use a single score of optimism rather than two separate scores of optimism and pessimism. In conclusion, these findings confirmed that the LOT-R is suitable for assessing DO in all of the above-considered groups. Specifically, as a result of its simplicity, brevity, comprehensibility, and validity, it is particularly suitable for patients with CHF who are generally impaired by long or complex tasks. The psychological assessment of the patient with CHF in terms of both risk and protective factors is key to defining an effective treatment plan and to predicting adherence to treatment modalities, long-term outcomes, and prognosis. Thus, we suggest that this self-report should be included in the routine psychological screening of patients with CHF alongside validated measures that are commonly used to screen for anxiety and depression.
Disclosure
The authors report no conflicts of interests in this work.
References
Scheier MF, Carver CS, Bridges MW. Distinguishing optimism from neuroticism (and trait anxiety, self-mastery, and self-esteem): a reevaluation of the Life Orientation Test. J Pers Soc Psychol. 1994;67(6):1063–1078. | ||
Scheier MF, Carver CS. Optimism, coping, and health: assessment and implications of generalized outcome expectancies. Health Psychol. 1985;4(3):219–247. | ||
Carver CS, Scheier MF. Dispositional optimism. Trends Cogn Sci. 2014;18(6):293–299. | ||
Monzani D, Steca P, Greco A, D’Addario M, Pancani L, Cappelletti E. Effective pursuit of personal goals: the fostering effect of dispositional optimism on goal commitment and goal progress. Pers Individ Dif. 2015;82:203–214. | ||
Rasmussen HN, Scheier MF, Greenhouse JB. Optimism and physical health: a meta-analytic review. Ann Behav Med. 2009;37(3):239–256. | ||
Kim ES, Park N, Peterson C. Dispositional optimism protects older adults from stroke: the Health and Retirement Study. Stroke. 2011;42(10):2855–2859. | ||
Kubzansky LD, Park N, Peterson C, Vokonas P, Sparrow D. Healthy psychological functioning and incident coronary heart disease: the importance of self-regulation. Arch Gen Psychiatry. 2011;68(4):400–408. | ||
Boehm JK, Peterson C, Kivimaki M, Kubzansky L. A prospective study of positive psychological well-being and coronary heart disease. Health Psychol. 2011;30(3):259–267. | ||
Davidson KW, Mostofsky E, Whang W. Don’t worry, be happy: positive affect and reduced 10-year incident coronary heart disease: The Canadian Nova Scotia Health Survey. Eur Heart J. 2010;31(9):1065–1070. | ||
Scheier MF, Matthews KA, Owens JF, et al. Optimism and rehospitalization after coronary artery bypass graft surgery. Arch Intern Med. 1999;159(8):829–835. | ||
Tindle H, Belnap BH, Houck PR, et al. Optimism, response to treatment of depression, and rehospitalization after coronary artery bypass graft surgery. Psychosom Med. 2012;74(2):200–207. | ||
Avvenuti G, Baiardini I, Giardini A. Optimism’s explicative role for chronic diseases. Front Psychol. 2016;7:295. | ||
DuBois CM, Lopez OV, Beale EE, Healy BC, Boehm JK, Huffman JC. Relationships between positive psychological constructs and health outcomes in patients with cardiovascular disease: a systematic review. Int J Cardiol. 2015;195:265–280. | ||
Lasalvia A, Tansella M. Occupational stress and job burnout in mental health. Epidemiol Psychiatr Sci. 2011;20(4):279–285. | ||
Heponiemi T, Aalto AM, Puttonen S, Vänskä J, Elovainio M. Work-related stress, job resources, and well-being among psychiatrists and other medical specialists in Finland. Psychiatr Serv. 2014;65(6):796–801. | ||
Chang YH, Li HH, Wu CM, Wang PC. The influence of personality traits on nurses’ job satisfaction in Taiwan. Int Nurs Rev. 2010;57(4):478–484. | ||
Chang Y, Wang PC, Li HH, Liu YC. Relations among depression, self-efficacy and optimism in a sample of nurses in Taiwan. J Nurs Manag. 2011;19(6):769–776. | ||
Chang Y, Chan HJ. Optimism and proactive coping in relation to burnout among nurses. J Nurs Manag. 2015;23(3):401–408. | ||
Monzani D, Steca P, Greco A. Brief report: assessing dispositional optimism in adolescence – factor structure and concurrent validity of the Life Orientation Test – Revised. J Adolesc. 2014;37(2):97–101. | ||
Steca P, Monzani D, Greco A, Chiesi F, Primi C. Item response theory analysis of the life orientation test-revised: age and gender differential item functioning analyses. Assessment. 2015;22(3):341–350. | ||
Alessandri G, Vecchione M, Fagnani C, et al. Much more than model fitting? Evidence for the heritability of method effect associated with positively worded items of the life orientation test revised. Struct Equ Modeling. 2010;17(4):642–653. | ||
Vautier S, Raufaste E, Cariou M. Dimensionality of the revised life orientation test and the status of filler items. Int J Psychol. 2003;38(6):390–400. | ||
Rauch WA, Schweizer K, Moosbrugger H. Method effects due to social desirability as a parsimonious explanation of the deviation from unidimensionality in LOT-R scores. Pers Individ Dif. 2007;42(8):1597–1607. | ||
Marshall GN, Lang EL. Optimism, self-mastery, and symptoms of depression in women professionals. J Pers Soc Psychol. 1990;59(1):132–139. | ||
Zigmond AS, Snaith RP. The hospital anxiety and depression scale. Acta Psychiatr Scand. 1983;67(6):361–370. | ||
Costantini M, Musso M, Viterbori P, et al. Detecting psychological distress in cancer patients: validity of the Italian version of the Hospital Anxiety and Depression Scale. Support Care Cancer. 1999;7(3):121–127. | ||
Muthén LK, Muthén BO. Mplus User’s Guide. 7th ed. Los Angeles, CA: Muthén & Muthén; 1998–2012. | ||
Hu L, Bentler PM. Cutoff criteria for fit indexes in covariance structure analysis: conventional criteria versus new alternatives. Struct Equ Modeling. 1999;6(1):1–55. | ||
Jöreskog KG, Sörbom D. LISREL 8 User’s Reference Guide. Uppsala, Sweden: Scientific Software International; 1996. | ||
Arbuckle JL. AMOS TM 18 User’s Guide. Chicago: SPSS Inc; 2009. | ||
Enders CK, Tofighi D. The impact of misspecifying class-specific residual variances in growth mixture models. Struct Equ Modeling. 2008;15(1):75–95. | ||
Cohen J. Statistical Power Analysis for the Behavioral Sciences. 2nd ed. Hillsdale, NJ: Lawrence Erlbaum; 1988. | ||
Lossnitzer N, Herzog W, Störk S, et al; Competence Network Heart Failure. Incidence rates and predictors of major and minor depression in patients with heart failure. Int J Cardiol. 2013;167(2):502–507. | ||
Lossnitzer N, Herzog W, Schultz JH, Taeger T, Frankenstein L, Wild B. A patient-centered perspective of treating depressive symptoms in chronic heart failure: what do patients prefer? Patient Educ Couns. 2015;98(6):783–787. | ||
Majani G, Di Tano G, Giardini A, et al. Prevalence of job-related distress and satisfaction in a nationwide cardiology setting: The IANUS – itAliaN cardiologists’ Undetected distress Study. J Cardiovasc Med (Hagerstown). 2016;17(8):587–594. |
 © 2017 The Author(s). This work is published and licensed by Dove Medical Press Limited. The
full terms of this license are available at https://www.dovepress.com/terms
and incorporate the Creative Commons Attribution
- Non Commercial (unported, 3.0) License.
By accessing the work you hereby accept the Terms. Non-commercial uses of the work are permitted
without any further permission from Dove Medical Press Limited, provided the work is properly
attributed. For permission for commercial use of this work, please see paragraphs 4.2 and 5 of our Terms.
© 2017 The Author(s). This work is published and licensed by Dove Medical Press Limited. The
full terms of this license are available at https://www.dovepress.com/terms
and incorporate the Creative Commons Attribution
- Non Commercial (unported, 3.0) License.
By accessing the work you hereby accept the Terms. Non-commercial uses of the work are permitted
without any further permission from Dove Medical Press Limited, provided the work is properly
attributed. For permission for commercial use of this work, please see paragraphs 4.2 and 5 of our Terms.