Back to Journals » Cancer Management and Research » Volume 10
Marker of proliferation Ki-67 expression is associated with transforming growth factor beta 1 and can predict the prognosis of patients with hepatic B virus-related hepatocellular carcinoma
Authors Yang C ![]() , Su H, Liao X
, Su H, Liao X ![]() , Han C, Yu T, Zhu G
, Han C, Yu T, Zhu G ![]() , Wang X, Winkler CA
, Wang X, Winkler CA ![]() , O'Brien SJ, Peng T
, O'Brien SJ, Peng T ![]()
Received 15 January 2018
Accepted for publication 9 February 2018
Published 10 April 2018 Volume 2018:10 Pages 679—696
DOI https://doi.org/10.2147/CMAR.S162595
Checked for plagiarism Yes
Review by Single anonymous peer review
Peer reviewer comments 2
Editor who approved publication: Dr Leylah Drusbosky
Chengkun Yang,1,* Hao Su,1,* Xiwen Liao,1 Chuangye Han,1 Tingdong Yu,1 Guangzhi Zhu,1 Xiangkun Wang,1 Cheryl Ann Winkler,2 Stephen J O’Brien,3–5 Tao Peng1
1Department of Hepatobiliary Surgery, The First Affiliated Hospital of Guangxi Medical University, Nanning, Guangxi Province, China; 2Basic Research Laboratory, CCR, NCI, Leidos Biomedical Research, Frederick National Laboratory, Frederick, MD, USA; 3Laboratory of Genomic Diversity, National Cancer Institute, NIH, Frederick, MD, USA; 4Theodosius Dobzhansky Center for Genome Bioinformatics, St. Petersburg State University, St Petersburg, Russia; 5Guy Harvey Oceanographic Center, Halmos College of Natural Sciences and Oceanography, Nova Southeastern University, Fort Lauderdale, FL, USA
*These authors contributed equally to this work
Abstract: Hepatocellular carcinoma (HCC) is the most frequent malignancy of the liver. Transforming growth factor beta 1 (TGFB1) and marker of proliferation Ki-67 (MKI67) regulate cell proliferation, differentiation, and growth. The association between MKI67 and TGFB1 expression and its clinical implications in HCC remain unknown.
Methods: Public databases were used to analyze TGFB1 and MKI67 expression in different pathologic grades/stages and tissue types of HCC. The association between MKI67 and TGFB1 expression was explored using pathway analysis and in a HepG2 cell line treated with TGFB1. Survival analysis was performed to evaluate the prognostic value of TGFB1 and MKI67 expression in patients with hepatitis B virus (HBV)-related HCC.
Results: We identified that MKI67 expression was upregulated in liver cancer tissues. MKI67 and TGFB1 expression levels were different in various stages and tissue types of liver cancer. Furthermore, MKI67 expression was associated with TGFB1 expression in liver cancer tissues and HepG2 cells. Patients with HBV-related HCC and a higher level of MKI67 expression had a worse prognosis. Moreover, a nomogram was conducted to predict the clinical outcomes of patients with HBV-related HCC.
Conclusion: MKI67 expression level was associated with TGFB1 expression in liver cancer tissues and a HepG2 cell line. MKI67 expression level can predict the clinical outcomes of patients with HBV-related HCC.
Keywords: MKI67, TGFB1, HBV-related HCC, nomogram
Introduction
Hepatocellular carcinoma (HCC) is the most frequent epithelial malignancy of the liver. Approximately 782,500 new cases and 745,500 deaths occurred worldwide in 2012 because of primary liver cancer.1 HCC most commonly develops in patients with chronic liver disease, the etiology of which includes alcohol consumption, viral infection, metabolic diseases, and aflatoxin. Despite new advances in cancer diagnosis and treatment, surgical resection and liver transplantation are still the best options for HCC patients.2 The 5-year survival of HCC patients after resection ranges between 50% and 70% at early disease stages, and the prognosis of HCC patients remains passive due to high postoperative recurrence rate and metastasis.3,4 Investigating the prognostic significance of available molecular biomarkers and potential therapeutic targets for HCC patients is an effective approach.
Transforming growth factor beta 1 (TGFB1; 19q13.2) encodes a protein that regulates cell proliferation, differentiation, and growth.5 Previous studies have demonstrated that TGFB1 orchestrates the progression of epithelial–mesenchymal transition (EMT)6 and promotes fibrogenesis.7,8 TGFB1 contributes to tumor progression to confer cell survival, induce cell migration and invasion, and mediates immune suppression and microenvironment modification,9,10 indicating that TGFB1 expression is associated with HCC pathogenesis and metastasis. Marker of proliferation Ki-67 (MKI67; located on 10q26.2) encodes a nuclear antigen during the G1, S, and G2–M phases of proliferating cells.11 The MKI67 labeling index has been found to correlate with tumor growth rate,12 histologic stage,13 and tumor recurrence14 of HCC. A higher MKI67 labeling index confers a fast progression and poor prognosis for HCC patients.15 Recently, a study reported that MKI67 expression was associated with TGFB1 expression in early pancreatic ductal adenocarcinoma.16 However, the relation of TGFB1 and MKI67 expression in HCC remains unknown. In addition, hepatic B virus (HBV)-related HCC is always accompanied with varying degrees of cirrhosis. The relationship of MKI67 and TGFB1 expression with the clinical outcomes of patients with HBV-related HCC needs to be explored.
In this study, we have identified, using public databases, that MKI67 expression was associated with TGFB1 in liver cancer tissue and a cell line. Furthermore, MKI67 expression was upregulated in tumor tissues. Moreover, MKI67 expression levels were associated with the clinical outcomes of HCC patients, which were unaffected by TGFB1 expression. We further conducted a prognostic model for patients with HBV-related HCC. However, the underlying mechanism needs to be clarified by functional analysis experiments.
Materials and methods
This study was approved by the Ethics Committee of the First Affiliated Hospital of Guangxi Medical University (Guangxi, China). Written informed consent was obtained from all patients before collection of the specimens.
Profiling of gene expression data
The Cancer Genome Atlas (TCGA) database and Genotype-Tissue Expression (GTEx) provide a resource-produced mRNA expression in different tissues. Gene Expression Profiling Interactive Analysis (GEPIA)17 is a web server for analyzing the RNA-Seq expression data from the TCGA and GTEx projects. We explored the expression distribution and correlation of TGFB1 and MKI67 in a body map and different cancer tissues using GEPIA. In addition, we analyzed the gene patterns in chromosomes. The gene positions are based on GRCh38.p2 (NCBI). To detect the TGFB1 and MKI67 expression in different stages and types of liver cancer, we used GEPIA and the UCSC Xena project,18 which has recomputed all raw expression data from TCGA. Survival analysis was performed to evaluate the prognostic value of TGFB1 and MKI67 expression in liver cancer patients via GEPIA.
Gene expression analysis in patients with HBV-related HCC
We analyzed TGFB1 and MKI67 expression in cancer and paracarcinoma tissues from patients of Zhongshan Hospital (Guangdong, China) with HBV-related HCC in Gene Expression Omnibus (GEO) dataset (accession: GSE14520). Expression profile data analysis was carried out on Affymetrix Gene Chip HG-U133A 2.0 arrays.19 TP53 and EGFR mRNA levels were also analyzed. We analyzed the changes in genomic profiles in Kyoto Encyclopedia of Genes and Genomes pathway and gene ontology analysis using the Gene Set Enrichment Analysis tool.20 Survival analysis was performed to assess the clinical outcomes of patients with HBV-related HCC.
Analysis of gene expression in tissues and cells
TGFB1 and MKI67 expression levels were analyzed in different liver tissues from GEO dataset (accession: GSE25097), which enrolled samples from 268 HCC tumors, 243 adjacent nontumor tissue samples, 40 cirrhotic, and 6 healthy liver samples. Gene expression profiles data were extracted using Rosetta/Merck Human RSTA Affymetrix 1.0 microarray.21 The relationship of TGFB1 and MKI67 mRNA levels with DNA copy number in different liver cancer cell lines was analyzed in Cancer Cell Line Encyclopedia project. Gene mRNA expression data were extracted using Affymetrix U133+2 arrays. The TGFB1 and MKI67 expression in cell sites and immunohistochemistry (IHC) staining analysis in liver cancer tissue were obtained from the Human Protein Atlas project. In GEO dataset (accession: GSE45945),22 gene expression profiles were compared using the Human Gene 1.0 ST arrays (Affymetrix, Thermo Fisher Scientific, Waltham, MA, USA) in HepG2 cells upon stimulation with 1 ng/mL TGFB1 for 20 min, 1 h, 2 h, 4 h, and 24 h, with untreated cells as controls. HepG2 cells were obtained from DSMZ (Braunschweig, Germany) and cell identity confirmed by Short Tandem Repeat profiling using the AmpFlSTR Identfiler Direct PCR Amplification kit (Thermo Fisher Scientific, Waltham, MA, USA). Experiments at indicated time points after stimulation with TGFB1 (1 ng/mL) and the control group were done in three independent replicates. We identified the change and correlation of TGFB1, MKI67, TP53, and EGFR mRNA levels at different time points. We detected the possible pathway and gene interactions of the four genes using the GeneMANIA tool.
Prognostic nomogram constructed using MKI67 expression in patients with HBV-related HCC
To construct nomograms, we enrolled two HBV-related HCC cohorts from the Zhongshan Hospital (GSE14520, n=212 patients) and the First Affiliated Hospital of Guangxi Medical University (n=195 patients). The expression of MKI67 was detected using chip and IHC staining, respectively. The cutoff value was set at the median. The clinicopathologic characteristics were as listed in previous studies.23,24 After examination and transformation of variables evaluated in a Cox proportional hazards regression model, variables including age, gender, MKI67 expression, cirrhosis, and Barcelona Clinic Liver Cancer (BCLC) stage were selected for a prognostic model. A nomogram was formulated based on the results of Cox regression analysis and by using the package “rms”25 in R 3.3.2 (R Foundation for Statistical Computing, Vienna, Austria).26 The performance of the nomogram was measured by concordance index (C-index). A larger C-index indicated more accurate prognostic stratification. Calibration of the nomogram for 1-, 3-, and 5-year overall survival (OS) and recurrence-free survival (RFS) was performed by comparing the means of predicted survival with those of actual survival with observed Kaplan–Meier estimates after the grouping of the nomogram predicted survival probability. Bootstraps with two cohort resamples were applied to these activities. Data were integrated and processed as in previous studies.27,28
Statistical analysis
In this study, differences in mRNA expression of genes between HCC and adjacent normal tissues were verified by Student’s t-test. Intergroup differences were compared using the one-way analysis of variance test for multiple types of tissue. If the analysis of variance test was significant, the p-value for pairwise comparisons was computed with the Least Significant Difference-t Student’s test. The correlation of gene expression was analyzed by Pearson’s correlation coefficient. The Kaplan–Meier survival analysis was used to calculate survival percentages, and differences in survival percentages were estimated using a generalized log-rank test. The receiver operating characteristic (ROC) curve was drawn to identify the diagnostic significance of MKI67 in GEO dataset. The standards of diagnosis for assessing the area under the curve in ROC were as follows: 0.5–0.7 (poor evidence), 0.7–0.9 (moderate evidence), and 0.9–1.0 (high evidence). Stratified analysis for MKI67 was performed to evaluate the relative hazard ratios on the prognosis of HCC patients. All statistical analyses were two-sided and were performed using SPSS version 17.0 (SPSS Inc., Chicago, IL, USA). A p-value of <0.05 was considered statistically significant. The survival curves and correlation plots were depicted by GraphPad Prism 5.01 (GraphPad Software, Inc., San Diego, CA, USA) and R 3.3.2, respectively.
Results
TGFB1 and MKI67 expression of liver cancer in TCGA analyzed via GEPIA
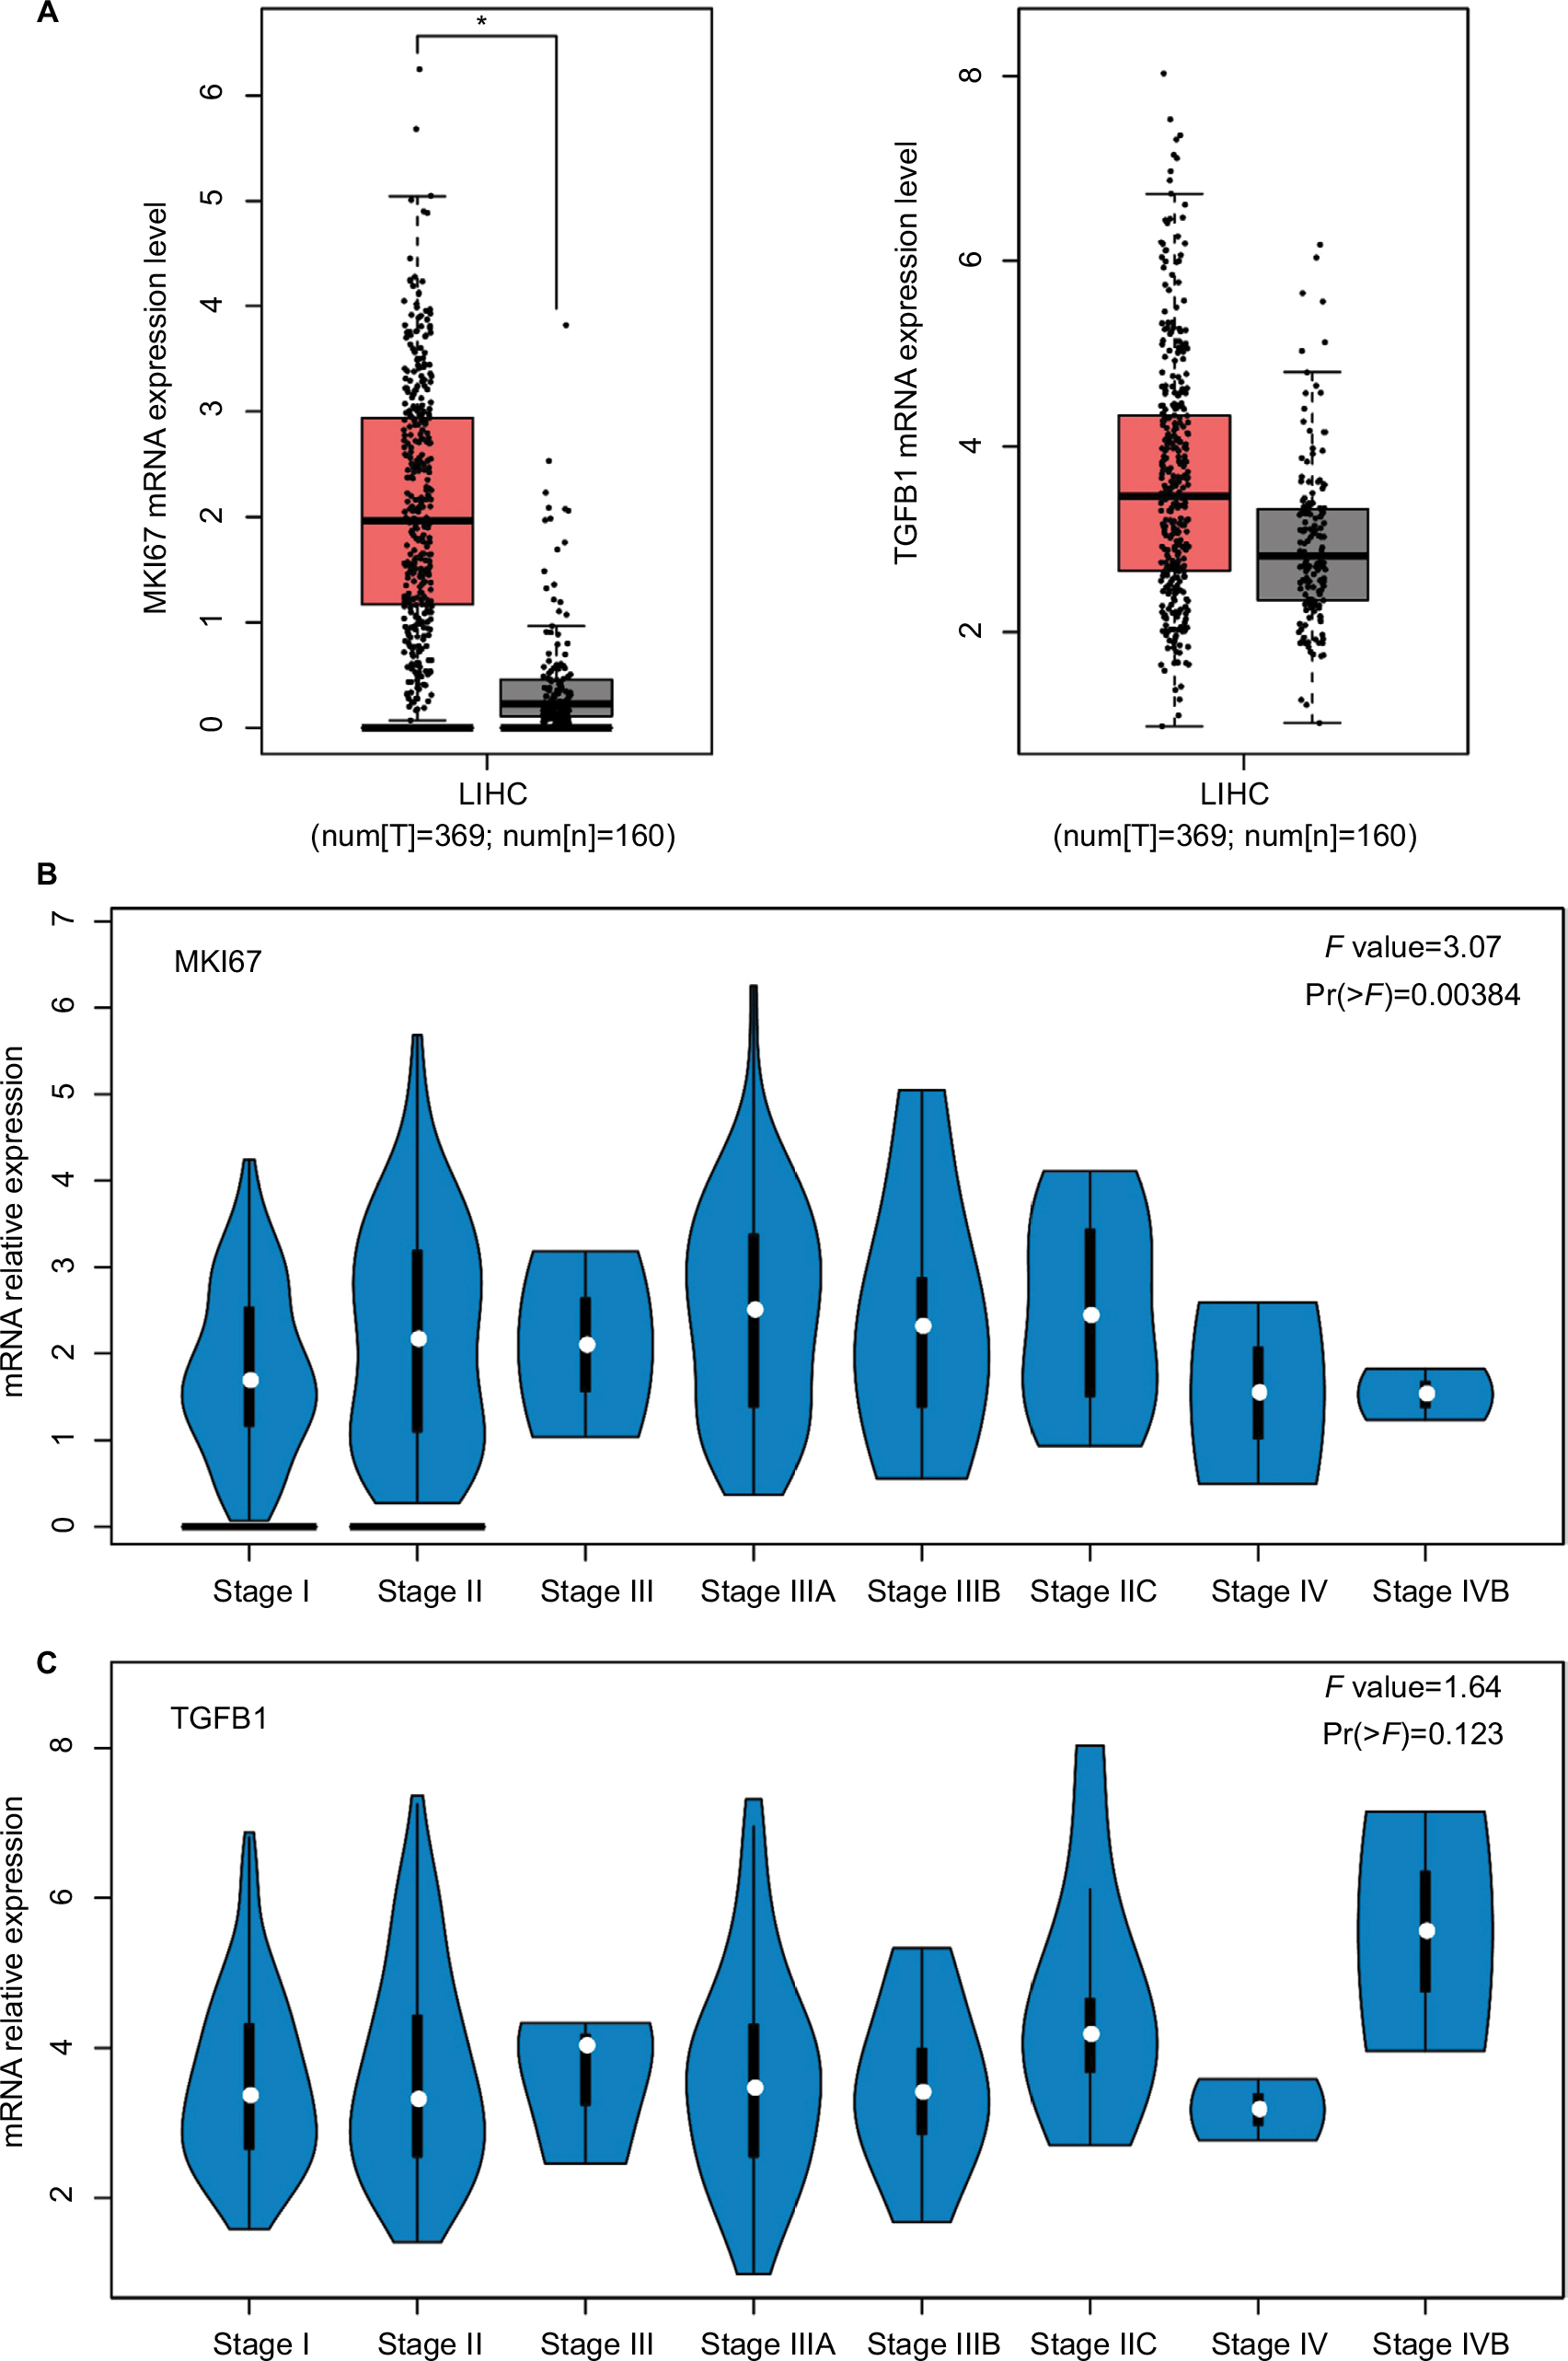
Compared to normal liver tissue, MKI67 mRNA level was upregulated in liver cancer, but the difference in TGFB1 expression was not obvious (Figure 1A, B). We analyzed the chromosomal distribution of differentially expressed genes in liver cancer (Figure S1). Genes with similar expression patterns were clustered with high density along chromosome 19, where TGFB1 is located. In addition, we analyzed TGFB1 and MKI67 mRNA levels across different tumor samples paired with normal tissues (Figure 1C, D). There was no significant difference in TGFB1 expression between tumor and nontumor matched GTEx normal tissues (Figure S2).
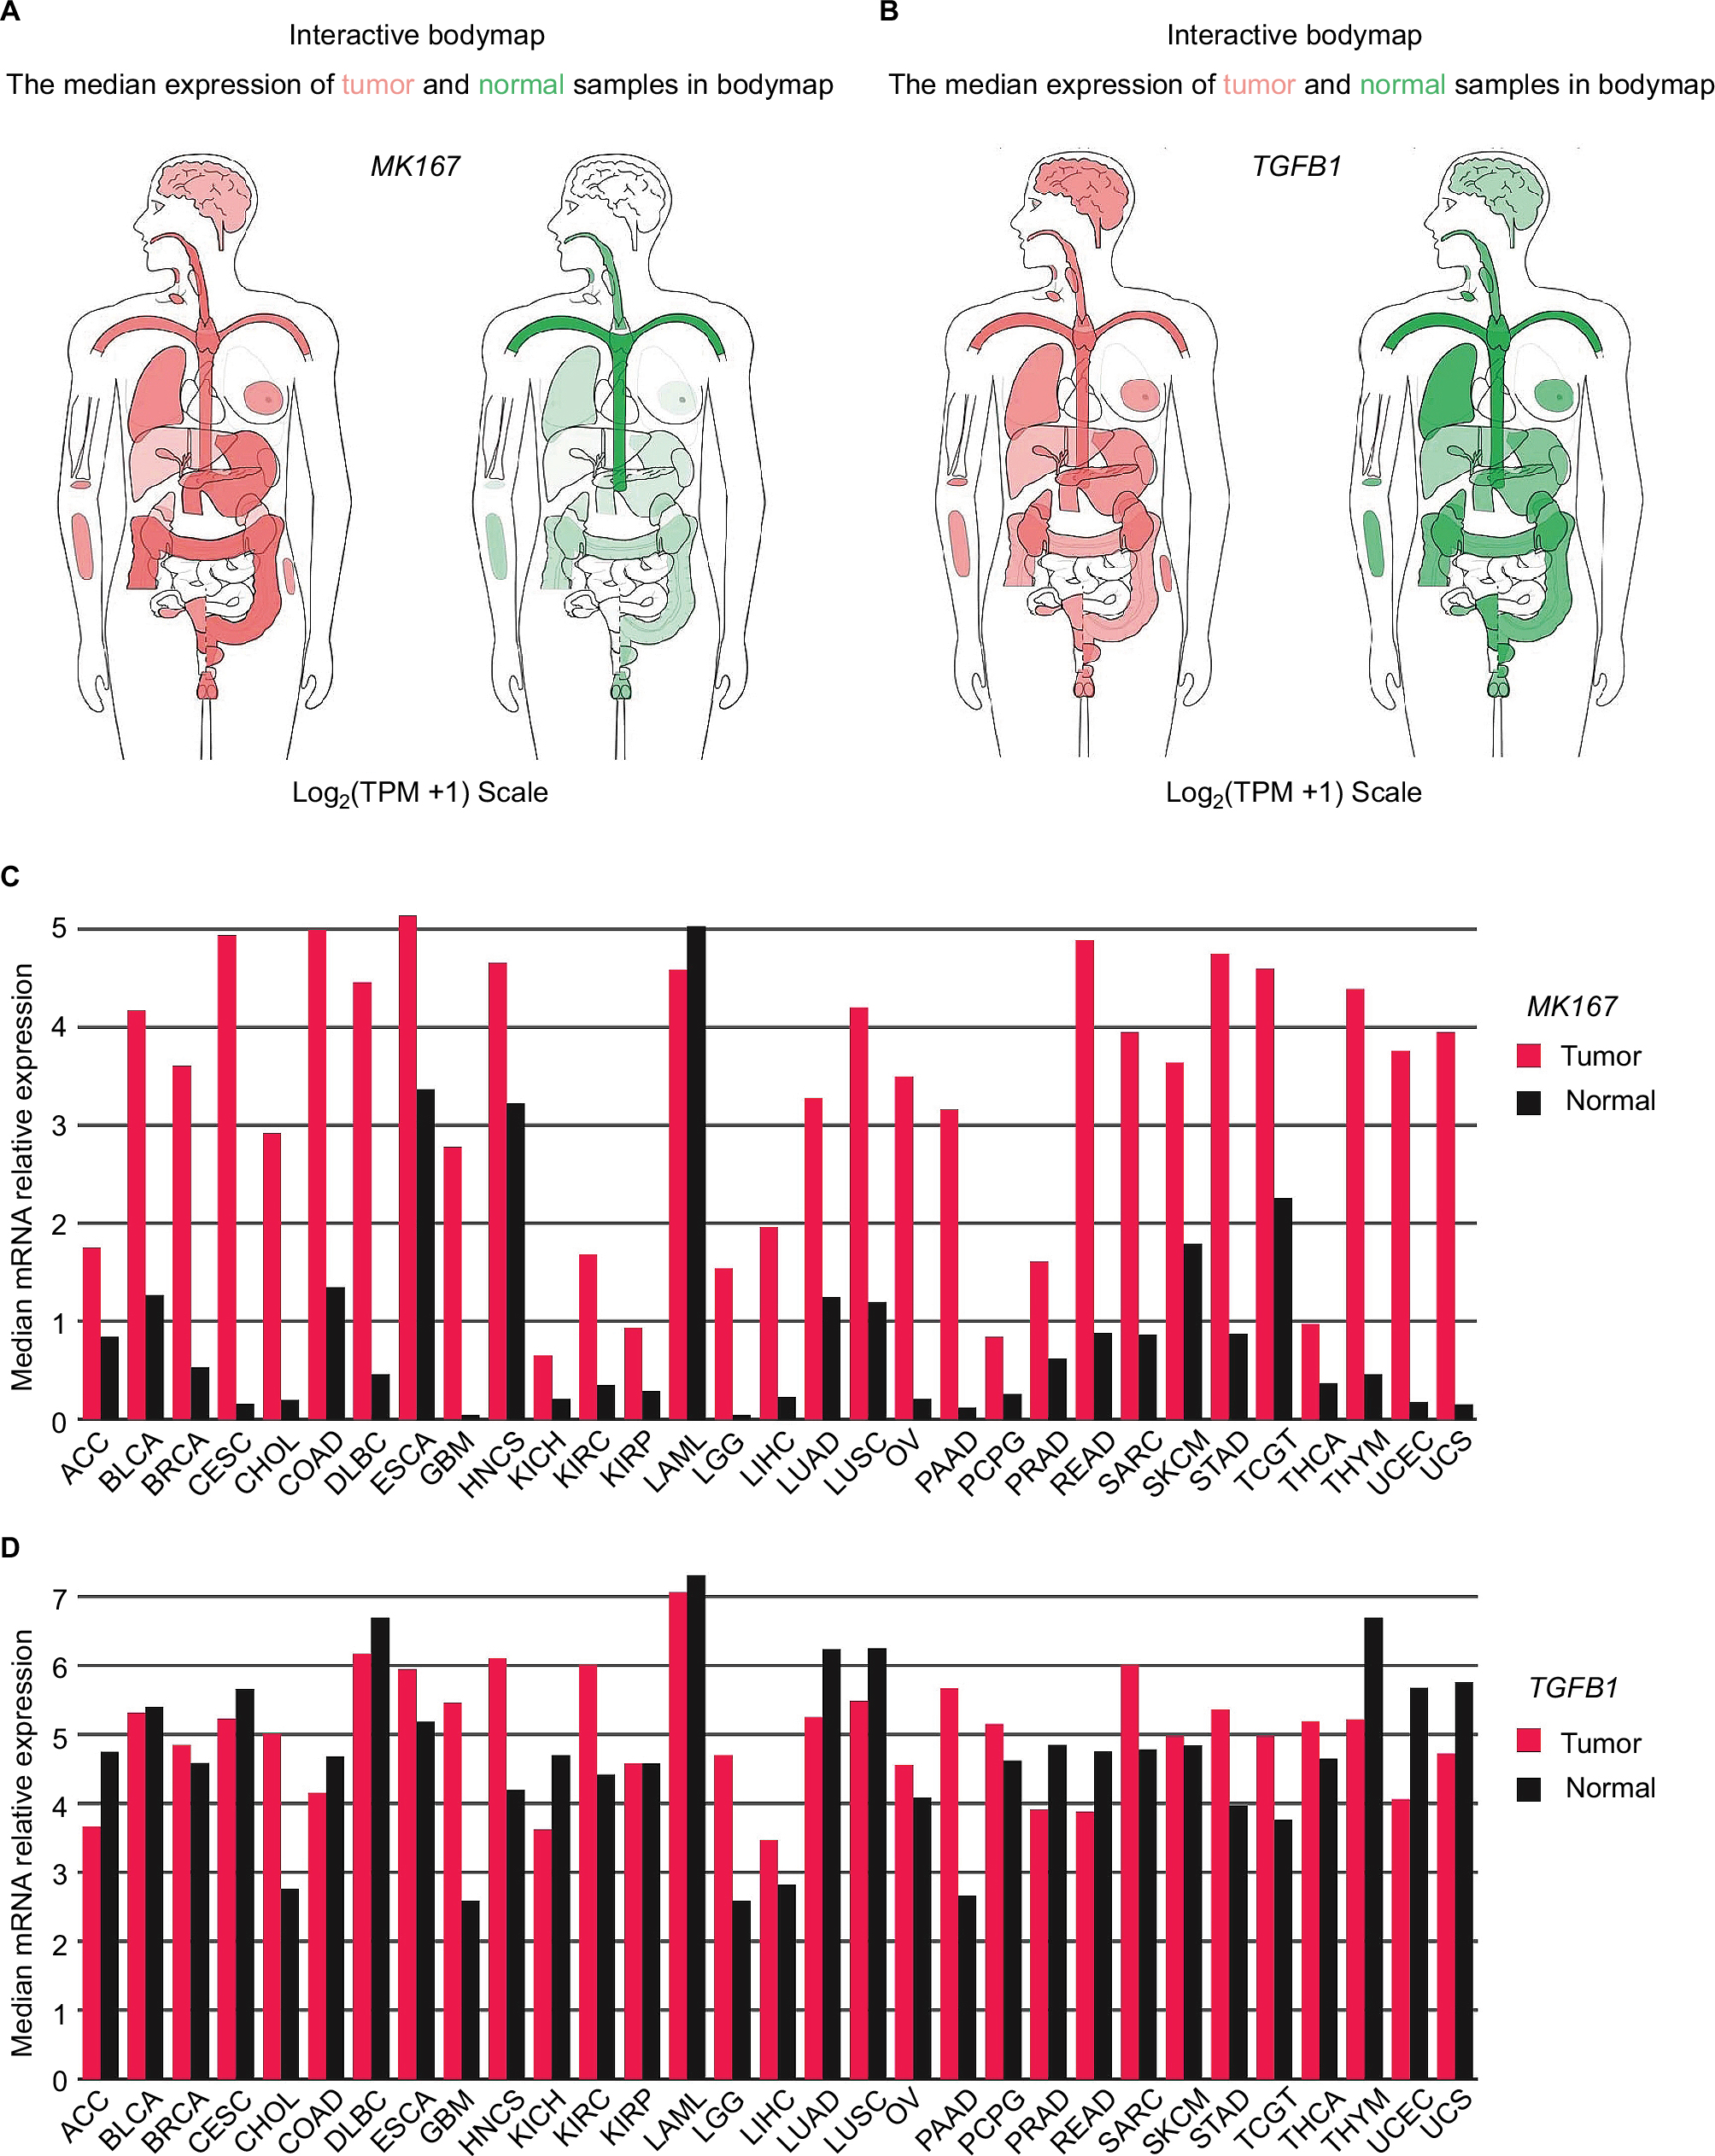 | Figure 1 MKI67 and TGFB1 mRNA expression levels distributed in bodymap and chromosomes and differences in cancer tissues. Notes: (A, B) The median expression of MKI67 and TGFB1 distributed in tumors (red) and normal tissues (green) in bodymap. (C, D) The gene expression profile across all tumor samples and paired normal tissues. The height of the bar represents the median expression of tumors (red) or normal tissues (black). Abbreviations: LIHC, liver hepatocellular carcinoma; TPM, transcripts per kilobase million. |
The association between TGFB1 and MKI67 expression and clinical outcomes in HCC patients in TCGA
We also evaluated the association between TGFB1 and MKI67 mRNA levels and OS and RFS in HCC patients using the GEPIA database. Gene mRNA levels above or below the cutoff values of the median divided the samples into high-expression and low-expression groups, respectively. We found that MKI67 mRNA levels were associated with OS (p=4.5×10⁻⁴, Figure 2A) and RFS (p=4.2×10⁻⁵, Figure 2B) of liver cancer patients. High MKI67 expression was an unfavorable predictor to the clinical outcomes of patients. However, no significant difference was found between TGFB1 mRNA levels and clinical outcomes of liver cancer patients. The correlation analysis showed that the TGFB1 and MKI67 mRNA levels were positively associated with GTEx normal tissue (r=0.29, p=2.3×10⁻³; Figure 2C) and TCGA liver cancer tissue (r=0.2, p=1.3×10⁻⁴; Figure 2D). We performed survival analysis using MKI67 mRNA levels normalized by TGFB1 expression. The results suggested that MKI67 expression was associated with the clinical outcomes of liver cancer patients (Figure 2E, F).
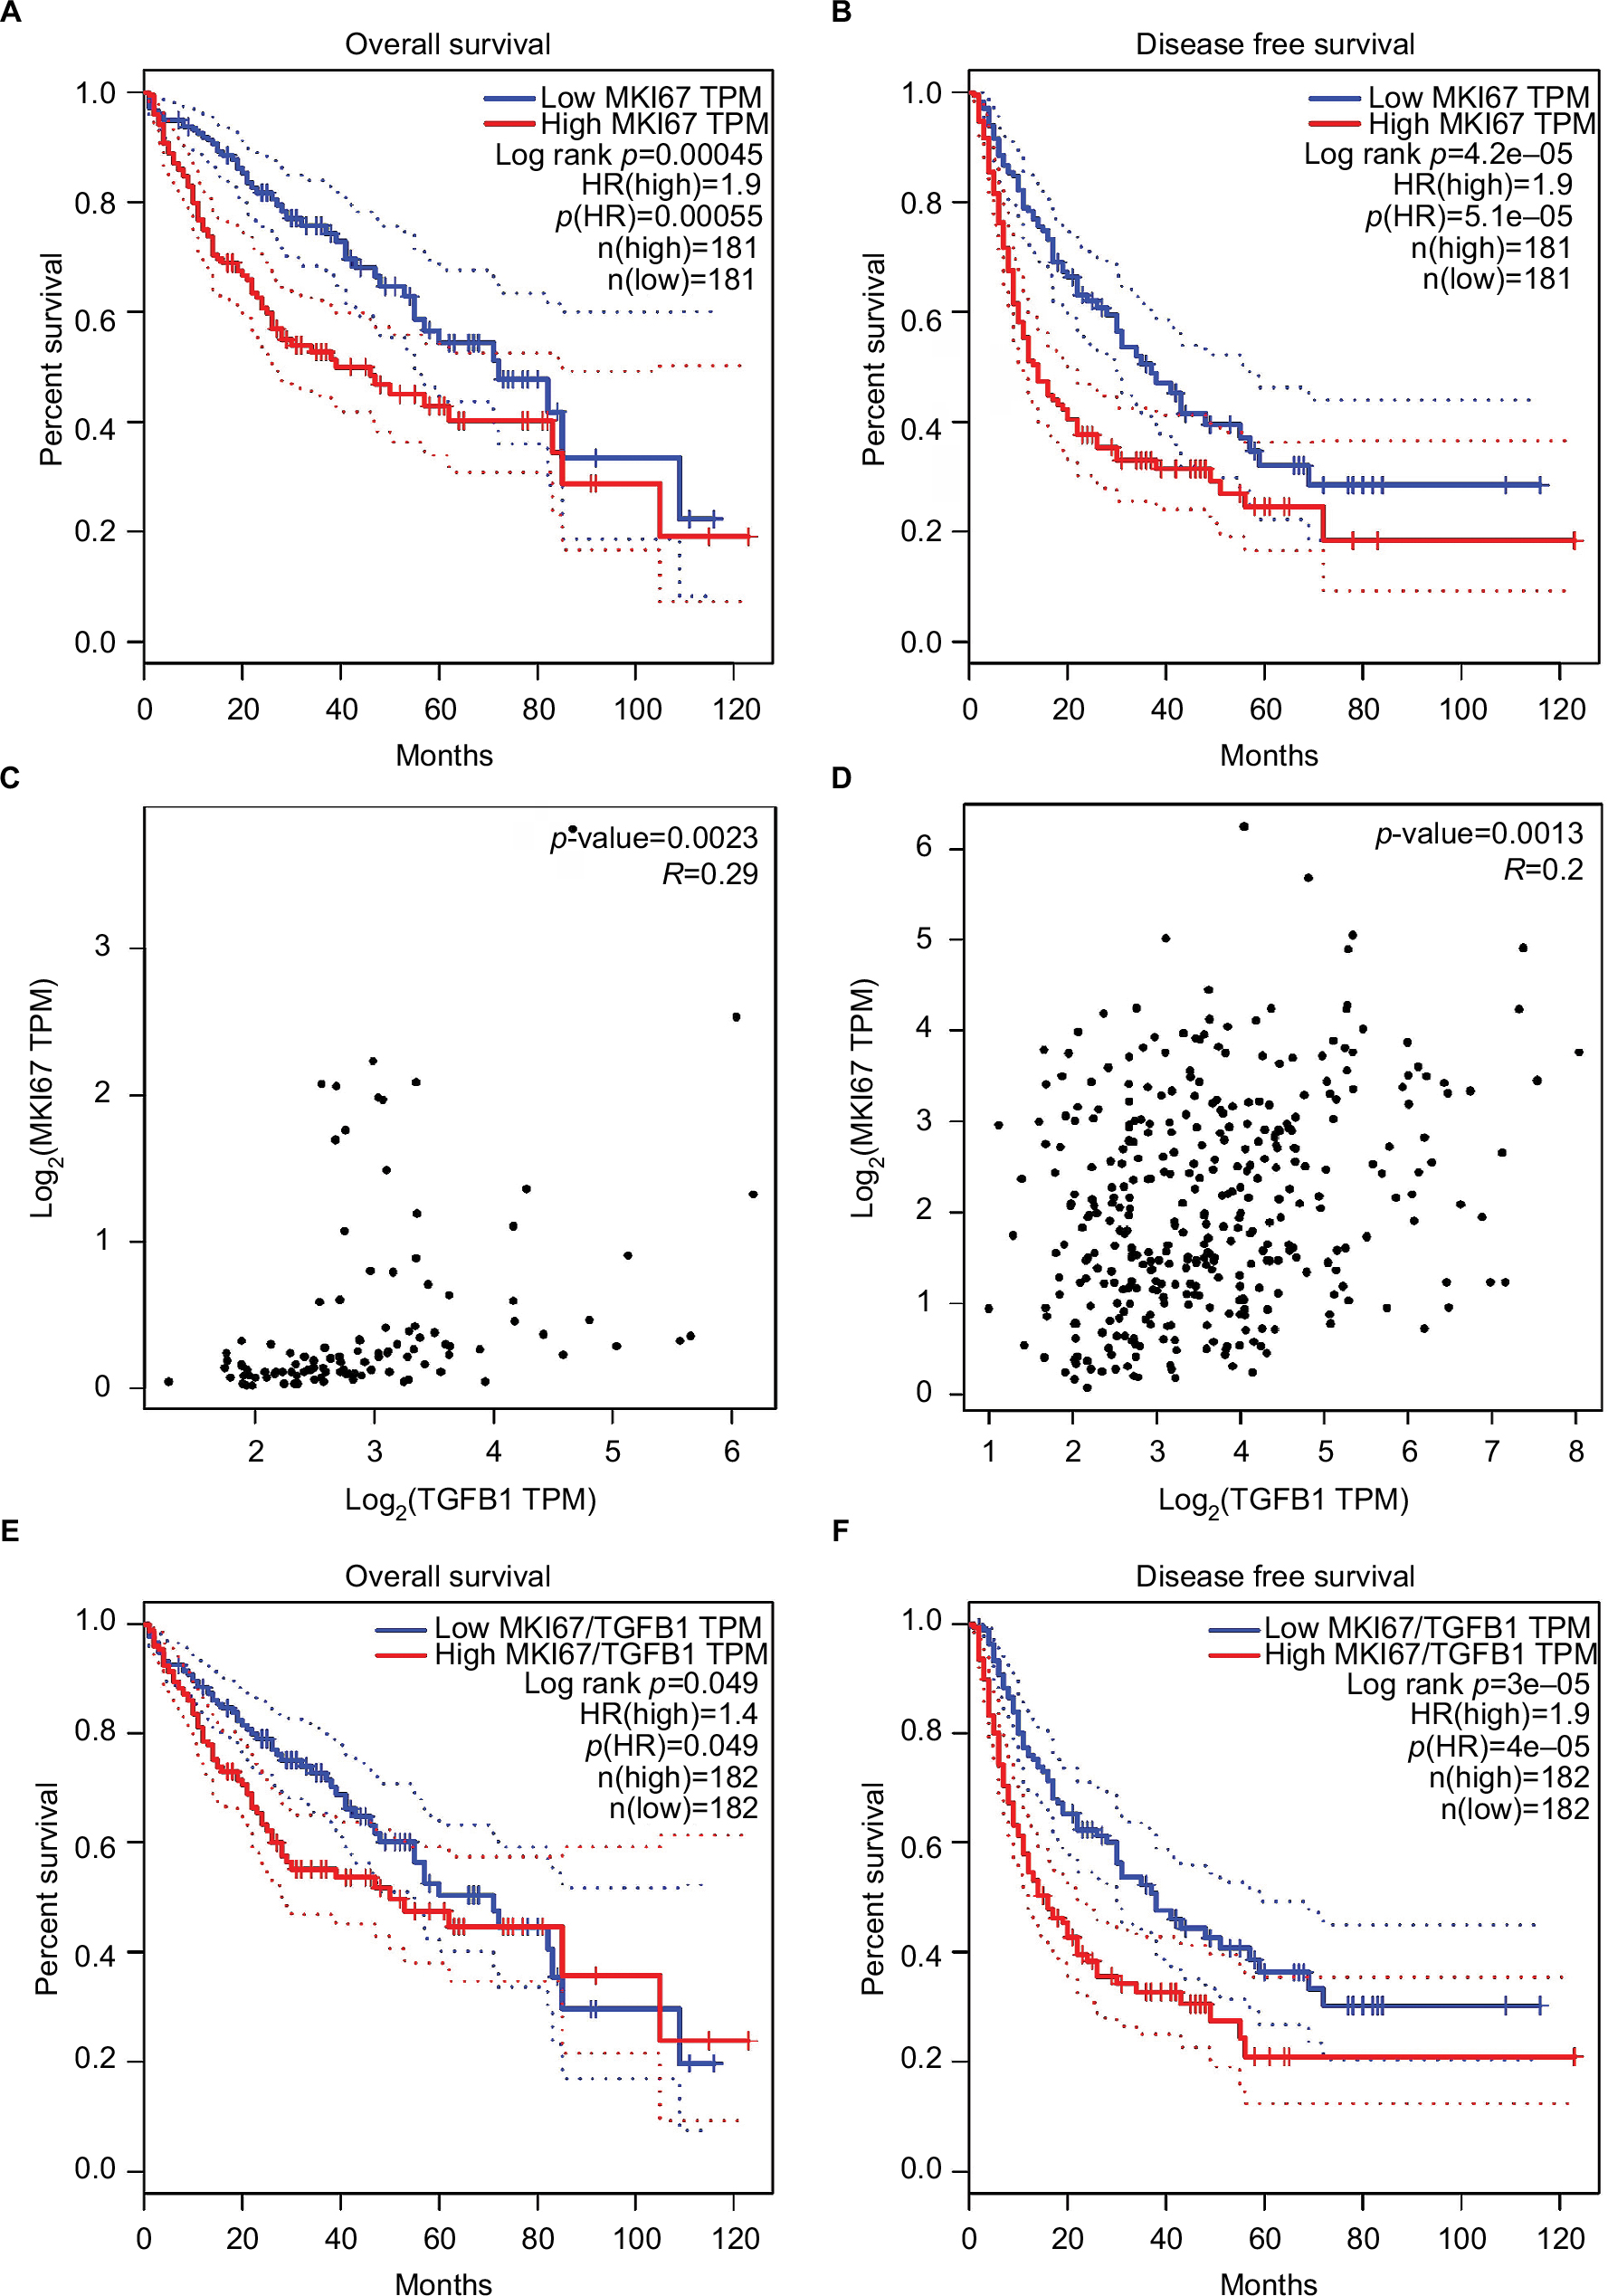 | Figure 2 The relationship of MKI67 expression levels with TGFB1 expression and clinical outcomes of patients in the LIHC and GTEx liver dataset analyzed in GEPIA. Notes: (A, B) The survival analysis of MKI67 expression level with overall survival and disease-free survival of liver cancer patients. The dotted line was estimated by the 95% CI. (C, D) The correlation of MKI67 and TGFB1 expression in the GTEx liver dataset and LIHC tumor tissues analyzed by Pearson’s correlation coefficient. (E, F) The survival analysis of MKI67 expression level normalized by TGFB1 expression with overall survival and disease-free survival of liver cancer patients. Abbreviations: GEPIA, Gene Expression Profiling Interactive Analysis; GTEx, Genotype-Tissue expression; HR, hazard ratio; LIHC, liver hepatocellular carcinoma; TPM, transcripts per kilobase million. |
The expression and clinical implication of TGFB1 and MKI67 in patients with HBV-related HCC
The results of Gene Set Enrichment Analysis suggested that the gene expression profiles of HCC tissues were upregulated in the cell cycle in Kyoto Encyclopedia of Genes and Genomes pathway analysis, and the cell division and cell cycle checkpoint in gene ontology analysis (Figure S3). MKI67 expression of tumor tissues was higher than of paired normal liver tissues (Figure 3A). Setting the cutoff value as the median, survival analysis showed MKI67 mRNA levels were associated with the OS of patients with HBV-related HCC (p=0.030, Figure 3B). Although the relationship between MKI67 expression and RFS of patients with HBV-related HCC did not reach statistical significance (p=0.142, Figure 3C), it was significantly associated with shorter RFS. Patients with high MKI67 mRNA level had a worse 60-month RFS (p=0.023, Figure 3D). The stratified result suggests that high MKI67 expression of HCC patients has a higher risk in clinical outcomes as to some favorable characteristics and stages, such as single nodule and BCLC 0-A (Table S1). The ROC analysis showed the prognosis value of MKI67 expression level in HCC tissues was high evidence (Figure S4). However, no significant difference in TGFB1 expression was found between tumor and paired normal liver tissues, and no statistical association was found in TGFB1 expression and clinical outcomes for patients with HBV-related HCC.
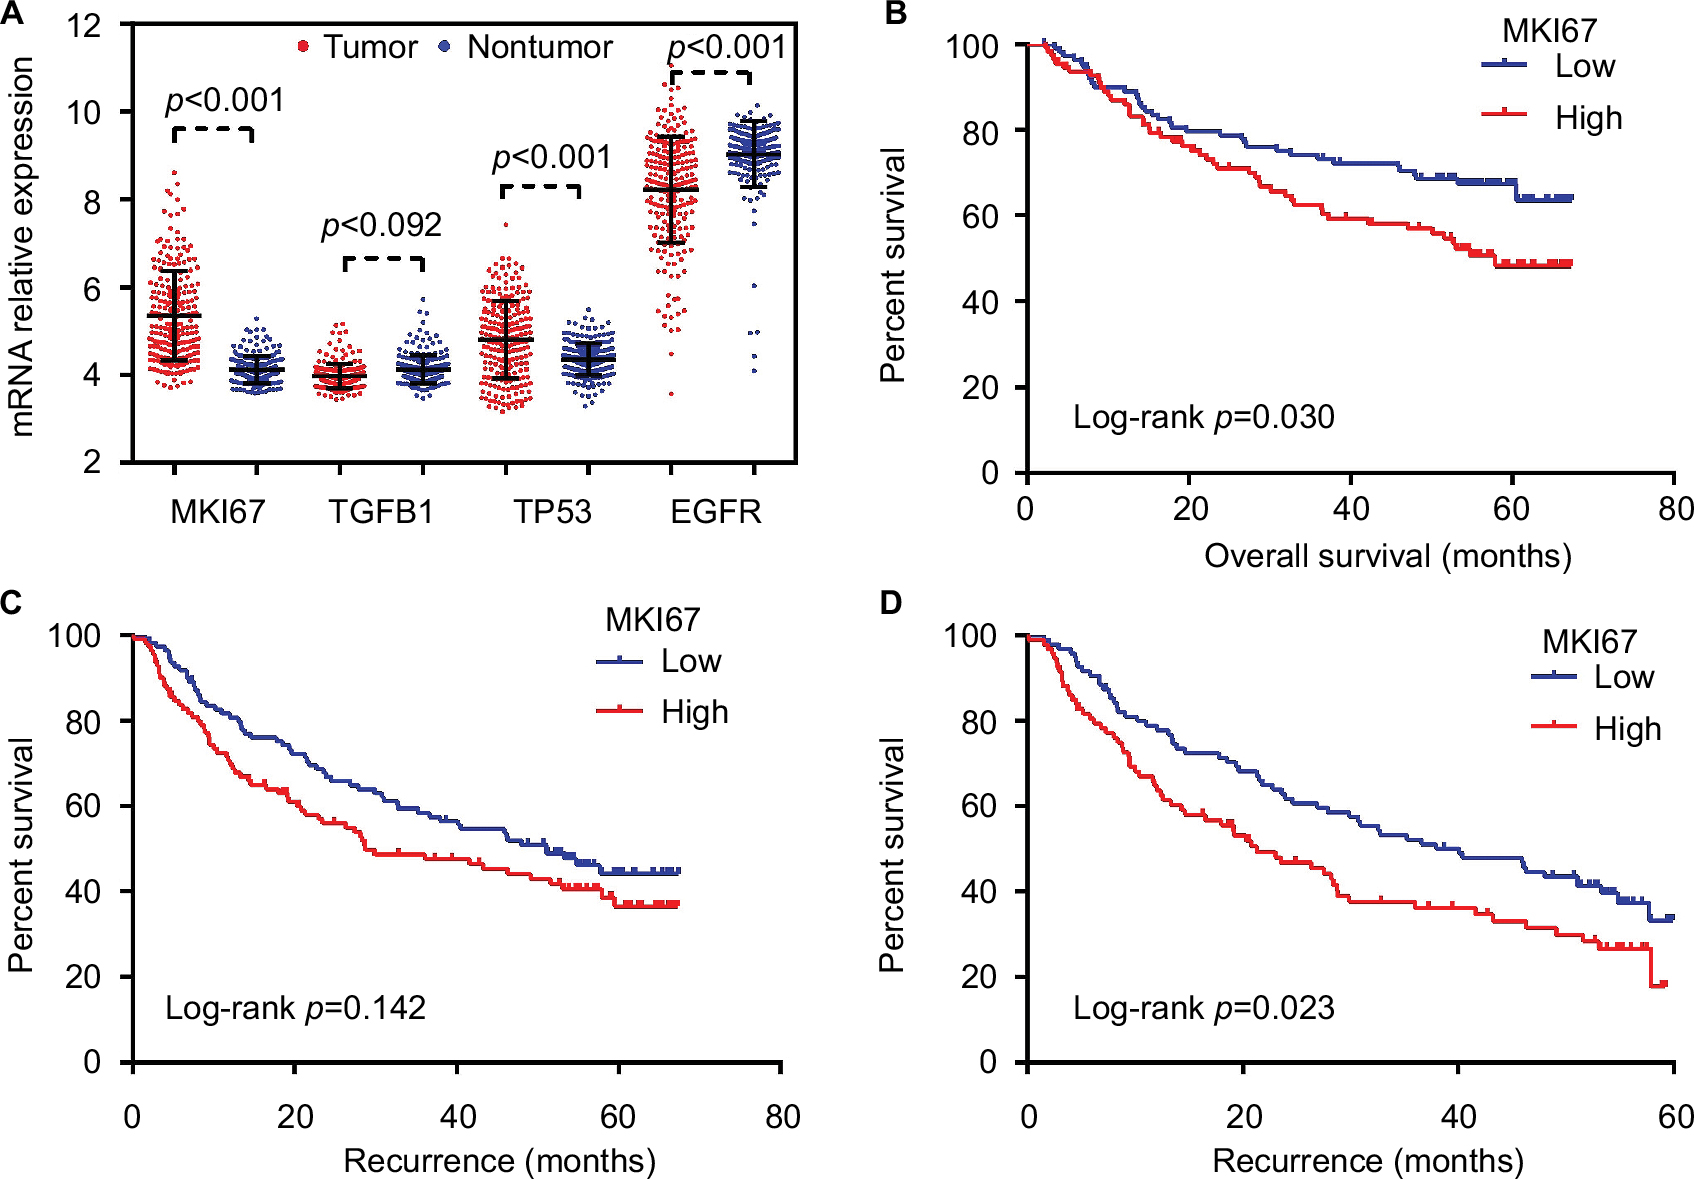 | Figure 3 The expression of MKI67, TGFB1, TP53, and EGFR in tumor and nontumor tissues and the survival analysis of MKI67 expression with overall survival and recurrence-free survival time of patients with HBV-related HCC were analyzed in GEO dataset (GEO accession: GSE14520). Notes: (A) The expression of MKI67, TGFB1, TP53, and EGFR in HCC tissues. (B) The survival analysis of MKI67 expression with overall survival in patients with HBV-related HCC. (C) The survival analysis of MKI67 expression with recurrence-free survival in patients with HBV-related HCC. (D) The survival analysis of MKI67 expression with 60-month recurrence-free survival in patients with HBV-related HCC. Abbreviations: GEO, Gene Expression Omnibus; HBV, hepatic B virus; HCC, hepatocellular carcinoma. |
The differential expression of TGFB1 and MKI67 in tissues and cells
Using the Xena analysis tool, we compared TGFB1 and MKI67 mRNA levels in different stages and types of liver cancer. It appeared that there was higher expression of MKI67 and TGFB1 mRNA in high histologic grades of liver cancer (Figure S5). Moreover, MKI67 and TGFB1 mRNA levels were relatively lower in HCC tissues than in fibrolamellar carcinoma and hepatocholangiocarcinoma (Figure S5). We further analyzed MKI67 and TGFB1 expression of different liver tissue types and identified that MKI67 expression was upregulated in tumor tissue, whereas the expression of TGFB1 in cirrhotic tissue was high (Figure 4A). From our conclusion of the results above, we further speculated that MKI67 and TGFB1 mRNA levels were tissue specific. Based on the results of the Cancer Cell Line Encyclopedia project, we did not find a copy number variation of MKI67 and TGFB1 expression in HepG2 cell line (Figure S6). We further explored the cell sites of MKI67 and TGFB1 expression in the Human Protein Atlas website; the MKI67 protein was detected in the nucleus, nucleoli, and nuclear bodies, whereas TGFB1 was detected in the cytosol (Figure 4B). In liver cancer tissues, the IHC analysis of TGFB1 and MKI67 proteins showed that the positive staining of TGFB1 appeared as brown particles in the cytosol, whereas the MKI67 protein staining was nuclear (Figure 4C).
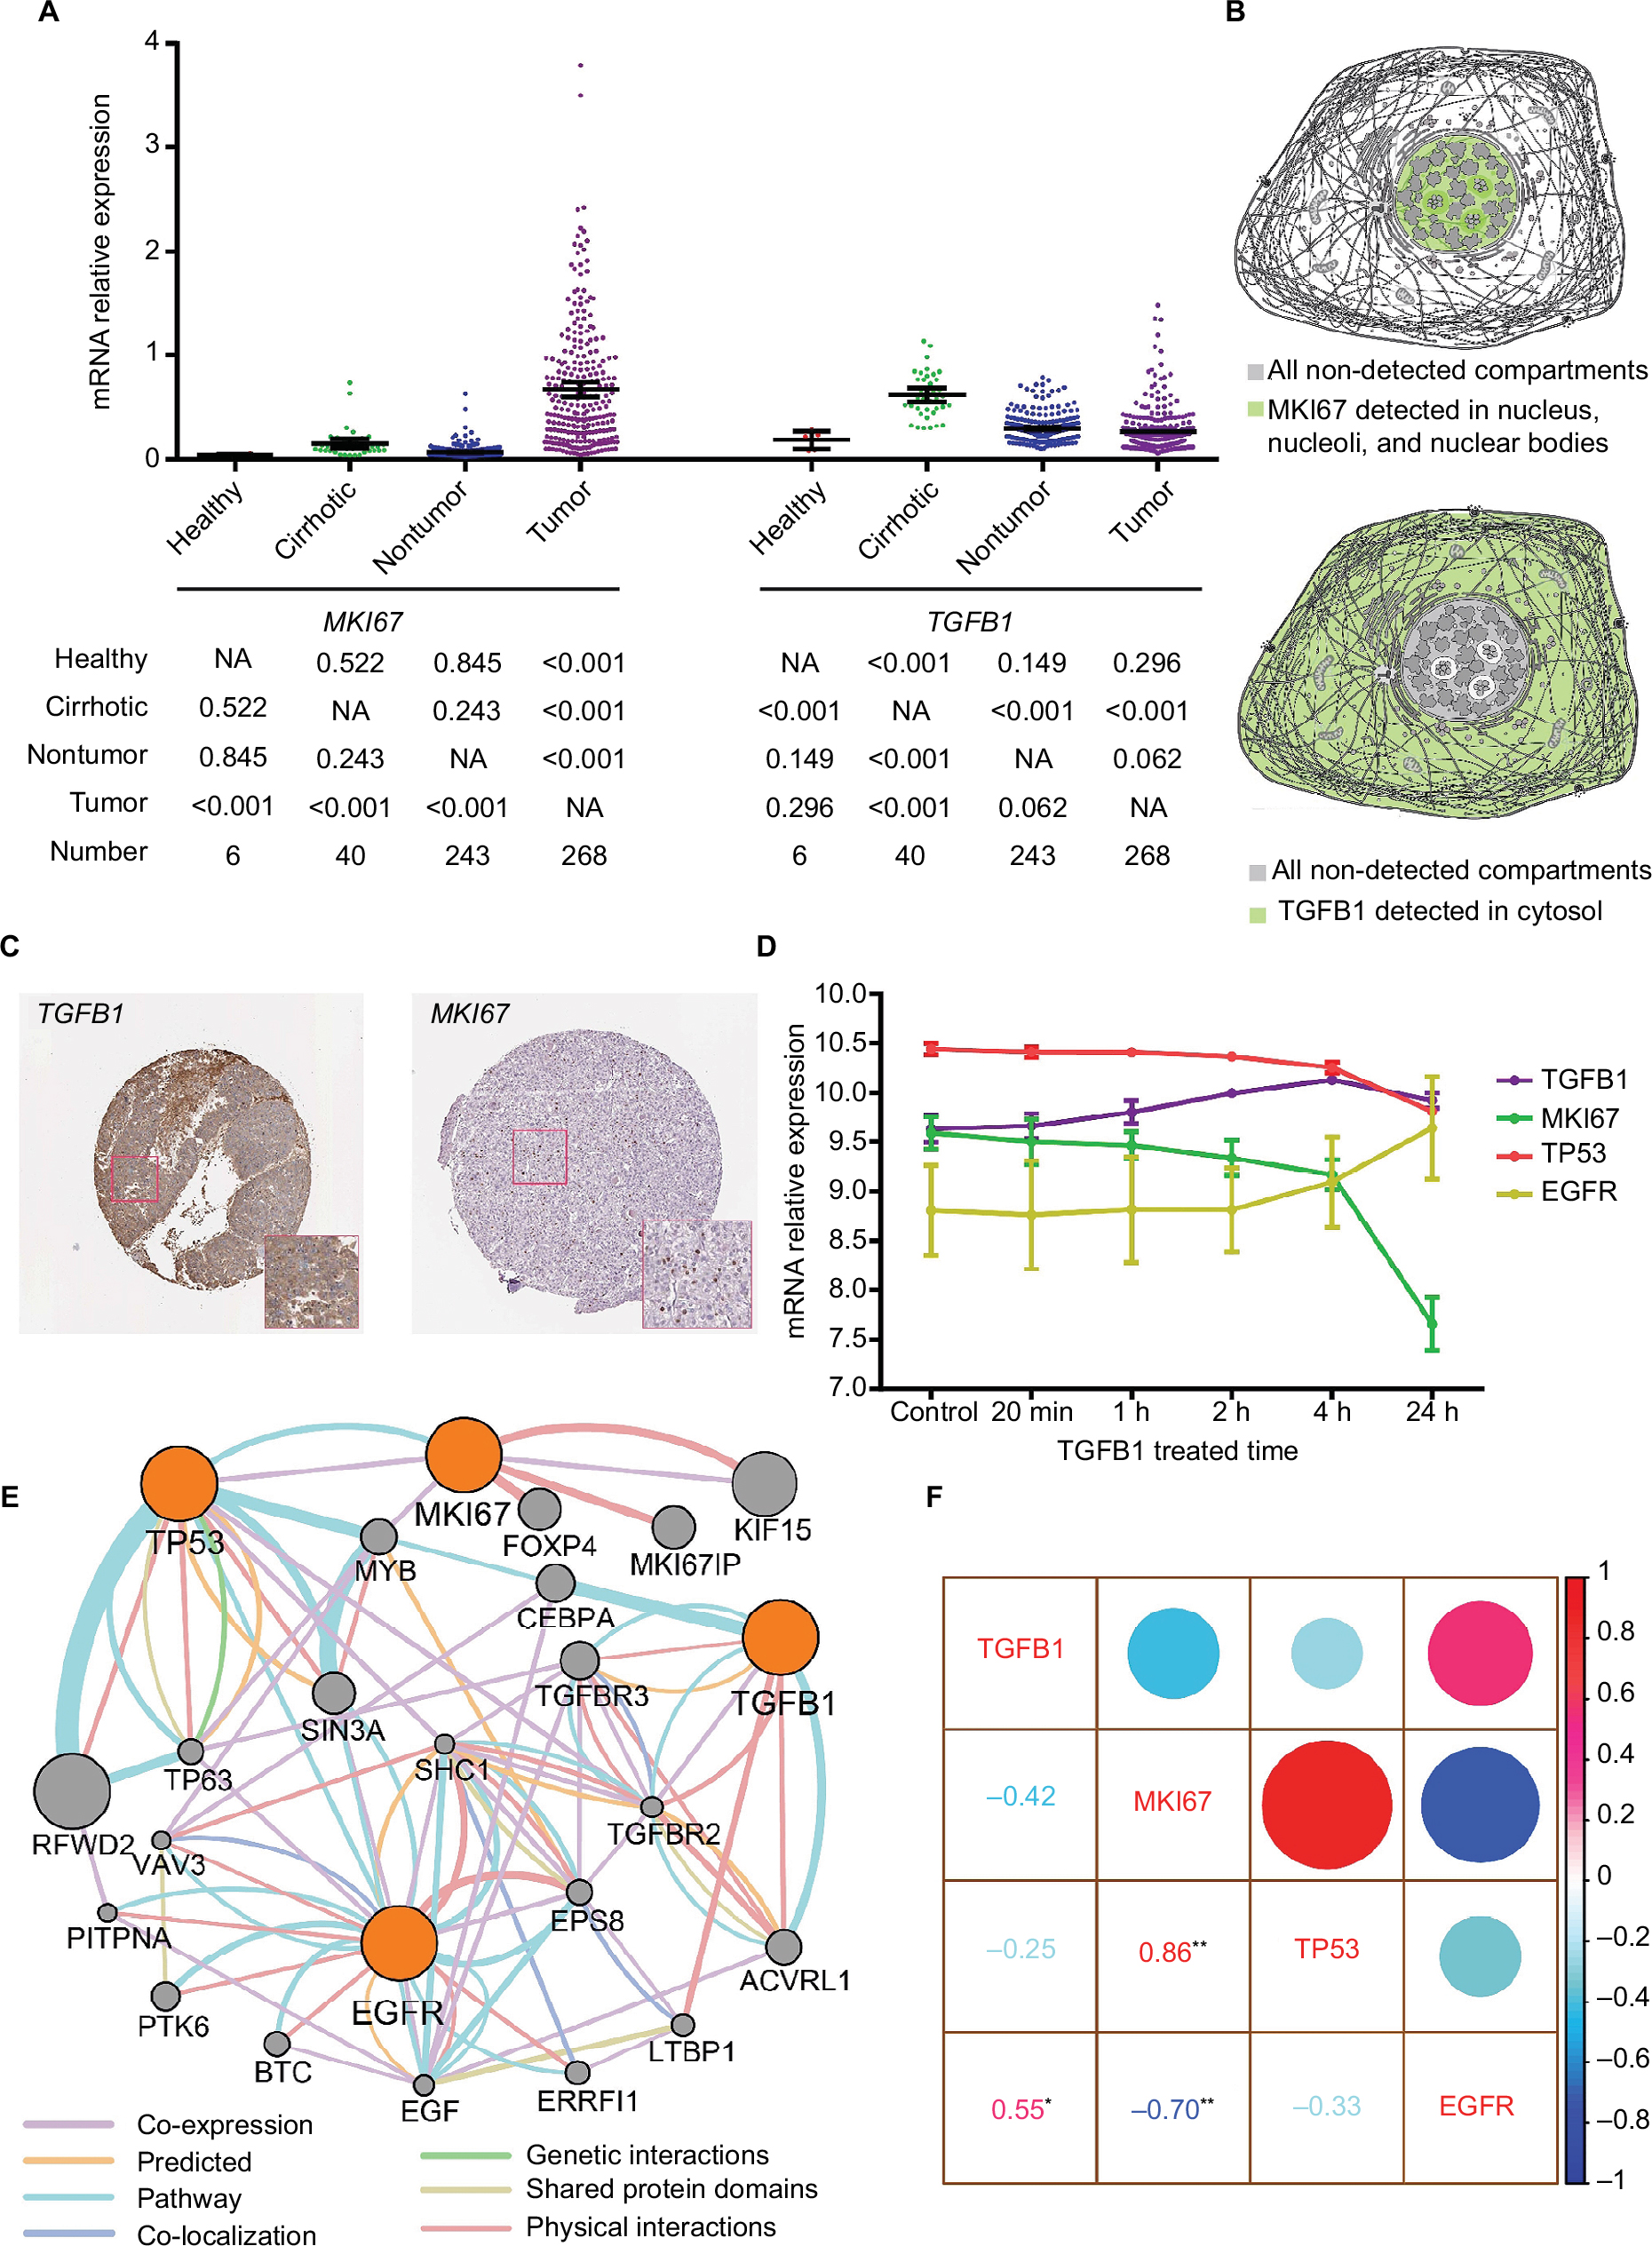 | Figure 4 The expression of MKI67 and TGFB1 in tissues and cell components and the relation between MKI67 and TGFB1. Notes: (A) The MKI67 and TGFB1 expression levels in different types of liver tissue were analyzed in GEO dataset (GEO accession: GSE25097). The values below the graph were calculated using an LSD-t test after a one-way ANOVA. (B) Model graphic of MKI67 and TGFB1 distributed in cell components. (C) Immunohistochemistry staining of MKI67 and TGFB1 in liver cancer tissue. (D) Dynamically changing gene expression in HepG2 cells upon stimulation with 1 ng/mL TGFB1 over time. (E) Pathway analysis of MKI67, TGFB1, TP53, and EGFR in GeneMANIA. (F) Correlation analysis of gene expression in HepG2 cells upon stimulation with 1 ng/mL TGFB1. *represents p<0.05; **represents p<0.01. Abbreviations: ANOVA, analysis of variance; GEO, Gene Expression Omnibus; LSD, Least Significant Difference; NA, not available. |
Changes in gene mRNA level in TGFB1-treated HepG2 cells
HepG2 cells were treated with TGFB1 along a time course and the gene mRNA levels were detected. We identified a change in TGFB1, MKI67, TP53, and EGFR expression over time. EGFR expression increased steadily in HepG2 cells after being stimulated by TGFB1. However, MKI67 and TP53 were downregulated to different degrees (Figure 4D). In particular, TGFB1 mRNA levels first increased and then decreased in treated HepG2 cells. In patients with HBV-related HCC, MKI67 and TP53 were overexpressed in tumors, whereas EGFR expression was high in nontumor tissue samples, but there was no significant difference in TGFB1 expression level among the tissue samples (Figure 3A). Gene interaction analysis via GeneMANIA showed that there were direct or indirect interactions among TGFB1, MKI67, TP53, and EGFR (Figure 4E). The results of correlation analysis indicated that TGFB1 and EGFR expression had a positive relationship (r=0.55, p<0.05; Figure 4F) and MKI67 mRNA had a positive relationship with TP53 (r=0.86, p<0.01; Figure 4F), but the relationship with EGFR was negative (r=−0.70, p<0.01; Figure 4F).
Predictive nomograms using MKI67 expression levels in clinical outcomes of patients with HBV-related HCC
Independent factors, including age, gender, MKI67 expression, cirrhosis, and BCLC stage, were integrated into the prognostic nomogram to predict the clinical outcomes of patients with HBV-related HCC. In the cohort of Zhongshan Hospital, we performed nomogram analysis for postoperative 1-, 3-, and 5-year OS and RFS of patients with HBV-related HCC using MKI67 mRNA levels (Figure 5A, B). The C-index for OS and RFS was 0.714 (95% CI: 0.655–0.773) and 0.674 (95% CI: 0.626–0.722), respectively. In the cohort of the First Affiliated Hospital of Guangxi Medical University, a prognostic nomogram was performed using MKI67 IHC staining for postoperative patients with HBV-related HCC (Figure 5C, D). The C-index for OS and RFS was 0.719 (95% CI: 0.645–0.793) and 0.577 (95% CI: 0.517–0.637), respectively. The calibration plot for the probability of survival at 1, 3, and 5 years after surgery showed an optimal agreement between the prediction by nomogram and the actual observation using MKI67 mRNA levels in the Zhongshan cohort (Figure 6A, B). However, there was a large bias between the predictive value and the actual value in the Guangxi cohort when using MKI67 IHC staining (Figure 6C, D). Moreover, a 5-year RFS nomogram could not be performed for the Guangxi cohort due to the number of samples.
 | Figure 5 Postoperative prognostic nomogram for patients with HBV-related HCC in (A, B) Zhongshan and (C, D) Guangxi cohorts. Abbreviations: BCLC, Barcelona Clinic Liver Cancer; HBV hepatic B virus; HCC, hepatocellular carcinoma; OS, overall survival; RFS, recurrence-free survival. |
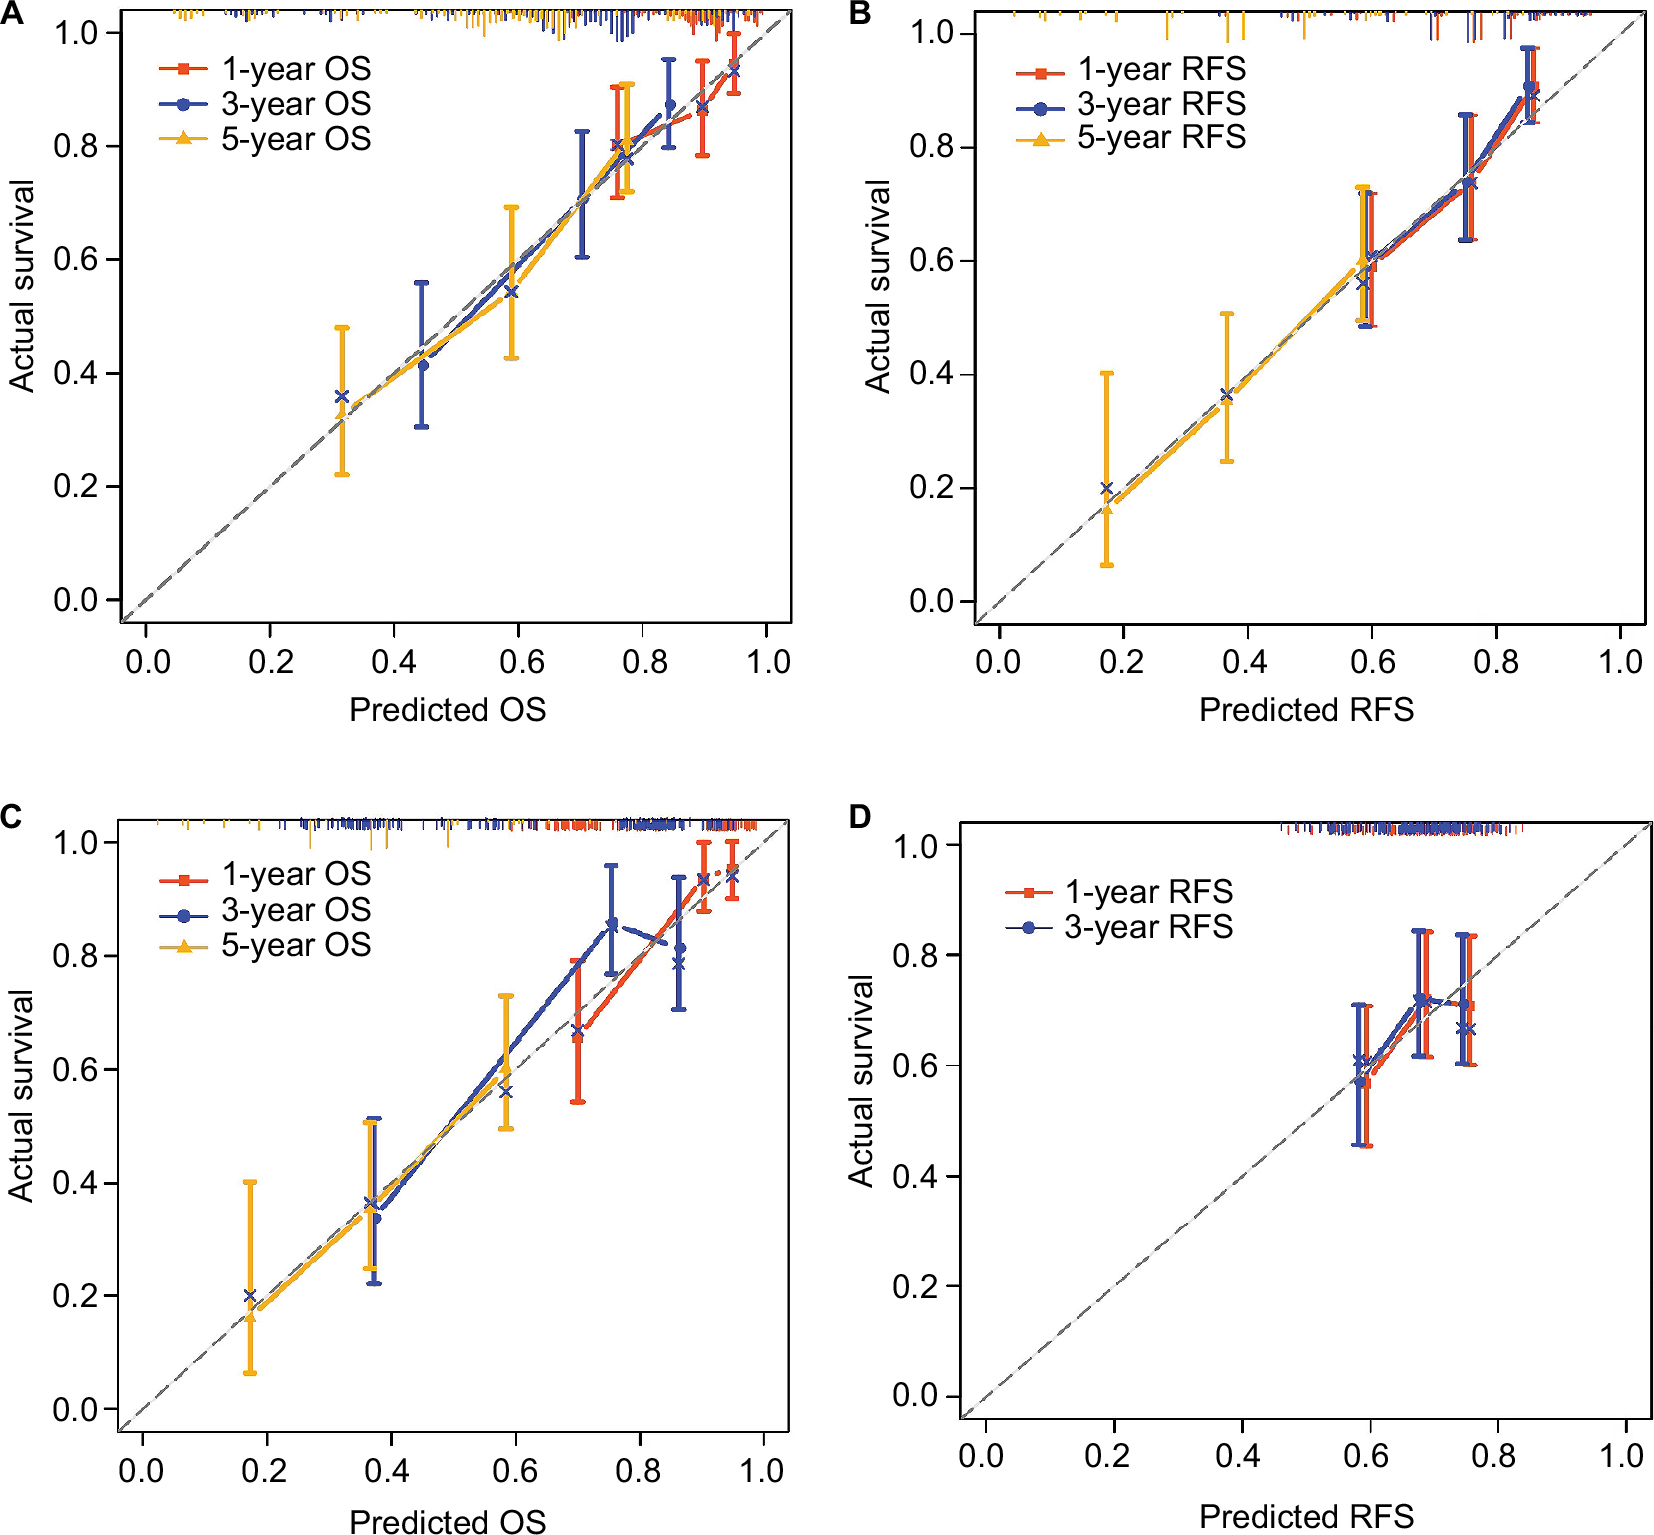 | Figure 6 Calibration curves for predicting patient survival at each time point in the (A, B) Zhongshan and (C, D) Guangxi cohorts. Notes: Nomogram-predicted OS and RFS are plotted on the x-axis; actual OS and RFS are plotted on the y-axis. A plot along the 45° line would indicate a perfect calibration model in which the predicted probabilities are identical to the actual outcomes. Abbreviations: OS, overall survival; RFS, recurrence-free survival. |
Discussion
In this study, we identified that genes associated with the cell cycle and division were upregulated in liver cancer tissue. Furthermore, MKI67 expression was associated with TGFB1 expression in liver cancer tissues and a HepG2 cell line. Higher MKI67 expression level in patients with HBV-related HCC resulted in a worse OS and RFS. Moreover, MKI67 expression combined with cirrhosis and BCLC stages can predict the clinical outcomes of patients with HBV-related HCC.
TGF-β signaling in cancer is controversial because it not only acts as a tumor suppressor regulating cell proliferation, but also as a tumor promoter by being a potent inducer of the EMT with a consequent effect on tumoral dissemination.29 Early in the process of carcinogenesis, TGFB1 suppresses tumors and arrests cell growth;30 in later and advanced tumor stages, TGFB1 potentiates EMT, angiogenesis, tumor progression, invasion, and metastasis.31,32 The switch from tumor suppression to promotion is not well understood, but intrinsic and extrinsic factors seem to play important roles. The role of TGFB1 in the progression of chronic liver damage, in which it stimulates fibrogenesis through activation of hepatic stellate cells, and the subsequent progression toward HCC are widely recognized.33–35
TGF-β is a well-known signaling pathway promoting EMT. Previous studies have shown that EMT can induce resistance to EGFR-targeted therapy in HCC cell lines,36 and mesenchymal-type HCC cells have increased resistance to sorafenib.36,37 A study had demonstrated that higher TGFB1 expression levels were associated with poorer sensitivity to sorafenib in preclinical models of HCC.38 High pretreatment serum TGFB1 levels were associated with poor prognoses and increased serum TGFB1 levels were associated with disease progression in patients with advanced HCC. Our result indicated that EGFR expression was upregulated in HCC cells when they were treated with TGFB1. Furthermore, TCGA data showed that TGFB1 expression increases in patients with advanced liver cancer, which indicates the possibility of metastasis and a worse prognosis.
TGFB1 expression levels were not associated with the clinical outcomes of liver cancer patients in TCGA data when using GEPIA tools. However, a recent study showed HCC patients who harbored high TGFB1 expression levels had a shorter OS, but not RFS.39 This may suggest that the prognostic value of TGFB1 was tissue specific. In contrast, Dituri et al40 identified that TGFB1 was not related to either the BCLC stages or the clinical outcomes of HCC patients. These inconsistent results suggest that some confounding factors may contribute to the contradictory effect on the prognostic value of TGFB1. In our results, TGFB1 expression level was upregulated in cirrhosis tissue, but not in tumor tissues.
In humans, the development of HCC is associated with chronic liver inflammation, fibrosis, and its subsequent irreversible cirrhosis.41 Exposures to chronic hepatitis virus infection induce liver injury and result in sustained cycles of necrosis, inflammation, and proliferation of hepatocytes. In the conditions associated with HBV, repeated episodes of liver cell destruction and regeneration consequently foster an environment culminating in fibrosis and cirrhosis. Some types of self-modified cells in a microenvironment may contribute to changes in HCC cancer stem cell properties. HBV can inhibit TGFB1-induced apoptosis of HepG2 cells and promote tumor growth in BALB/c nude mice through upregulating the expression of Smad7 (a TGF-β pathway inhibitory factor).42
In this study, when HepG2 cells were stimulated with 1 ng/mL TGFB1 over different times, TGFB1 expression levels increased, but were later inhibited. Furthermore, MKI67 expression levels in HCC cells continued to decline upon stimulation. These findings are in accordance with recent studies indicating that HepG2 cell proliferation and viability are affected by the dose and treatment time of TGFB1.43,44 Evaluation of TGFB1 and MKI67 expression on the Human Protein Atlas website indicated that TGFB1 and MKI67 were expressed in different components of the cell. There was a weak positive correlation between MKI67 expression levels and TGFB1 in normal liver and cancer tissues. Pathway prediction analysis showed that TGFB1 indirectly interacted with MKI67. There was a positive relationship between MKI67 expression and TP53 expression in liver cancer cells. However, further experiments are needed to clarify the underlying mechanism of the pathways associated with TGFB1 and MKI67.
Although TGFB1 expression was associated with the clinical outcomes of HCC patients, the prognostic value of TGFB1 expression level in patients with HBV-related HCC remains uncertain due to the controversial behavior of TGFB1 and the various etiologic factors detected by the above results. However, MKI67 expression levels were associated with the prognosis of liver cancer patients. After mRNA expression normalized using TGFB1, MKI67 expression level also can predict the clinical outcomes of patients and be used to distinguish tumor component from tissues. Furthermore, MKI67 expression combined with cirrhosis and BCLC stage can predict the clinical outcomes of patients with HBV-related HCC.
Several limitations in this study warrant discussion. First, the results are based on the data from public databases and require further studies (clinical, in vivo, and in vitro) to be validated. In addition, TGFB1 has different transcriptions in GSE14520; therefore, we could not normalize MKI67 expression levels exactly in HBV-related HCC tissues. Finally, our research is preliminary and our sample size is limited; therefore, additional studies with larger sample sizes and multiple centers are needed to conduct a validation nomogram and clarify our results.
Conclusion
MKI67 expression level was associated with TGFB1 expression in liver cancer tissues and a HepG2 cell line. Higher levels of MKI67 expression in patients with HBV-related HCC resulted in a worse OS and RFS. Furthermore, MKI67 expression combined with cirrhosis and BCLC stages could predict the clinical outcomes of patients with HBV-related HCC.
Acknowledgments
This work was supported in part by the National Nature Science Foundation of China (Nos.: 81560535, 81072321, 30760243, 30460143, and 30560133), 2009 Program for New Century Excellent Talents in University (NCET), Guangxi Nature Sciences Foundation (No.: GuiKe Gong 1104003A-7), and Guangxi Health Ministry Medicine Grant (Key-Scientific Research-Grant Z201018). We would also like to acknowledge the support by the National Key Clinical Specialty Programs (General Surgery and Oncology) and the Key Laboratory of Early Prevention and Treatment for Regional High-Incidence-Tumor (Guangxi Medical University), Ministry of Education, China.
This project has been funded in part with federal funds from the National Cancer Institute, National Institutes of Health, under contract HHSN26120080001E. The content of this publication does not necessarily reflect the views or policies of the Department of Health and Human Services, and the mention of trade names, commercial products, or organizations does not imply endorsement by the US Government. This research was supported in part by the Intramural Research Program of the NIH, National Cancer Institute, Center for Cancer Research.
Disclosure
The authors report no conflicts of interest in this work.
References
Ferlay J, Soerjomataram I, Dikshit R, et al. Cancer incidence and mortality worldwide: sources, methods and major patterns in GLOBOCAN 2012. Int J Cancer. 2015;136(5):E359–E386. | ||
Zhang W, Sun B. Impact of age on the survival of patients with liver cancer: an analysis of 27,255 patients in the SEER database. Oncotarget. 2015;6(2):633. | ||
Bruix J, Llovet JM. Major achievements in hepatocellular carcinoma. Lancet. 2009;373(9664):614. | ||
Shimozawa N, Hanazaki K. Longterm prognosis after hepatic resection for small hepatocellular carcinoma. J Am Coll Surg. 2004;198(3):356. | ||
Majumdar A, Curley SA, Wu X, et al. Hepatic stem cells and transforming growth factor β in hepatocellular carcinoma. Nat Rev Gastroenterol Hepatol. 2012;9(9):530–538. | ||
Giannelli G, Villa E, Lahn M. Transforming growth factor-β as a therapeutic target in hepatocellular carcinoma. Cancer Res. 2014;74(7):1890–1894. | ||
Mazzocca A, Fransvea E, Dituri F, Lupo L, Antonaci S, Giannelli G. Down-regulation of connective tissue growth factor by inhibition of transforming growth factor β blocks the tumor–stroma cross-talk and tumor progression in hepatocellular carcinoma. Hepatology. 2010;51(2):523–534. | ||
Peng L, Zhou Y, Dong L, et al. TGF-β1 upregulates the expression of triggering receptor expressed on myeloid cells 1 in murine lungs. Sci Rep. 2016;6:18946. | ||
Massagué J. TGFβ in cancer. Cell. 2008;134(2):215–230. | ||
Giannelli G, Rani B, Dituri F, Cao Y, Palasciano G. Moving towards personalised therapy in patients with hepatocellular carcinoma: the role of the microenvironment. Gut. 2014;63(10):1668–1676. | ||
Sasaki K, Murakami T, Kawasaki M, Takahashi M. The cell cycle associated change of the Ki-67 reactive nuclear antigen expression. J Cell Physiol. 1987;133(3):579. | ||
Maeda T, Takenaka K, Adachi E, et al. Small hepatocellular carcinoma of single nodular type: a specific reference to its surrounding cancerous area undetected radiologically and macroscopically. J Surg Oncol. 1995;60(2):75–79. | ||
Ng IO, Na J, Lai EC, Fan ST, Ng M. Ki-67 antigen expression in hepatocellular carcinoma using monoclonal antibody MIB1. A comparison with proliferating cell nuclear antigen. Am J Clin Pathol. 1995;104(3):313. | ||
Shirabe K, Kitamura M, Tsutsui S, Maeda T, Matsumata T, Sugimachi K. A long-term survivor of ruptured hepatocellular carcinoma after hepatic resection. J Gastroenterol Hepatol. 1995;10(3):351. | ||
Luo Y, Ren F, Liu Y, et al. Clinicopathological and prognostic significance of high Ki-67 labeling index in hepatocellular carcinoma patients: a meta-analysis. Int J Clin Exp Med. 2015;8(7):10235. | ||
Glazer ES, Welsh E, Pimiento JM, Teer JK, Malafa MP. TGFβ1 overexpression is associated with improved survival and low tumor cell proliferation in patients with early-stage pancreatic ductal adenocarcinoma. Oncotarget. 2017;8(1):999–1006. | ||
gepia.cancer-pku. cn [homepage on the Internet]. China: BIOPIC, School of Life Sciences, Peking University, 2017 [updated April 12, 2017]. Available from: http://gepia.cancer-pku. cn/. Accessed November 25, 2017. | ||
xena.ucsc.edu [homepage on the Internet]. America: the University of California, Santa Cruz, 2017 [updated November 2, 2017]. Available from: https://xenabrowser.net/datapages/?hub=https://tcga.xenahubs.net:443. Accessed November 24, 2017. | ||
Roessler S, Jia H-L, Budhu A, et al. A unique metastasis gene signature enables prediction of tumor relapse in early-stage hepatocellular carcinoma patients. Cancer Res. 2010;70(24):10202–10212. | ||
Subramanian A, Tamayo P, Mootha VK, et al. Gene set enrichment analysis: a knowledge-based approach for interpreting genome-wide expression profiles. Proc Natl Acad Sci USA. 2005;102(43):15545–15550. | ||
Tung EKK, Mak CKM, Fatima S, et al. Clinicopathological and prognostic significance of serum and tissue Dickkopf-1 levels in human hepatocellular carcinoma. Liver Int. 2011;31(10):1494–1504. | ||
Abnaof K, Mallela N, Walenda G, et al. TGF-β stimulation in human and murine cells reveals commonly affected biological processes and pathways at transcription level. BMC Syst Biol. 2014;8(1):55. | ||
Yang Ck, Wang Xk, Liao Xw, et al. Aldehyde dehydrogenase 1 (ALDH1) isoform expression and potential clinical implications in hepatocellular carcinoma. PLoS One. 2017;12(8):e0182208. | ||
Yang C-K, Yu T-D, Han C-Y, et al. Genome-wide association study of MKI67 expression and its clinical implications in HBV-related hepatocellular carcinoma in Southern China. Cell Physiol Biochem. 2017;42(4):1342–1357. | ||
Harrell FE Jr. rms: Regression Modeling Strategies. R package version 4.0-0. 2013. | ||
r-project.org [homepage on the Internet]. Austria: R Foundation for Statistical Computing, Vienna, 2017 [updated March 10, 2018]. Available from: https://mirrors.ustc.edu.cn/CRAN/. Accessed November 14, 2017. | ||
Iasonos A, Schrag D, Raj GV, Panageas KS. How to build and interpret a nomogram for cancer prognosis. J Clin Oncol. 2008;26(8):1364–1370. | ||
Liang W, Zhang L, Jiang G, et al. Development and validation of a nomogram for predicting survival in patients with resected non-small-cell lung cancer. J Clin Oncol. 2015;33(8):861–869. | ||
Pickup M, Novitskiy S, Moses HL. The roles of TGFβ in the tumour microenvironment. Nat Rev Cancer. 2013;13(11):788. | ||
Principe DR, Doll JA, Bauer J, et al. TGF-β: duality of function between tumor prevention and carcinogenesis. J Natl Cancer Inst. 2014;106(2):djt369. | ||
Derynck R, Akhurst RJ, Balmain A. TGF-β signaling in tumor suppression and cancer progression. Nat Genet. 2001;29(2):117–129. | ||
Meulmeester E, Ten Dijke P. The dynamic roles of TGF-β in cancer. J Pathol. 2011;223(2):206–219. | ||
Dewidar B, Soukupova J, Fabregat I, Dooley S. TGF-β in hepatic stellate cell activation and liver fibrogenesis: updated. Curr Pathobiol Rep. 2015;3(4):291–305. | ||
Bissell DM. Chronic liver injury, TGF-[beta], and cancer. Exp Mol Med. 2001;33(4):179. | ||
Giannelli G, Mazzocca A, Fransvea E, Lahn M, Antonaci S. Inhibiting TGF-β signaling in hepatocellular carcinoma. Biochim Biophys Acta. 2011;1815(2):214–223. | ||
van Zijl F, Mall S, Machat G, et al. A human model of epithelial to mesenchymal transition to monitor drug efficacy in hepatocellular carcinoma progression. Mol Cancer Ther. 2011;10(5):850–860. | ||
Fuchs BC, Fujii T, Dorfman JD, et al. Epithelial-to-mesenchymal transition and integrin-linked kinase mediate sensitivity to epidermal growth factor receptor inhibition in human hepatoma cells. Cancer Res. 2008;68(7):2391–2399. | ||
Lin T-H, Shao Y-Y, Chan S-Y, Huang C-Y, Hsu C-H, Cheng A-L. High serum transforming growth factor-β1 levels predict outcome in hepatocellular carcinoma patients treated with Sorafenib. Clin Cancer Res. 2015;21(16):3678–3684. | ||
Peng L, Yuan X-Q, Zhang C-Y, et al. High TGF-β1 expression predicts poor disease prognosis in hepatocellular carcinoma patients. Oncotarget. 2017;8(21):34387. | ||
Dituri F, Serio G, Filannino D, et al. Circulating TGF-β1-related biomarkers in patients with hepatocellular carcinoma and their association with HCC staging scores. Cancer Lett. 2014;353(2):264–271. | ||
Weber A, Boege Y, Reisinger F, Heikenwälder M. Chronic liver inflammation and hepatocellular carcinoma: persistence matters. Swiss Med Wkly. 2011;141(18):w13197. | ||
Liu N, Jiao T, Huang Y, Liu W, Li Z, Ye X. Hepatitis B virus regulates apoptosis and tumorigenesis through the microRNA-15a-Smad7-transforming growth factor beta pathway. J Virol. 2015;89(5):2739–2749. | ||
Serova M, Tijeras-Raballand A, Dos Santos C, et al. Effects of TGF-beta signalling inhibition with galunisertib (LY2157299) in hepatocellular carcinoma models and in ex vivo whole tumor tissue samples from patients. Oncotarget. 2015;6(25):21614. | ||
Zhang X, Fan Q, Li Y, et al. Transforming growth factor-beta1 suppresses hepatocellular carcinoma proliferation via activation of Hippo signaling. Oncotarget. 2017;8(18):29785. |
Supplementary materials
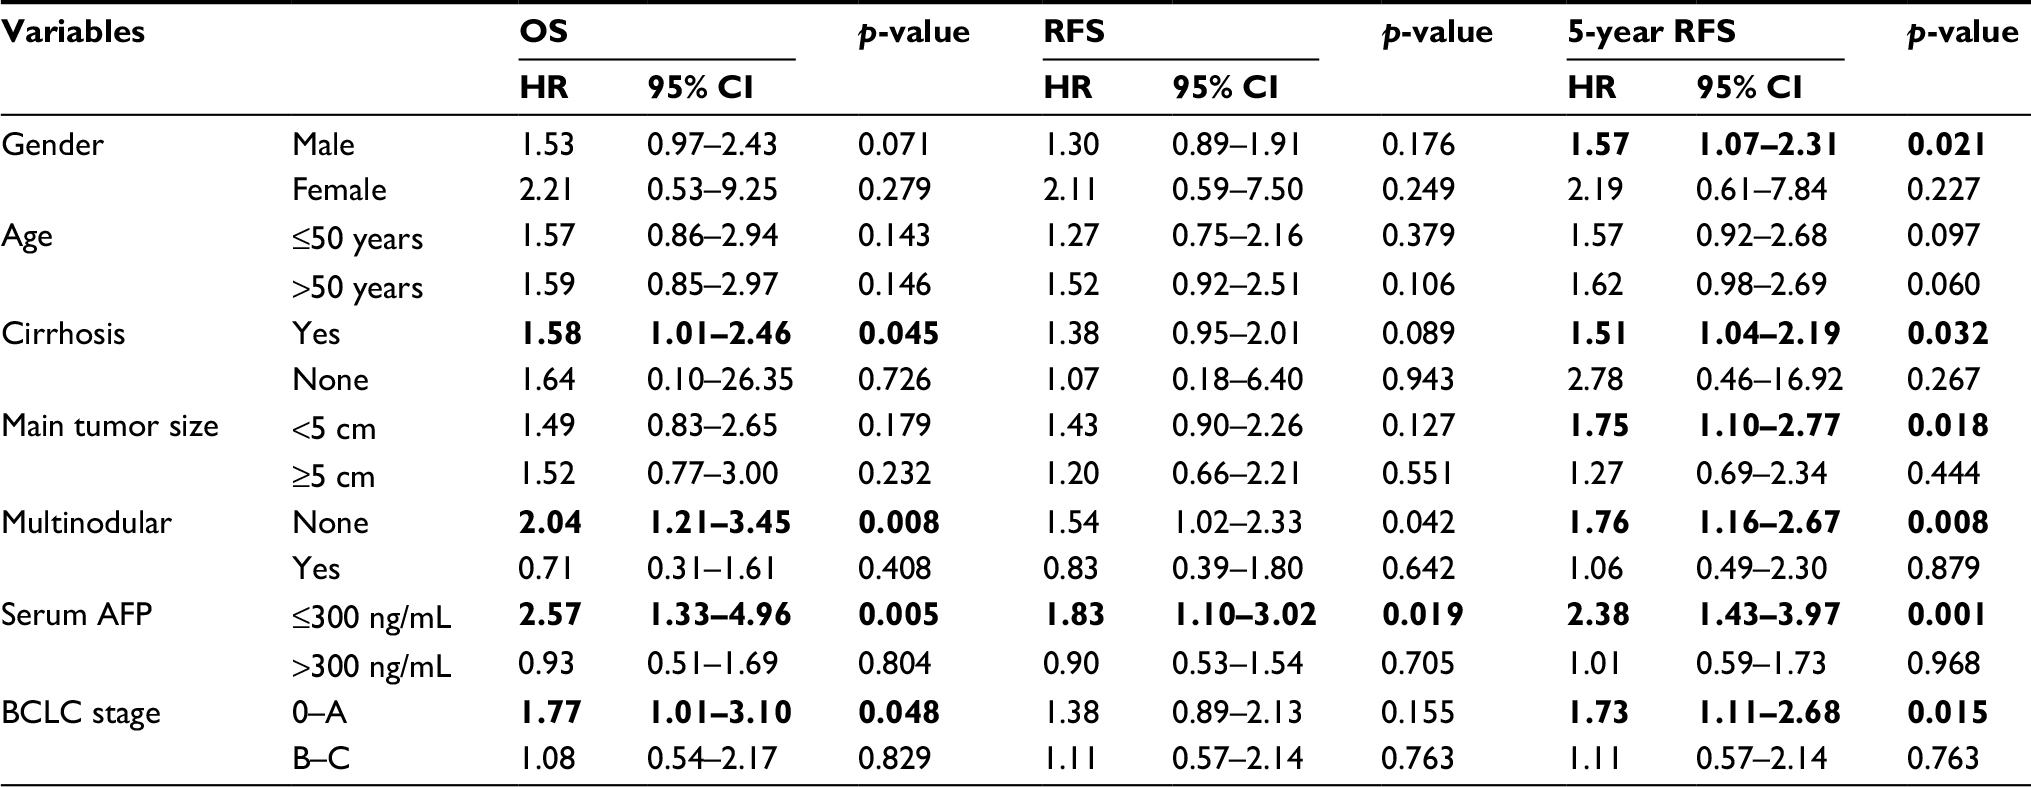 | Table S1 Stratified analysis on MKI67 expression level with outcomes in HBV-related HCC patients in Zhongshan cohort Notes: Bold items represent p<0.05. Abbreviations: AFP, alpha-fetoprotein; BCLC, Barcelona Clinic Liver Cancer; HBV, hepatitis B virus; HCC, hepatocellular carcinoma; HR, hazard ratio; OS, overall survival; RFS, recurrence-free survival. |
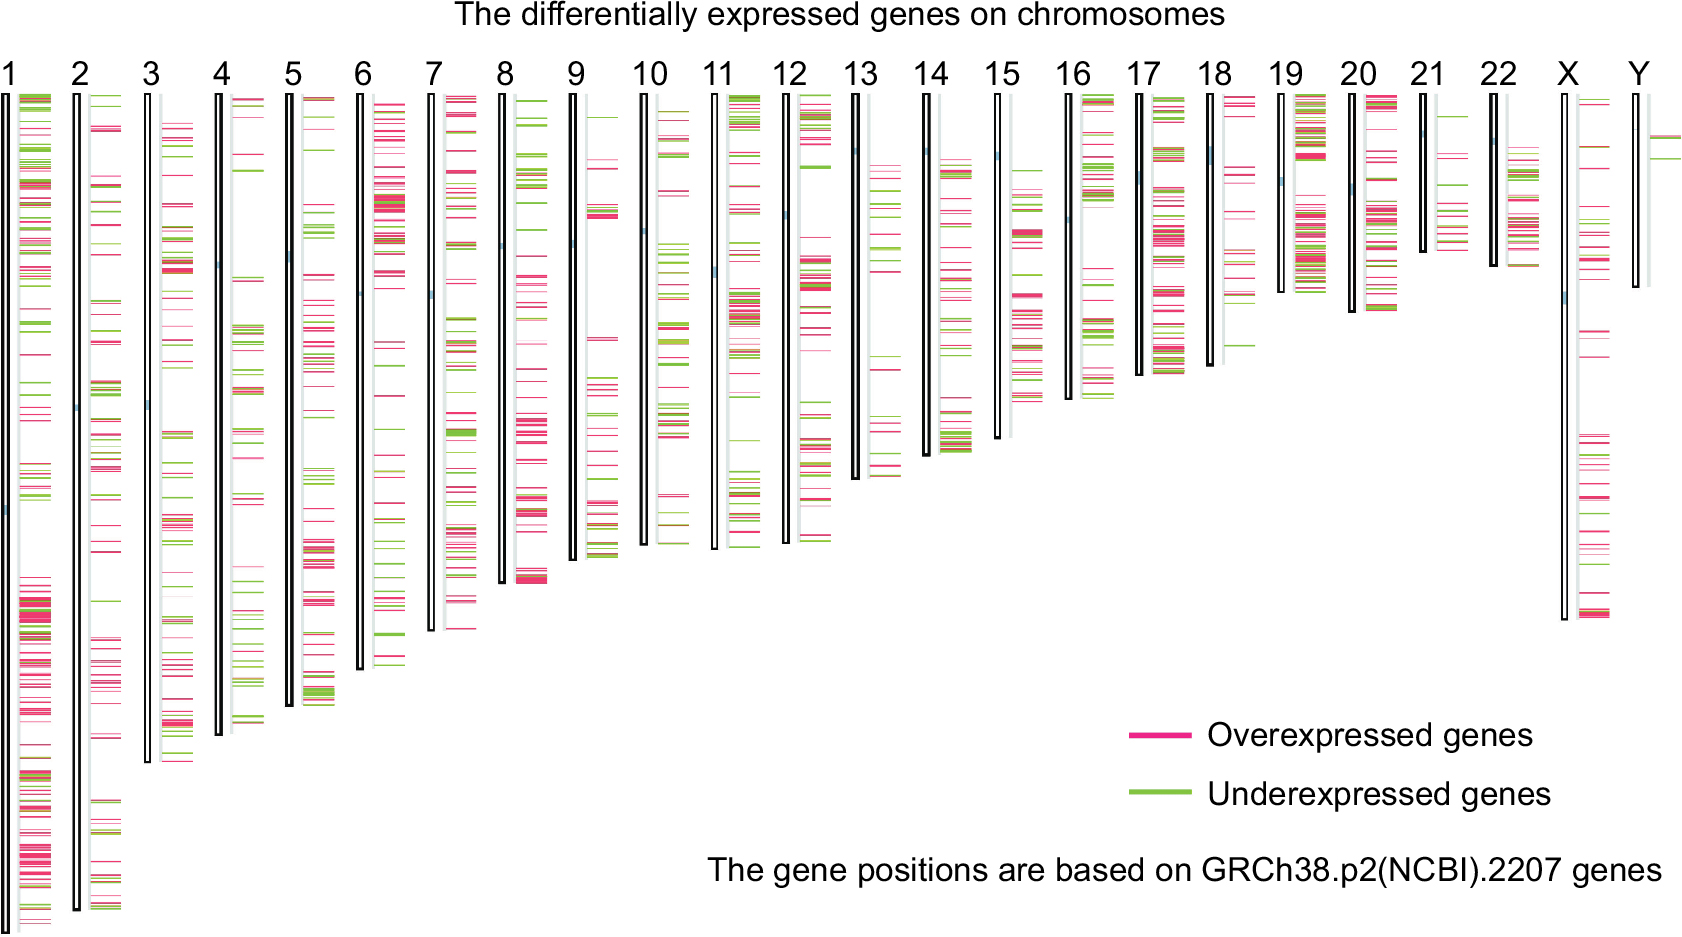 | Figure S1 Differentially expressed genes in the LIHC dataset distributed in chromosomes were analyzed by ANOVA. Abbreviations: ANOVA, analysis of variance; LIHC, liver hepatocellular carcinoma. |
 | Figure S2 The relation between MKI67 and TGFB1 mRNA expression with tumor stages and tissue types of LIHC patients. Notes: (A) The normal tissue was matched with TCGA normal and GTEx data. *represents p<0.05. (B, C) Comparison of the total difference of mRNA expression in different stages using one-way ANOVA. Abbreviations: GTEx, Genotype-tissue expression; LIHC, Liver hepatocellular carcinoma; TCGA, The Cancer Genome Atlas. |
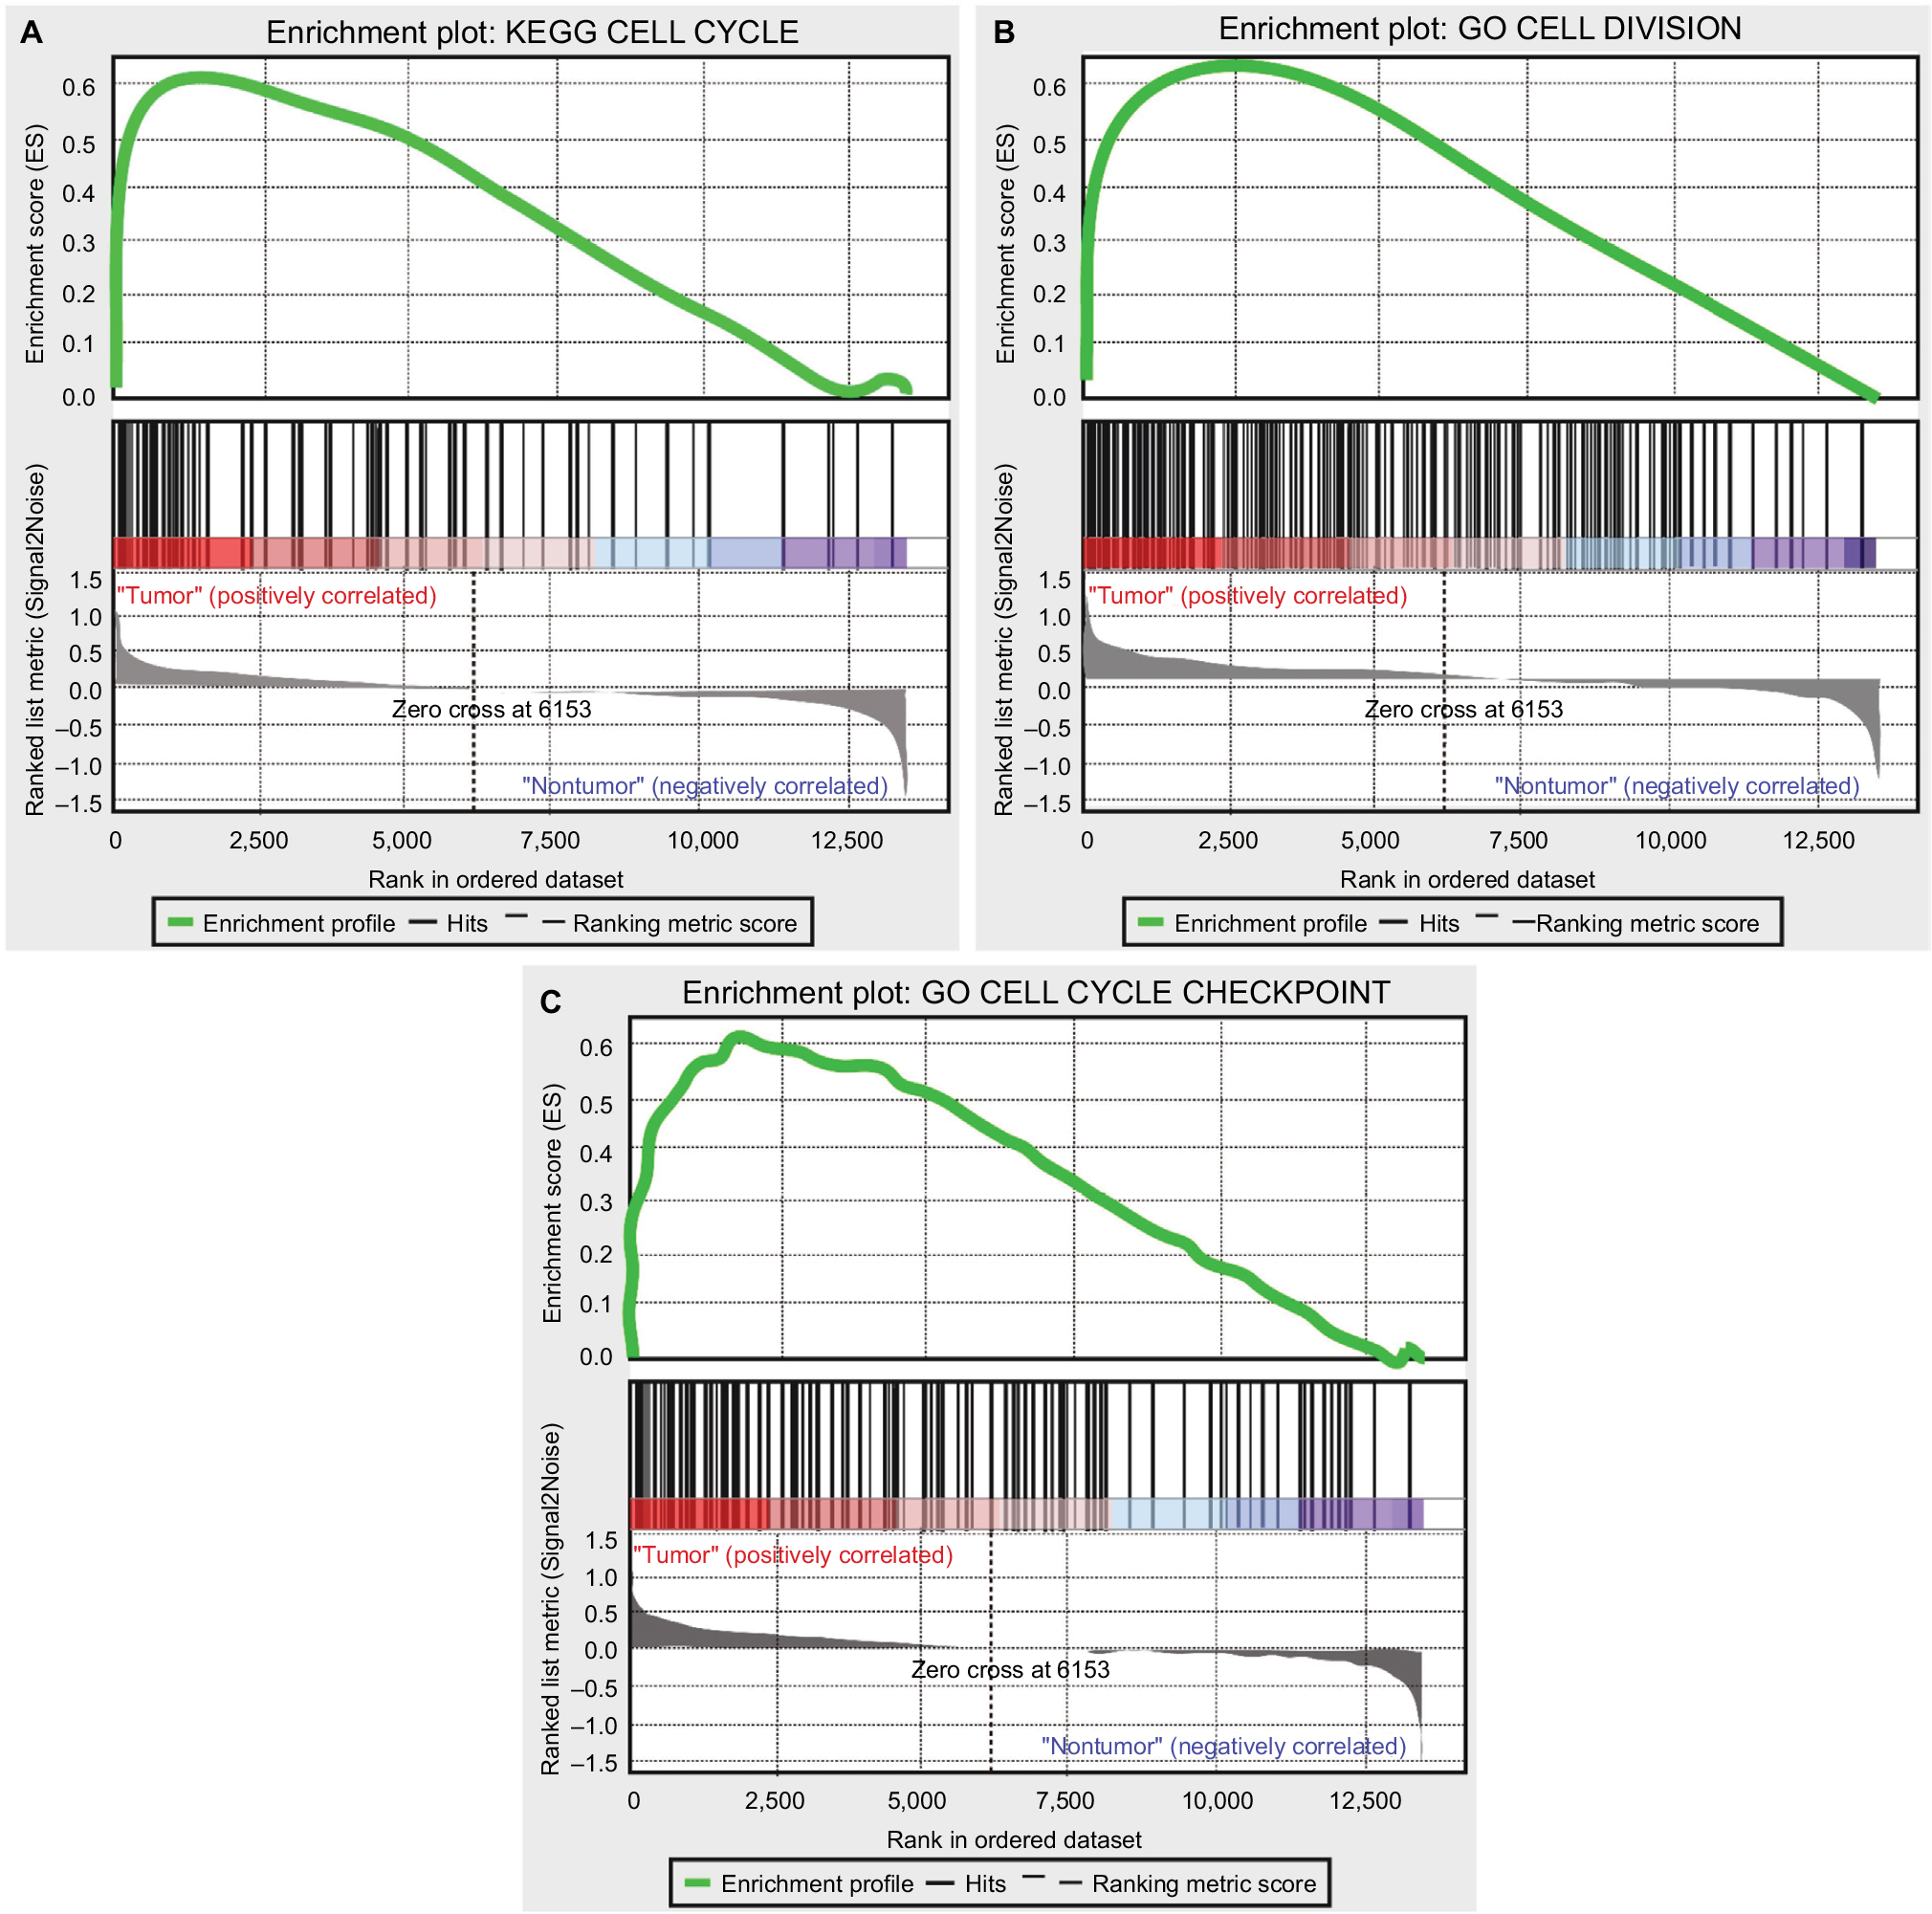 | Figure S3 The genomic expression profile of tumor and paired nontumor tissues analyzed using the GSEA tool for KEGG pathway and GO analysis. Notes: (A) The GSEA for cell cycle in KEGG pathway. (B, C) The GSEA for cell division and cell cycle checkpoint in GO terms. Abbreviations: GO, gene ontology; GSEA, Gene Set Enrichment Analysis; KEGG, Kyoto Encyclopedia of Genes and Genomes. |
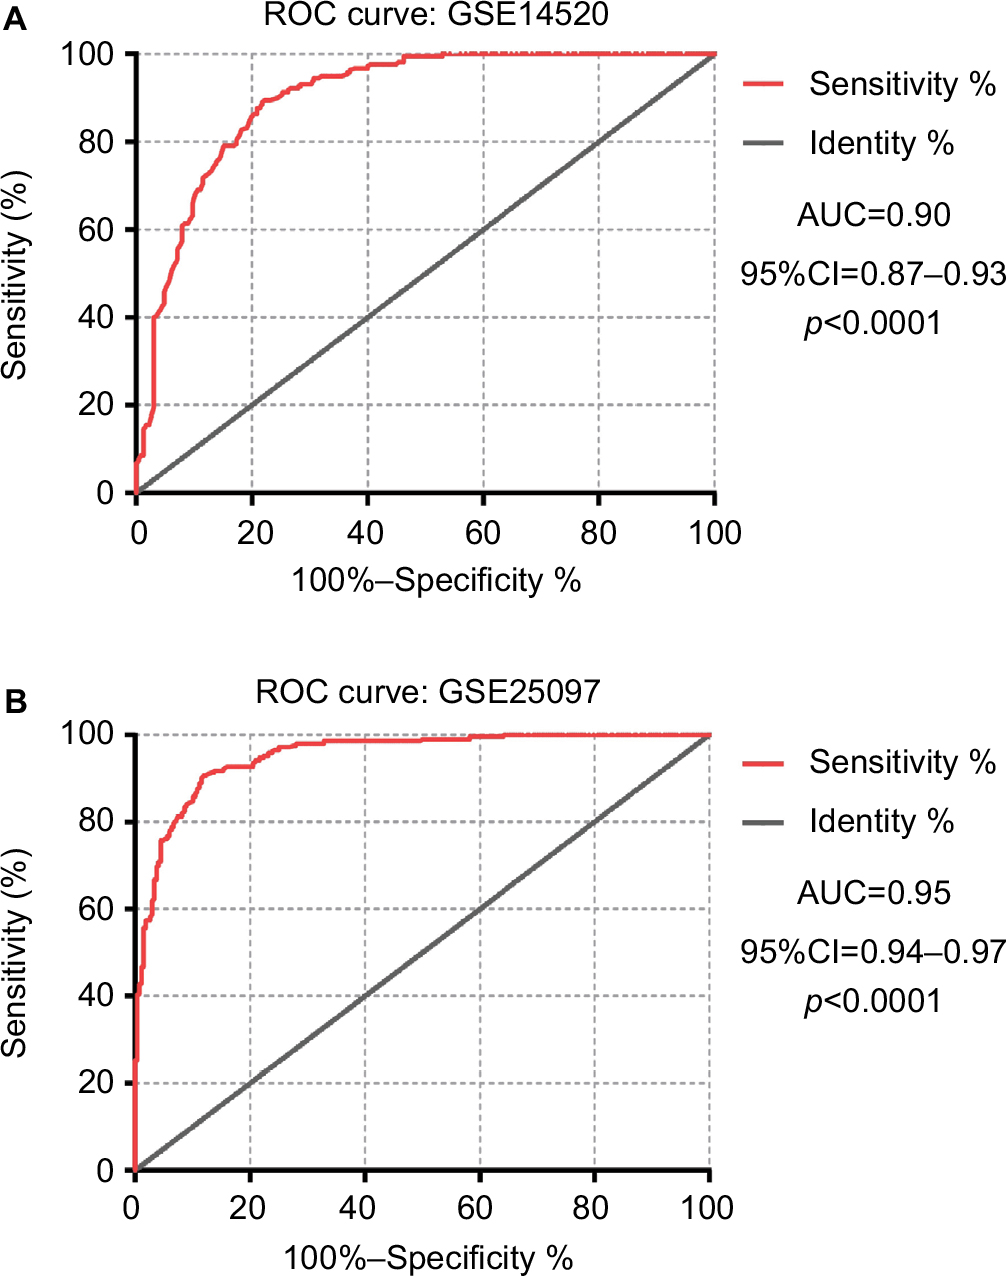 | Figure S4 ROC curve of MKI67 expression level to distinguish HCC from adjacent nontumor liver tissues. Notes: (A) ROC curve of MKI67 expression level in GSE14520. (B) ROC curve of MKI67 expression level in GSE25097. Abbreviations: AUC, area under curve; HCC, hepatocellular carcinoma; ROC, receiver operating characteristic. |
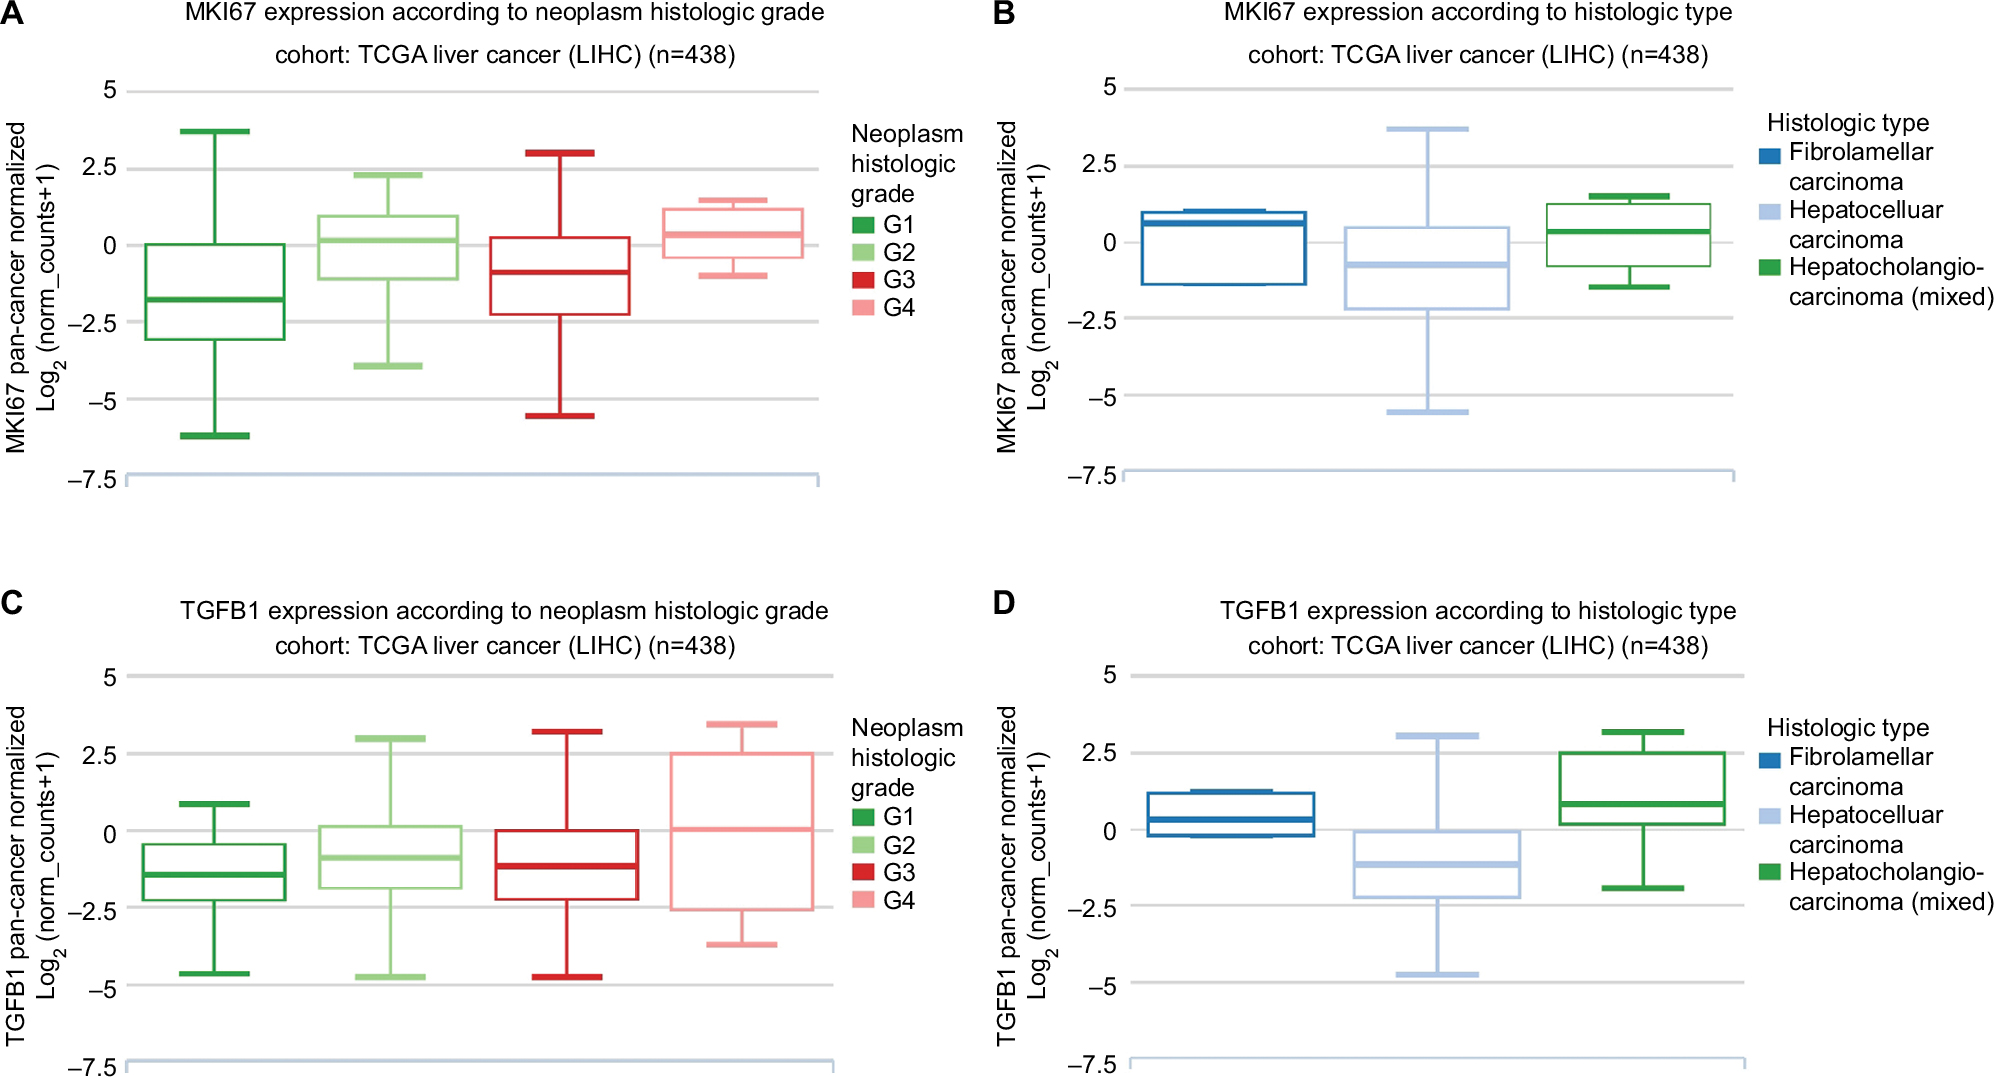 | Figure S5 The relationship between MKI67 and TGFB1 expression with neoplasm grade and type in a TCGA liver cancer dataset was analyzed with the Xena tool. Notes: (A, B) The relationship between MKI67 expression and neoplasm histologic grade and type in liver cancer. (C, D) The relationship between TGFB1 expression and neoplasm histologic grade and type in liver cancer. Abbreviations: LIHC, liver hepatocellular carcinoma; TCGA, The Cancer Genome Atlas. |
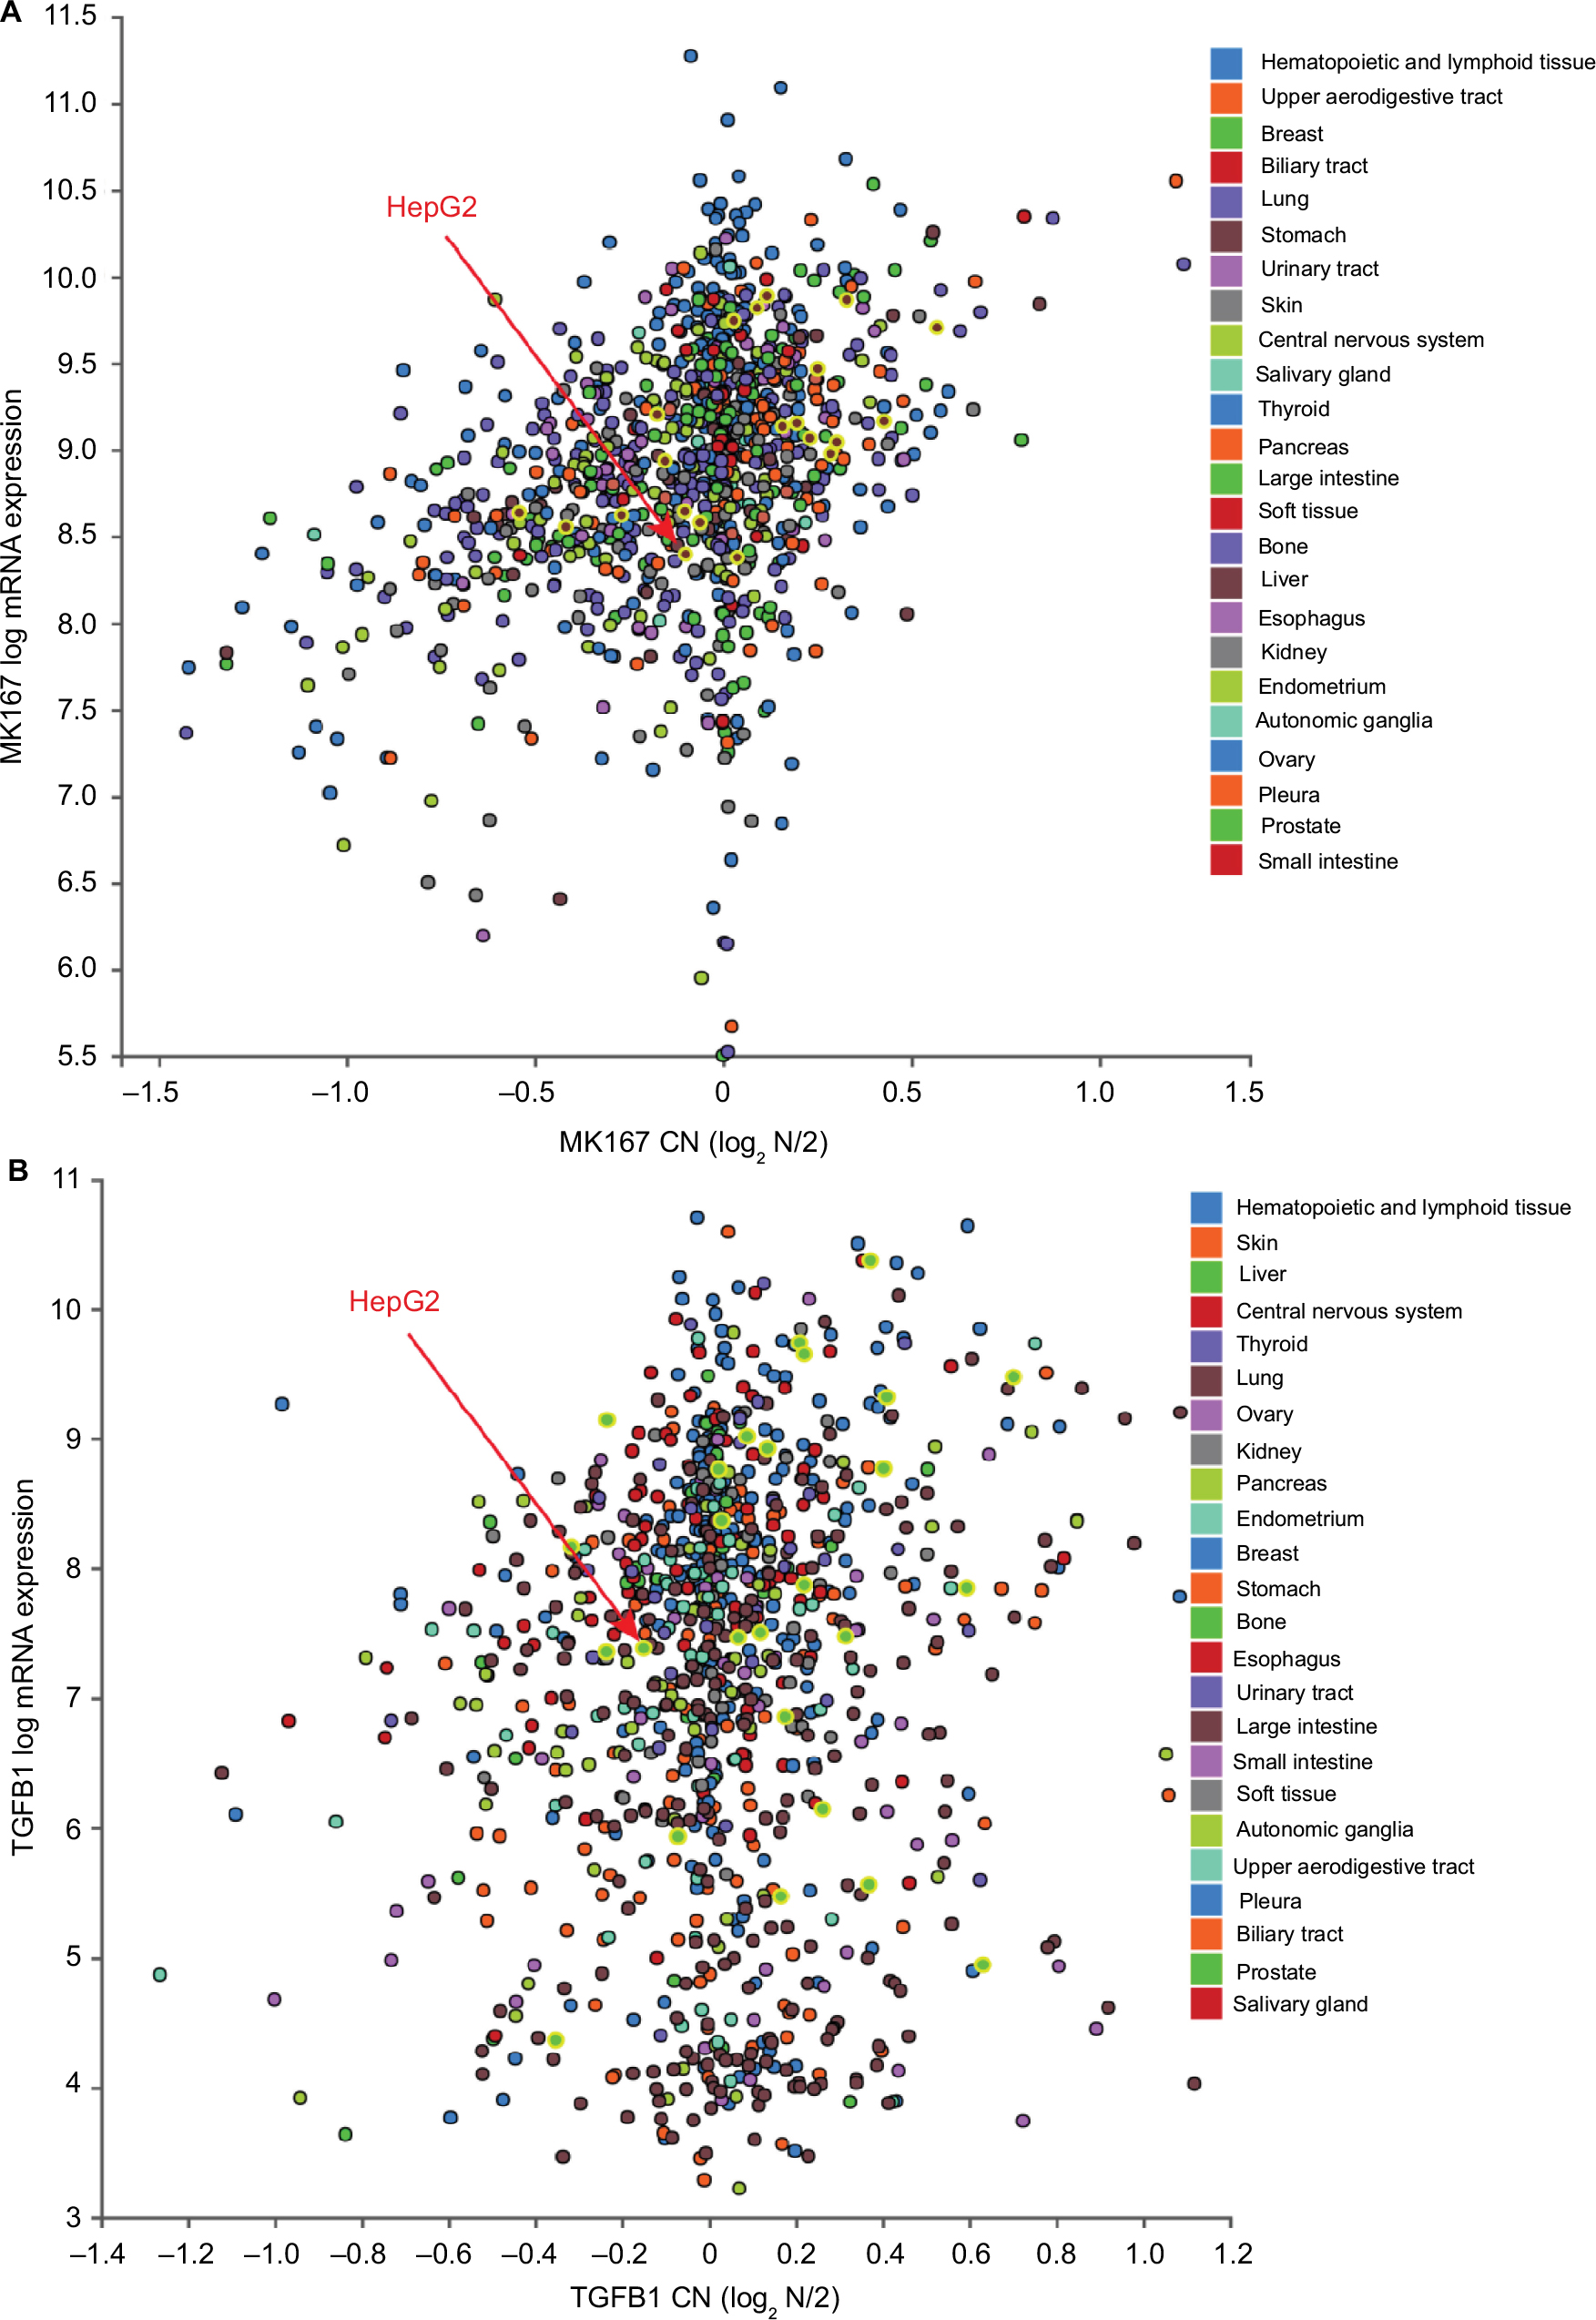 | Figure S6 The relationship between MKI67 and TGFB1 mRNA expression levels with DNA copy number in cancer cell lines was analyzed using the CCLE website. The highlighted dots in brown and green color are liver cancer cell lines. Notes: (A) The relationship between MKI67 mRNA expression level and DNA CN in cancer cell lines. (B) The relationship between TGFB1 mRNA expression level and DNA CN in cancer cell lines. Abbreviations: CCLE, Cancer Cell Line Encyclopedia; CN, copy number. |
 © 2018 The Author(s). This work is published and licensed by Dove Medical Press Limited. The
full terms of this license are available at https://www.dovepress.com/terms
and incorporate the Creative Commons Attribution
- Non Commercial (unported, 3.0) License.
By accessing the work you hereby accept the Terms. Non-commercial uses of the work are permitted
without any further permission from Dove Medical Press Limited, provided the work is properly
attributed. For permission for commercial use of this work, please see paragraphs 4.2 and 5 of our Terms.
© 2018 The Author(s). This work is published and licensed by Dove Medical Press Limited. The
full terms of this license are available at https://www.dovepress.com/terms
and incorporate the Creative Commons Attribution
- Non Commercial (unported, 3.0) License.
By accessing the work you hereby accept the Terms. Non-commercial uses of the work are permitted
without any further permission from Dove Medical Press Limited, provided the work is properly
attributed. For permission for commercial use of this work, please see paragraphs 4.2 and 5 of our Terms.