Back to Journals » International Journal of Nanomedicine » Volume 12
Mannose-coated gadolinium liposomes for improved magnetic resonance imaging in acute pancreatitis
Authors Tian B, Liu R, Chen S, Chen L, Liu F, Jia G, Dong Y, Li J, Chen H, Lu J
Received 27 September 2016
Accepted for publication 29 November 2016
Published 13 February 2017 Volume 2017:12 Pages 1127—1141
DOI https://doi.org/10.2147/IJN.S123290
Checked for plagiarism Yes
Review by Single anonymous peer review
Peer reviewer comments 2
Editor who approved publication: Professor Lei Yang
Bing Tian,1 Ri Liu,1 Shiyue Chen,1 Luguang Chen,1 Fang Liu,1 Guorong Jia,1 Yinmei Dong,1 Jing Li,1 Huaiwen Chen,2,3 Jianping Lu1
1Department of Radiology, 2Center of Clinical and Translational Medicine, Shanghai Changhai Hospital, The Second Military Medical University, 3Sunlipo Biotech Research Center for Nanomedicine, Shanghai, People’s Republic of China
Background: Acute pancreatitis (AP) is an acute inflammatory condition of the pancreas. The symptoms, treatment, and prognosis of mild and severe AP are different, and severe AP is a potentially life-threatening disease with a high incidence of complications and high mortality rate. Thus, it is urgent to develop an effective approach to reliably discriminate between mild and severe AP.
Methods: We have developed novel gadolinium-diethylenetriaminepentaacetic (Gd-DTPA)-loaded mannosylated liposomes (named thereafter M-Gd-NL) that preferably target macrophages in AP. The targeting ability of M-Gd-NL toward macrophages in AP and its ability to discriminate between mild and severe AP were evaluated.
Results: The liposomes were of desired particle size (~100 nm), Gd-DTPA encapsulation efficiency (~85%), and stability. M-Gd-NL and non-targeted Gd-DTPA-loaded liposomes (Gd-NL) exhibited increased relaxivity compared with Gd-DTPA. Compared with Gd-NL and Gd-DTPA, M-Gd-NL showed increased uptake in macrophages, resulting in increased T1 imaging ability both in vitro (macrophage cell line) and in vivo (severe AP model). Importantly, M-Gd-NL had the ability to discriminate between mild and severe AP, as reflected by a significantly higher T1 magnetic resonance imaging signal in severe AP than in mild AP. M-Gd-NL did not show severe organ toxicity in rats.
Conclusion: Our data suggest that M-Gd-NL had enhanced magnetic resonance imaging ability by targeting macrophages in AP and good ability to discriminate between mild and severe AP. We believe that M-Gd-NL could shed new light on the diagnosis of AP in the near future.
Keywords: acute pancreatitis, Gd-DTPA, liposomes, macrophages, mannose receptors
Introduction
Acute pancreatitis (AP) is a sudden inflammation of the pancreas with a highly variable clinical course. Severe AP is a potentially life-threatening disease associated with the systemic inflammatory response syndrome and multiple organ dysfunction syndrome (MODS).1–3 However, there is no satisfactory early diagnostic approaches of AP.4,5 Therefore, it is urgent to develop an effective strategy to reliably discriminate between mild and severe AP.
Macrophages are critical immune cells that are recruited to the sites of inflammation.6,7 In AP, macrophages are activated by mediators that are released from the damaged pancreas.8,9 Akbarshahi et al reported that AP was associated with a significant increase in macrophage recruitment into the pancreas, as macrophage infiltration was significantly increased in AP in a time-dependent manner compared with healthy counterparts.10
A macrophage is, by definition, a cell that uptakes microorganisms constantly crossing tissue barriers. Macrophages can also perform phagocytosis on all types of injected particles, such as nanoparticles, by opsonization or protein-binding of surface molecules.11 This phagocytic property can be utilized to target macrophages using nanoparticles.12 Nanoparticles that are used as imaging agents, such as superparamagnetic iron oxide particles (SPIO) or ultra SPIO, take advantage of the fact that they are predominantly internalized by macrophages and induce a change in the signal intensity of magnetic resonance imaging (MRI).13,14 These imaging agents have been widely used in many macrophage-associated diseases, such as myocardial inflammation, atherosclerosis, and liver tumors.15–17
Macrophages can be targeted through mannosylated nanoparticles, as macrophages constitutively express high levels of the mannose receptor, which is a C-type lectin whose ligands possess a terminal nonreducing sugar, such as mannose, glucose, and fucose.18,19 A series of mannosylated liposomes have shown increased targeting to macrophages compared with nontargeted liposomes.20 For example, Ikehara et al reported that antigen-loaded liposomes consisting of oligomannose and dipalmitoylphosphatidylethanolamine (Man-DPPE) induced a significantly enhanced antigen-specific T helper-type immune response in mice compared with liposomes without Man-DPPE.21
The right imaging approach is critical in early diagnosis of AP. Due to the composition of soft tissue, MRI can produce morphologic images with a very high resolution in AP.22–24 The imaging agent we aim to use is gadolinium-diethylenetriaminepentaacetic (Gd-DTPA), a beneficial positive contrast agent with a long history of use in MRI examination of AP.25,26
Liposomes are promising nanomedicines for targeted drug delivery and imaging. Recently, liposomes have emerged as effective nanocarriers of imaging agents, as they increase the circulation time of loaded drugs and the relaxivity of imaging agents, and are of easy preparation and large-scale production.27,28
Based on these findings, we hypothesized that mannosylated liposomes could be used in early detection of AP by targeting macrophages and improving MRI. After incorporation of mannosylated lipids into Gd-DTPA-loaded liposomes, these liposomes (named thereafter M-Gd-NL) could preferably target macrophages in AP, resulting in early detection of AP by improving MRI and discriminating between mild and severe AP.
Materials and methods
Materials
1,2-Distearoyl-sn-glycero-3-phosphoethanolamine-N-[methoxy(polyethylene glycol)-2000] (ammonium salt) (DSPE-PEG2000), 1,2-distearoyl-sn-glycero-3-phosphoethanolamine-N-[amino(polyethylene glycol)-2000] (ammonium salt) (DSPE-PEG2000-NH2), 1,2-dipalmitoyl-sn-glycero-3-phosphoethanolamine-N-diethylenetriaminepentaacetic acid (gadolinium salt) (DPPE-DTPA(Gd)), DPPE, 1,2-dipalmitoyl-sn-glycero-3-phosphoethanolamine-N-(lissamine rhodamine B sulfonyl) (ammonium salt), and cholesterol were obtained from Avanti Polar Lipids (Alabaster, AL, USA). 1,1′-Dioctadecyl-3,3,3′,3′-tetramethylindotricarbocyanine iodide (DiR), a lipophilic, near-infrared fluorescent cyanine dye, was purchased from Biotium (CA, USA). Mannose was bought from Dextra Laboratories (Reading, UK). Gd-DTPA was obtained from Sigma-Aldrich (St Louis, MO, USA). Dulbecco’s Modified Eagle’s Medium (DMEM) and fetal bovine serum (FBS) were bought from Invitrogen (Carlsbad, CA, USA). All other organic reagents were of analytical grade and purchased from Sinopharm (Shanghai, People’s Republic of China).
Cell culture
The macrophage cell line RAW 264.7 and the pancreatic cell line HPC-Y5 were purchased from American Type Culture Collection (ATCC, VA, USA). The cells were maintained in DMEM supplemented with 10% FBS, 25 mM hydroxyethyl piperazine ethanesulfonic acid buffer, 100 U/mL penicillin, and 100 μg/mL streptomycin in a humidified atmosphere of 5% CO2 at 37°C.
Synthesis of DSPE-PEG2000-Man and liposomes
DSPE-PEG2000-Man was synthesized by covalent binding of DSPE-PEG2000-NH2 and 2-imino-2-methoxyethyl-1-thiomannoside (IME-thiomannoside) with a simple one-step reaction.29 IME-thiomannoside was synthesized according to the method described by Lee et al.30 Next, DSPE-PEG2000-NH2 (40 μmol) and IME-thiomannoside (200 μmol) were added to 1 mL of deionized water, and the reaction was stopped with 100 μL of 1 M acetic acid and applied to a column of Sephadex G-25 to isolate the product DSPE-PEG2000-Man. M-Gd-NL were prepared by a lipid film-based method. Briefly, DPPE-DTPA(Gd), cholesterol, and DSPE-PEG2000-Man were dissolved in 5 mL of a chloroform–methanol solution (2:1, v/v) at a molar ratio of 4:4:1 (total lipid concentration: 15 mM) and dried in a rotary evaporator under vacuum to form a thin film layer, which was hydrated in 5 mL of phosphate-buffered saline (PBS, pH 7.4) until completely hydrated. The multilamellar vesicles were extruded through 400, 200, and 100 nm pore polycarbonate membrane (Whatman Nucleopore) using a hand-held extruder (Avestin, Ottawa, Canada), with 10–20 cycles per pore size. Gd-DTPA-loaded liposomes (Gd-NL) were prepared similar to M-Gd-NL with the exception that DSPE-PEG2000 was added to the chloroform–methanol solution instead of DSPE-PEG2000-Man. For the preparation of fluorescent liposomes, DiR was incorporated into the liposomes, and rhodamine B-labeled liposomes were obtained by adding 1% molar ratio of 1,2-dipalmitoyl-sn-glycero-3-phosphoethanolamine-N-(lissamine rhodamine B sulfonyl) to the lipid film. Rhodamine B-labeled liposomes were only used in imaging flow cytometry. The following designations are used: mannosylated Gd-DTPA-loaded liposomes (M-Gd-NL), Gd-DTPA-loaded liposomes (Gd-NL), mannosylated DiR-loaded liposomes (M-DiR-NL), and DiR-loaded liposomes (DiR-NL).
Size, zeta potential, morphology, drug loading, and stability assay
After the liposomes were dispersed in deionized water, their particle size, and zeta potential were analyzed using a Zetasizer Nano S (Malvern Instruments, UK). Liposome morphology was examined by transmission electron microscopy (TEM). Briefly, samples were prepared by dropping one drop of liposome dispersion onto a copper grid coated with a carbon membrane. The samples were dried and visualized under Hitachi H-600 TEM (accelerating voltage of 200 kV). Gd-DTPA concentration in liposomes was determined by inductively coupled plasma mass spectrometry (ICP-MS) (4500 ICP-MS, Hewlett-Packard, DE, USA).
In vitro stability of the liposomes was monitored over a time period of 120 h. Briefly, the liposomes were incubated with PBS or 10% (v/v) FBS in PBS at 37°C over 120 h. An aliquot of liposome solutions was collected to measure the particle size on a Zetasizer Nano S.
Relaxation rate
The nuclear magnetic resonance (NMR) relaxation rate of liposomes was measured with a NMR spectrometer (Minispec, mq60, Bruker, Germany) as previously described.31 Briefly, a series of Gd concentrations of liposomes resuspended in distilled water were added to test tubes, and T1 relaxation times were measured using a standard turbo spin echo (TSE) sequence. Each measurement was performed in triplicate, and the average T1 time was recorded. T1 relaxivity, r1, was obtained from Equation (1):
|
|
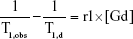
where T1,obs is defined as the solvent T1 relaxation time with the contrast agent, and T1,d is the water T1 relaxation time without the contrast agent.31
In vitro experiments
Uptake of liposomes evaluated by imaging flow cytometry
The uptake of liposomes was evaluated by imaging flow cytometry. Briefly, two cell lines (RAW 264.7 and HPC-Y5) were incubated in 48-well culture plates at a density of 5×10⁵ cells per well overnight. Rhodamine B-labeled liposomes (50 μg/mL) were incubated with the cells for 2 h at 37°C. After incubation, the cells were trypsinized, washed, and stained with 4,6-diamidino-2-phenylindole dihydrochloride (Sigma-Aldrich) and analyzed on an Amnis ImageStreamX Mark II imaging flow cytometer.
In vitro MRI
For in vitro MRI, two cell lines (RAW 264.7 and HPC-Y5) were seeded in 6-well tissue culture plates at a density of 2×10⁵ cells per well and incubated overnight at 37°C. The cells were then treated with M-Gd-NL, Gd-NL, or Gd-DTPA for 4 h at 37°C, with an equivalent Gd-DTPA concentration (1 mM). In the competitive assay (M-Gd-NL combined with mannose), the cells were pretreated with mannose (1 mg/mL) for 1 h, followed by M-Gd-NL treatment. After washing with PBS twice, the cells were fixed with 4% paraformaldehyde (PFA) and washed with PBST. The cells were pelleted by centrifugation and separated on a 1% agarose gel. Contrast-enhanced MRI of the cells was obtained using a 4.7T Mouse GE Small Animal MR Imaging System (Signa HDxt, GE Healthcare, USA) using TSE sequence (TR =800 ms, TE =9.9 ms, FOV =102×120 mm2, matrix =216×256, slice thickness =2 mm, echo train length =3, number of average =2).
Rat AP model and experimental protocol
Healthy adult Sprague Dawley (SD) rats (males, 250–300 g) (Second Military Medical University, Shanghai, People’s Republic of China) were maintained under a specific pathogen-free environment with a 12-h light cycle with free access to standard laboratory diet and water. The rats were randomly assigned to five groups, and each group consisted of six rats having fasted overnight before each experiment. For the establishment of AP model, all animals were anesthetized with an intraperitoneal (IP) injection of chloral hydrate (3.5 mg/100 g of body weight). The experimental AP models were induced by three IP injections of L-arginine (300 mg/100 g of body weight) as a 20% solution in 0.9% physiological saline, at an interval of 1 h, as previously described.32 After the third injection, the animals were given food and water again. The control rats received an equal volume of 0.9% physiological saline (control group). All rats were sacrificed at 6, 12, 24, or 48 h after the third L-arginine or physiological saline injection. Meanwhile, pancreases were rapidly dissected and washed with 0.9% physiological saline and fixed by immersion in 4% PFA. All experiments were approved by the University Committee on Use and Care of Animals at the Second Military Medical University (Shanghai, People’s Republic of China) and performed according to the established policies and guidelines. Hematoxylin–eosin (HE) staining was performed to observe whether the experimental AP model was established. Furthermore, immunohistochemistry was performed to observe the macrophage infiltration in the pancreas by CD68 staining. The macrophages in the pancreas were detected with a mouse anti-rabbit CD68 antibody (Abcam) as the primary antibody and goat anti-mouse IgG antibody (horseradish peroxidase-labeled) as the secondary antibody.
In vivo toxicity assessment
Healthy adult SD rats were randomly assigned to four groups, and each group consisted of five rats that had fasted overnight before the start of the experiments. The four groups were M-Gd-NL, Gd-NL, Gd-DTPA, and PBS. All drugs were injected three times via the tail veins once every other day (0.1 mmol/kg Gd-DTPA). Rats were euthanized 24 h after the third injection. The organs of the rats were excised, and HE staining was performed on the organs to examine the toxicity of the imaging reagents.
In vivo pancreas distribution of DiR-loaded M-Gd-NL
The mild or severe experimental AP models in SD rats were established as described in “Rat AP model and experimental protocol” section. Mild AP was induced 6 h after three IP injections of L-arginine, whereas severe AP was induced 24 h after the L-arginine injections. Rats that developed AP were injected with M-DiR-NL via the tail vein as a single dose (500 μg DiR/kg). The rats were anesthetized by inhalation. Four hours after injection, the rats were euthanized, and the excised pancreases were imaged with IVIS® Lumina II Imaging System (Xenogen) and recorded by a built-in CCD camera.
In vivo MRI of severe AP model
After anesthetizing by inhalation, the rats that developed severe AP were injected with M-Gd-NL, Gd-NL, or Gd-DTPA via the tail veins (0.1 mmol/kg Gd-DTPA, 5 rats per group). MRI was obtained at a 3.0-T unit (Magnetom Verio, Siemens Healthcare, Erlangen, Germany) using a 32-channel wrist coil. The scanning sites before and after injection of the contrast agent were kept as consistent as possible. T1 images of the severe AP model were obtained at four time points (before treatment: pre-contrast; 5 min after injection: post 5 min; 60 min after injection: post 60 min; 120 min after injection: post 120 min) by TSE sequence (TR =460 ms, TE =12 ms, FOV =68×80 mm2, matrix =216×256, slice thickness =2 mm, ETL =3, number of averages =6). The regions of interests (ROIs) manually drawn in the pancreas were used to determine the signal intensity in the pancreas after injection of the contrast agent. For quantitative analysis, the T1-weighted (T1WI) signal-to-noise ratio (SNR) of the ROIs was used to determine the signal intensity of severe AP after injection of each contrast agent.
Application of M-Gd-NL in discriminating between mild and severe AP
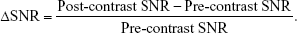
Mild AP was induced 6 h after three IP injections of L-arginine, whereas severe AP was induced 24 h after L-arginine injections. After anesthetizing by inhalation, the rats that developed AP were injected with M-Gd-NL via the tail veins (0.1 mmol/kg Gd-DTPA, 5 rats per group). The rats were imaged five times by MRI (before treatment: pre-contrast; 5 min after injection: post 5 min; 60 min after injection: post 60 min; 120 min after injection: post 120 min; 180 min after injection: post 180 min). T1WI MRI scans (in the same plane) of the rat pancreases in each group were performed using the 3.0-T Siemens Healthcare MRI system by wrist coil. The scanning sites before and after injection of contrast agent were kept as consistent as possible. The T1WI images of rat model in each group were obtained as described in “In vivo MRI of severe AP model” section. ROIs were manually drawn in the pancreas, and ΔSNR of the ROIs was presented as the change of SNR from baseline using the following equation:
|
|
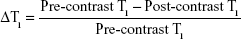
To determine whether T1 relaxation times of ROIs can predict the status of pancreas, the corresponding map images were obtained by quantitative T1 mapping based on a respiratory-gated variable flip angle technique (3D-FLASH, TR =6.83 ms, TE =2.26 ms, FOV =110×130 mm2, matrix =216×256, FA1=3°, FA2=17°, slice thickness =2 mm, number of averages =6). T1 maps were created with custom Matlab scripts (The Mathworks, Natick, MA, USA). The data were presented as the change in T1 from baseline (ΔT1) caused by the presence of the contrast agent M-Gd-NL within the ROIs as outlined in Equation (3):33
|
|
Statistical analysis
Data were analyzed by using the statistic package Statistical Package for the Social Sciences (SPSS) 13.0 (SPSS Inc., Chicago, IL, USA). For values that were normally distributed, a direct comparison between two groups was conducted by Student’s non-paired t-test, and one-way analysis of variance with the Dunnett’s or Newman–Keuls posttests was used to compare the means of three or more groups. P-value <0.05 was considered statistically significant (*P<0.05; **P<0.01; ***P<0.001; n.s., not significant [P≥0.05]).
Results
Characterization of liposomes
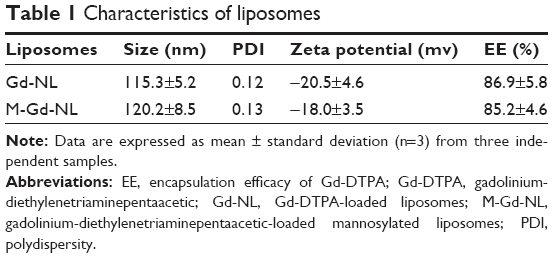
M-Gd-NL and Gd-NL were prepared by the lipid film-based method as described in Figure 1. The characteristics of the liposomes are summarized in Table 1. M-Gd-NL size was 120.2 nm, whereas Gd-NL size of was 115.3 nm, suggesting that mannosylation of liposomes slightly increased the size of liposomes. Size distribution of the liposomes was narrow, as reflected by the small polydispersity index of the liposomes (<0.15). The liposomes showed negative zeta potential, which may be attributed to the liposome stability. The Gd-DTPA encapsulation efficacy of M-Gd-NL and Gd-NL was 86.9% and 85.2%, respectively, suggesting that Gd-DTPA incorporation into liposomes was very efficient.
 | Table 1 Characteristics of liposomes |
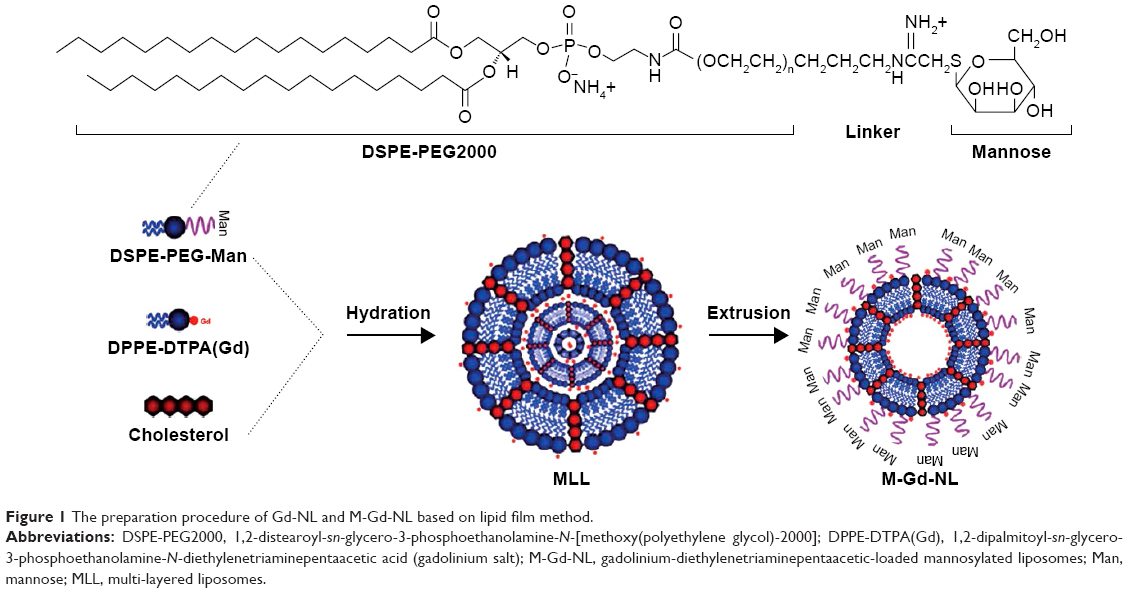 | Figure 1 The preparation procedure of Gd-NL and M-Gd-NL based on lipid film method. |
TEM revealed that the liposomes were spherical in shape, with a size of ~100 nm and good dispersion (Figure S1A). A stability assay was performed in which liposomes were incubated in PBS or 10% FBS in PBS for 120 h at 37°C. The size of liposomes remained similar in PBS, whereas in FBS the size was increased by ~10 nm, suggesting that the liposomes had good stability (Figure S1B). As for determination of the magnetic property, a concentration-dependent increase in the relaxation rate of water protons by M-Gd-NL and Gd-NL was observed within the range of clinically relevant concentrations (Figure S1C). The r1 relaxivity of M-Gd-NL and Gd-NL was 8.36 and 8.91 mM−1 s−1, respectively, which is 1.8- and 1.9-fold higher than that of the clinically approved positive contrast agent Gd-DTPA (4.56 mM−1 s−1). Such an increase in r1 of Gd-loaded liposomes was a consequence of the embedding of DPPE-DTPA (Gd) into the bilayer of liposomes, which slowed down the tumbling motion of Gd complexes and achieved high relaxivity.27,28,34 The corresponding T1 mapping image is shown in Figure S2A.
Uptake of liposomes analyzed by imaging flow cytometry
The results of imaging flow cytometry analysis demonstrated that M-Gd-NL bound to RAW264.7 cells more efficiently than M-Gd-NL, as seen in Figure 2A. M-Gd-NL uptake (represented by red filled histogram) into RAW264.7 cells was higher than that of Gd-NL. In contrast, M-Gd-NL and Gd-NL binding to HPC-Y5 did not differ significantly (Figure 2A). To visualize the uptake on a single cell level, imaging flow cytometry was used to microscopically evaluate the localization of engulfed liposomes (Figure 2B). The results demonstrate that RAW264.7 cells incubated with M-Gd-NL produced a significantly stronger red fluorescence compared with Gd-NL, whereas in HPC-Y5 cells both liposomes produced a faint red fluorescence. Subsequently, expression of the mannose receptor on the cell surface was measured by real-time polymerase chain reaction (PCR) and was significantly increased on RAW 264.7 cells compared with HPC-Y5 cells (Figure S3). Taken together, we conclude that M-Gd-NL may increase its uptake into RAW 264.7 cells through interaction of its mannose with the mannose receptor on RAW 264.7 cells.
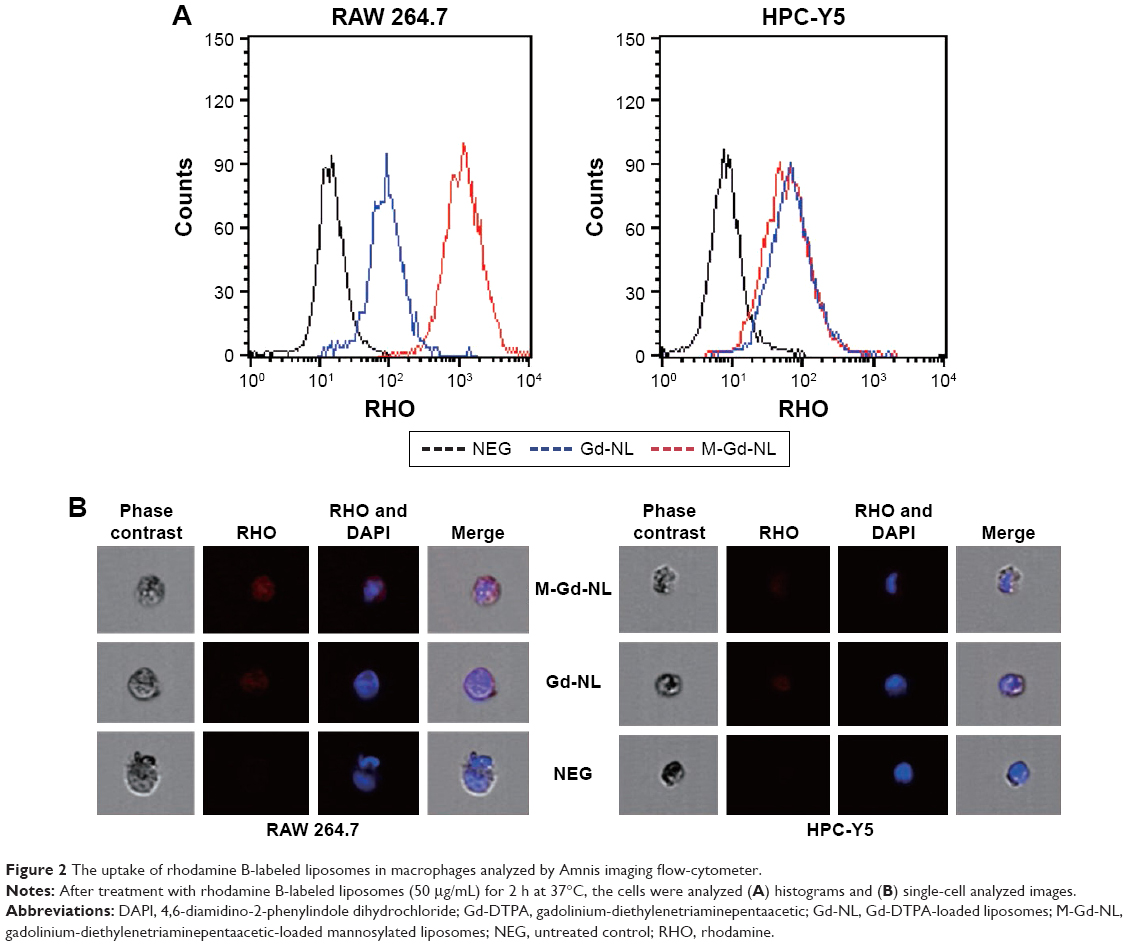 | Figure 2 The uptake of rhodamine B-labeled liposomes in macrophages analyzed by Amnis imaging flow-cytometer. |
In vitro MRI
The representative T1WI images of cellular pellets in agarose are shown in Figure 3. In the right panel, the signal intensity of HPC-Y5 cells treated with the liposomes was higher than with Gd-DTPA, suggesting that liposomes facilitated Gd-DTPA delivery into HPC-Y5 cells. However, the signal intensities of M-Gd-NL, Gd-NL, and M-Gd-NL combined with mannose in HPC-Y5 cells did not differ significantly, which may be due to the lack of expression of the mannose receptor by HPC-Y5 cells. In contrast, in RAW 264.7 cells, the signal intensity of M-Gd-NL was significantly increased as compared with Gd-NL. However, the signal intensity of M-Gd-NL was significantly decreased after pretreatment with mannose, as reflected by the competitive assay (M-Gd-NL combined with mannose), showing that M-Gd-NL increase its uptake into RAW 264.7 cells through interaction of its mannose with the mannose receptor on RAW 264.7 cells. The corresponding T1 mapping image is shown in Figure S2B.
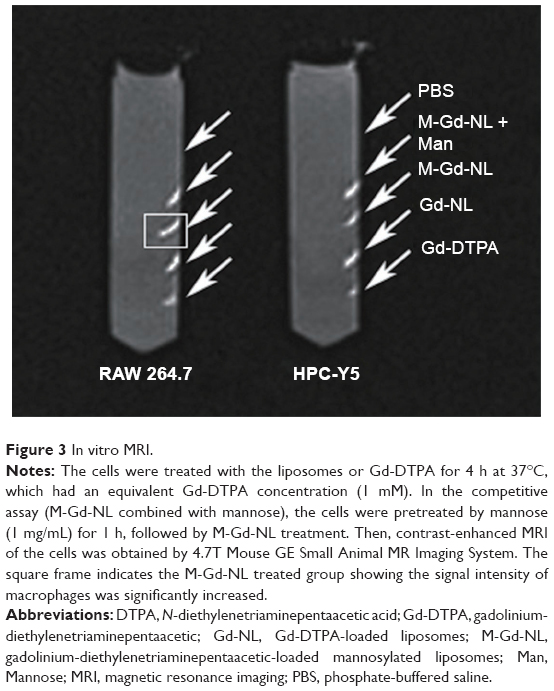 | Figure 3 In vitro MRI. |
In vivo MRI of AP models in SD rats
After the severe AP model was established in SD rats, they were injected with M-Gd-NL, Gd-NL, or Gd-DTPA via their tail veins. Transverse T1WI of post-contrast or pre-contrast pancreas showed a signal intensity of ROIs (Figure 4A). The quantitative change of SNR in ROIs of the pancreas on T1WI is shown in Figure 4B. These results showed that, for Gd-DTPA, SNR reached the peak value of 53.5 at a very short time (5 min) and decreased rapidly to 28.2 as Gd-DTPA was eliminated in vivo during the 120-min period. In contrast, for M-Gd-NL and Gd-NL, SNR gradually increased from ~20 up to ~40 in the 120-min period. Notably, the SNR value of M-Gd-NL reached 54.8, which is significantly higher than that of Gd-NL and Gd-DTPA at the 120-min time point (P<0.01), suggesting that mannose conjugation and liposome accumulation in severe AP tissue may be attributed to the imaging of M-Gd-NL.
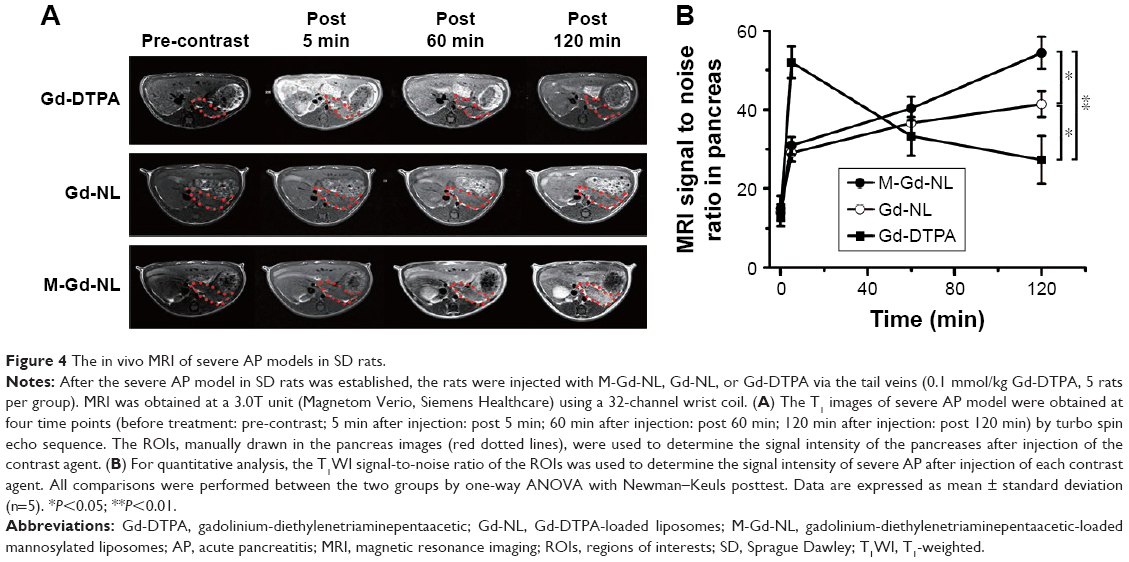 | Figure 4 The in vivo MRI of severe AP models in SD rats. |
Application of M-Gd-NL to predicting mild and severe AP
After the mild or severe AP models were established in SD rats, M-Gd-NL was applied to demonstrate whether it could be used to predict mild and severe AP. The transverse T1WI (above) and corresponding T1 mapping image (below) of each pancreas models are shown in Figure 5A. Quantitative SNR and T1 value of the ROIs are shown in Figure 5B and D. The SNR value of M-Gd-NL in control healthy rats slightly increased to 30.7 at 60-min post-contrast and gradually decreased to 22.3 after 2 h, whereas SNR of M-Gd-NL was significantly higher in mild or severe AP model than in control healthy rats. Notably, in the severe AP model, the increase in SNR was the most significant during the post-contrast time. The T1 mapping relaxation time decreased as Gd-DTPA uptake occurred in the pancreas. As shown in Figure 5D, the T1 mapping relaxation time almost did not change in the control healthy rats, whereas it decreased significantly in the severe AP model compared with healthy or mild AP rats. As M-Gd-NL was injected into severe AP rats, T1 value of ROIs dropped from its baseline value of 1,225.3–834.1 ms at 60 min post-injection and remained low at 508.2 ms even after 180 min.
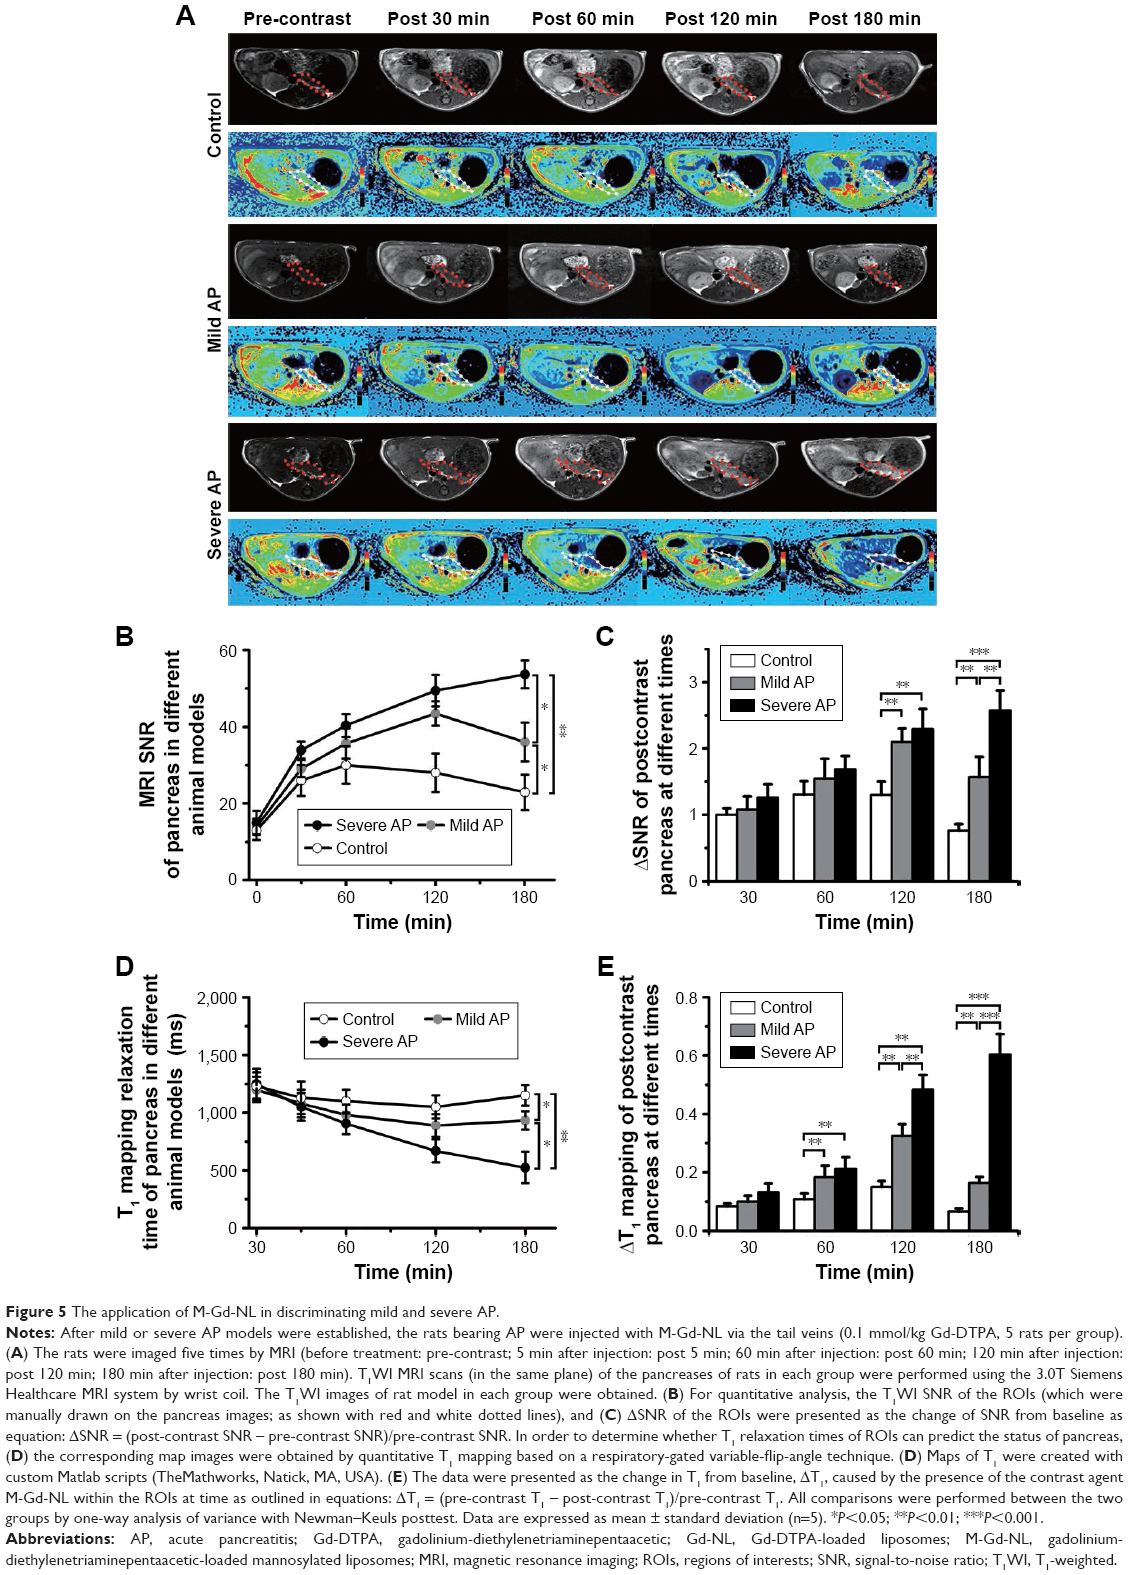 | Figure 5 The application of M-Gd-NL in discriminating mild and severe AP. |
To achieve a better discrimination effect, we calculated the ΔSNR value using Equation (2). At 120 min, ΔSNR was significantly higher in mild and severe AP than in control healthy rats. It is noteworthy that, at 180 min, ΔSNR was significantly higher in severe AP rats than mild AP rats as shown in Figure 5C, suggesting that the higher retention of M-Gd-NL in ROIs may not only be helpful in diagnosing AP early in the development of the disease but also in predicting mild or severe AP. The ΔT1 value of each model, as calculated by Equation (3), is shown in Figure 5E. Remarkably, ΔT1 was significantly higher in AP rats than in healthy AP rats at 60, 120, and 180 min. Notably, at two time points (120 and 180 min), the ΔT1 value was significantly higher in severe AP rats than in mild AP rats (P<0.05; Figure 5E). Taken together, these results suggest that M-Gd-NL has the ability to predict AP, and even discriminate between mild and severe AP.
In vivo pancreas distribution of DiR-loaded M-Gd-NL
We also injected DiR-loaded M-Gd-NL into rats to demonstrate whether it could be used to discriminate between mild and severe AP. After the mild or severe AP model was established in SD rats, DiR-loaded M-Gd-NL was injected via their tail vein, excised pancreas was imaged with IVIS Lumina II Imaging System after 4 h, and the average radiant efficiency measured. As seen in Figure 6A and as quantified in Figure 7B, there was a large increase in DiR accumulation in the pancreas of the severe AP group compared with the mild pancreatitis group, suggesting that DiR-loaded M-Gd-NL can better accumulate in severe AP than in mild AP.
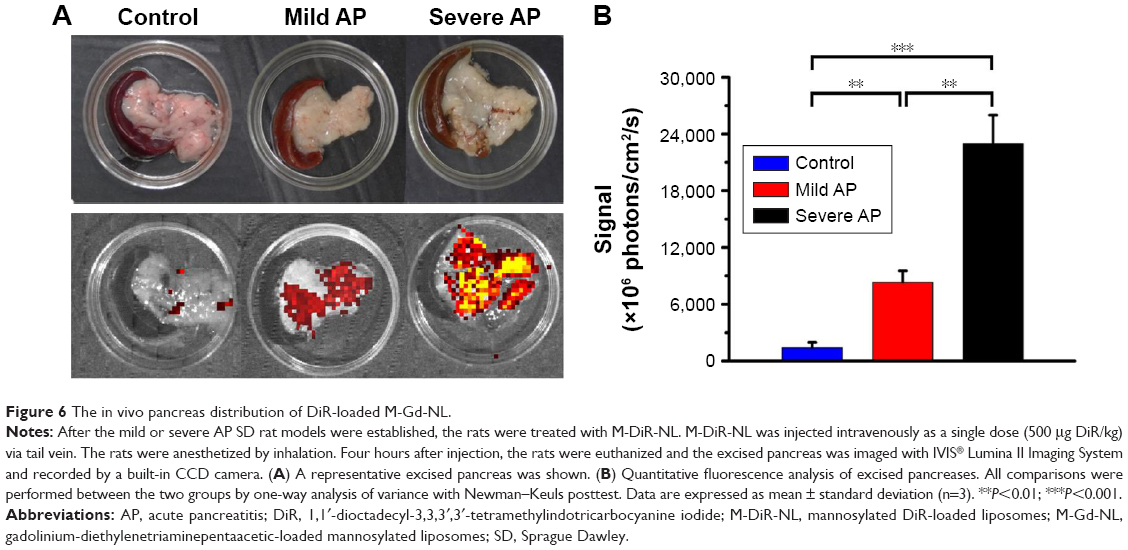 | Figure 6 The in vivo pancreas distribution of DiR-loaded M-Gd-NL. |
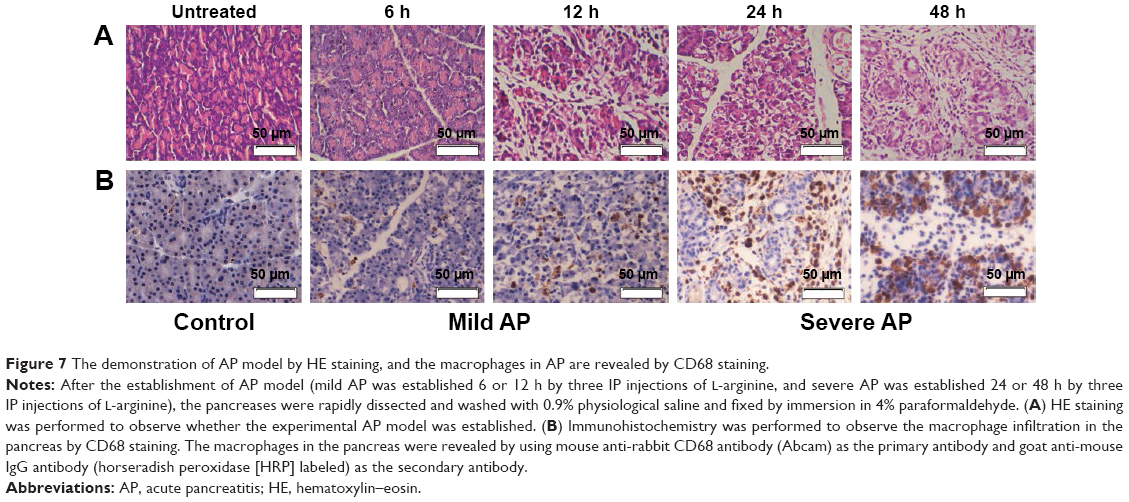 | Figure 7 The demonstration of AP model by HE staining, and the macrophages in AP are revealed by CD68 staining. |
Macrophage infiltration was significant in severe AP model
To verify whether AP models in rats were successfully induced by L-arginine IP injection, we examined the histologic changes induced by L-arginine. The pancreatic tissue was stained with HE to be evaluated by light microscopy (Figure 7A). The 6- and 12-h groups showed histopathologic changes of mild AP, including mild edema, little acinar necrosis, and inflammation, occasionally associated with some foci of hemorrhage and fat necrosis. While the 24- and 48-h groups showed histopathologic changes of severe AP, including pronounced edema, marked interstitial leukocyte infiltration, intrapancreatic hemorrhage, and fat necrosis.35 In particular, a significant increase in macrophage infiltration was observed in AP compared with healthy controls by staining with CD68 antibody (Figure 7B). Notably, macrophage infiltration was significantly increased in severe AP compared with mild AP, suggesting that macrophage infiltration correlates positively with the severity of AP.
In vivo toxicity assay
The toxicity of treatments was evaluated by HE staining, and none of the rats showed noticeable pathologic changes in any organs (Figure 8). The results show that rats exhibited tolerance to all the treatments.
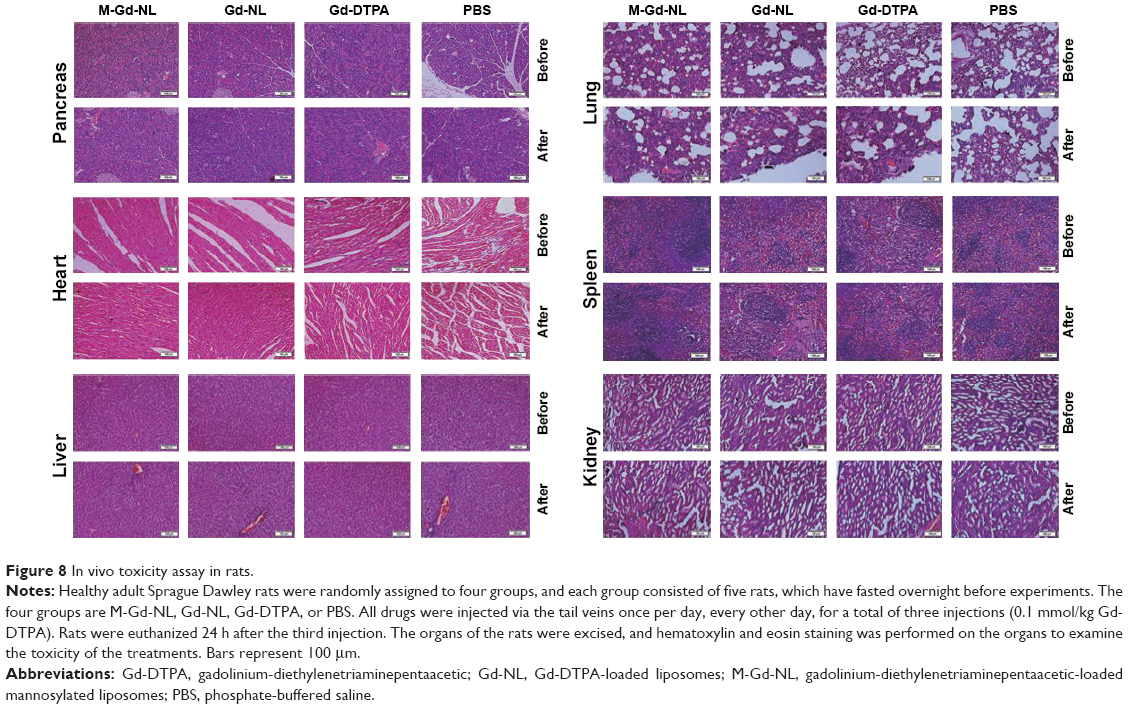 | Figure 8 In vivo toxicity assay in rats. |
Discussion
AP has a complex pathogenesis, with acute pancreatic injury difficult to prevent and cure. Importantly, severe AP can induce or exacerbate the systemic inflammatory response and result in MODS. The early prediction of AP is important, because most clinical cases of AP are mild, and currently no early predictors are reliable to distinguish between mild cases from the ones that subsequently develop severe necrosis. In this study, we have developed novel Gd-DTPA-loaded mannosylated liposomes that preferably target macrophages in AP, resulting in its early detection, improved MRI, and discrimination between mild and severe AP. In particular, based on their benefit demonstrated in this rapidly evolving inflammatory disease in a rat model, this study opens the scope of M-Gd-NL as predictors of AP disease severity in humans.
The selection of nanocarriers, imaging reagents, and targeting probe is critically important for a superior activity and safety of the imaging liposomes that we developed. First, the nanocarriers used in this study were nanosize liposomes, which are spherical lipid vesicles with single or multiple lipid bilayers that are widely used owing to their high biocompatibility, favorable pharmacokinetic profile, ease of surface modification, and long circulation time after surface modification by PEG.36,37 Moreover, liposomes showed high encapsulation efficacy toward liposoluble drugs. Here, M-Gd-NL and Gd-NL had a small size of ~100 nm, narrow distribution and, more importantly, high encapsulation efficacy of Gd-DTPA due to the attachment of DPPE to this imaging reagent. Furthermore, M-Gd-NL showed superior stability in both PBS and 10% FBS, indicating that M-Gd-NL possess a rigid structure which structural integrity is well maintained.
Second, Gd-DTPA, the imaging reagent used in our study, is a well-characterized, safe contrast agent frequently used in MRI.25,26 It can enhance the T1WI contrast for MRI because the unpaired electrons of Gd exhibit strong water proton spin–lattice relaxation effect.38 T1WI spin echo sequences in target organs demonstrated a variable degree of contrast enhancement, which was unrelated to the pancreas histologic structures. Notably, the relaxivity of Gd-DTPA, which reflects how the relaxation rates of a solution change as a function of concentration, was significantly increased after liposomal encapsulation, because DPPE-DTPA(Gd) embedding in the liposome bilayer confined Gd complexes in the bilayer and slowed down its tumbling motions, leading to a higher molecular relaxivity than Gd-DTPA alone.27,28
Third, ligand-conjugated nanomedicines can significantly improve the therapeutic efficacy of chemotherapeutics, nucleic acid drugs, and diagnostic agents, and diagnosis of cancer.39 In this study, the presence of mannose was critical to maintain the targeting activity of M-Gd-NL toward macrophages. The data presented here confirm that M-Gd-NL did efficiently bind and uptake into macrophages, resulting in enhanced MRI ability, as compared with Gd-NL. In contrast, due to the lack of mannose conjugation, Gd-NL did not efficiently bind to macrophages, thus making the uptake into macrophages minimal. In vivo MRI assays demonstrated that M-Gd-NL showed better imaging ability than Gd-NL and Gd-DTPA. In addition to increased diagnostic ability of M-Gd-NL, M-Gd-NL showed an ability to predict AP and even to discriminate between mild and severe AP.
As conventional T1WI MRI (eg, gradient echo imaging) are limited by variation of the image contrast, which depends on the type of sequence and the imaging parameters used by different scanners, T1 mapping, a form of tissue characterization that is performed with a parametric approach, is gaining rapid popularity. It is a more reliable and accurate method to directly measure T1 relaxation time of the target organ,40 T1 mapping sequences have been developed and applied to clinical routine assessment of healthy individuals and different diseases, including a number of cardiac conditions, such as myocardial fibrosis and myocardial deposition,41 liver cirrhosis,42 and pancreatitis.43,44 The T1 mapping technique used in this study for the prediction of pancreatitis that presented a better discrimination compared with the conventional T1WI techniques. As the numerical T1 value is tissue-specific, its shortened time ΔT1 during the in vivo experiment was more noticeable than ΔSNR, which depends on the reference value. We noticed that the ΔT1 value of M-Gd-NL made a distinction between pancreatitis and healthy pancreas at 60 min, whereas ΔSNR took 120 min. Moreover, the distinction between mild AP and severe AP based on the ΔT1 value was 120 min, which was 60 min ahead of ΔSNR. Thus, T1 mapping image acquisition represents a better and more accurate approach to diagnose AP with M-Gd-NL.
This study has three limitations. One limitation is that mannose receptors are not only expressed on macrophages but also on other antigen-presenting cells.45 However, due to its relative specificity, mannose is still used as a targeting ligand of macrophages in many nanomedicines.18 The second limitation is that after demonstration of the superior targeting and MRI ability of M-Gd-NL over Gd-NL and Gd-DTPA in vitro and in vivo, the discrimination between mild and severe AP in vivo was only performed with M-Gd-NL, and not Gd-NL or Gd-DTPA, due to huge workload in AP rat models and MRI. The third limitation is that macrophages are overexpressed in every type of inflammation and not only in pancreatitis. Therefore, mannose-coated liposomes will recognize not only the macrophages associated with pancreatitis but also all other macrophages.
Taken together, our data help to elucidate the diagnostic mechanism of M-Gd-NL. First, due to its hydrophilic PEGylated lipid coating, M-Gd-NL had an extended circulation time after intravenous injection. Second, due to mannose conjugation, M-Gd-NL did bind to the mannose receptors expressed on the macrophages infiltrated in the pancreas. Third, after binding to the macrophages, M-Gd-NL readily released Gd-DTPA into macrophages, resulting in enhanced MRI ability than that of Gd-NL or Gd-DTPA. Finally, safety is an important factor, for the application of nanomedicines in clinic. In our experiments, M-Gd-NL did not show any severe organ toxicity in rats. Thus, M-Gd-NL is expected to have good safety in clinical use, though additional safety studies are warranted.
Conclusion
Our data suggest that M-Gd-NL have an enhanced MRI ability by targeting macrophages in AP and a good ability to discriminate between mild and severe AP. We believe that M-Gd-NL could shed new light on the diagnosis of AP in the near future and that patients with AP will benefit from this treatment.
Acknowledgment
This work was financially supported by the National Natural Science Foundation of China (project number 81300366).
Disclosure
The authors report no conflicts of interest in this work.
References
Mason JM, Babu BI, Bagul A, Siriwardena AK. The performance of organ dysfunction scores for the early prediction and management of severity in acute pancreatitis: an exploratory phase diagnostic study. Pancreas. 2010;39(7):1104–1108. | ||
Dambrauskas Z, Parseliunas A, Gulbinas A, Pundzius J, Barauskas G. Early recognition of abdominal compartment syndrome in patients with acute pancreatitis. World J Gastroenterol. 2009;15(6):717–721. | ||
Halonen KI, Pettilä V, Leppäniemi AK, Kemppainen EA, Puolakkainen PA, Haapiainen RK. Multiple organ dysfunction associated with severe acute pancreatitis. Crit Care Med. 2002;30(6):1274–1279. | ||
Walsh MK. Diagnosis, prognosis, and treatment of acute pancreatitis. Am Fam Physician. 2008;77(5):594. | ||
Dervenis C, Johnson CD, Bassi C, et al. Diagnosis, objective assessment of severity, and management of acute pancreatitis. Santorini consensus conference. Int J Pancreatol. 1999;25(3):195–210. | ||
Gordon S. Alternative activation of macrophages. Nat Rev Immunol. 2003;3(1):23–35. | ||
Fujiwara N, Kobayashi K. Macrophages in inflammation. Curr Drug Targets Inflamm Allergy. 2005;4(3):281–286. | ||
Gea-Sorlí S, Closa D. Role of macrophages in the progression of acute pancreatitis. World J Gastrointest Pharmacol Ther. 2010;1(5):107–111. | ||
Closa D, Sabater L, Fernández-Cruz L, Prats N, Gelpí E, Roselló-Catafau J. Activation of alveolar macrophages in lung injury associated with experimental acute pancreatitis is mediated by the liver. Ann Surg. 1999;229(2):230–236. | ||
Akbarshahi H, Menzel M, Posaric Bauden M, Rosendahl A, Andersson R. Enrichment of murine CD68 + CCR2 + and CD68+CD206+ lung macrophages in acute pancreatitis-associated acute lung injury. PLoS One. 2012;7(10):e42654. | ||
Owens DE, Peppas NA. Opsonisation, biodistribution, and pharmacokinetics of polymeric nanoparticles. Int J Pharm. 2006;307(1):93–102. | ||
Vinogradov S, Warren G, Wei X. Macrophages associated with tumors as potential targets and therapeutic intermediates. Nanomedicine (Lond). 2014;9(5):695–707. | ||
Xia XR, Monteiro-Riviere NA, Riviere JE. An index for characterization of nanomaterials in biological systems. Nat Nanotechnol. 2010;5(9):671–675. | ||
Kanno S, Wu YJ, Lee PC, et al. Macrophage accumulation associated with rat cardiac allograft rejection detected by magnetic resonance imaging with ultrasmall superparamagnetic iron oxide particles. Circulation. 2001;104(8):934–938. | ||
Moon H, Park HE, Kang J, et al. Noninvasive assessment of myocardial inflammation by cardiovascular magnetic resonance in a rat model of experimental autoimmune myocarditis. Circulation. 2012;125(21):2603–2612. | ||
Dong Y, Chen H, Chen C, et al. Polymer-lipid hybrid theranostic nanoparticles co-delivering ultrasmall superparamagnetic iron oxide and paclitaxel for targeted magnetic resonance imaging and therapy in atherosclerotic plaque. J Biomed Nanotechnol. 2016;12(6):1245–1257. | ||
Nasu K, Kuroki Y, Nawano S, et al. Hepatic metastases: diffusion-weighted sensitivity-encoding versus SPIO-enhanced MR imaging. Radiology. 2006;239(1):122–130. | ||
Shepherd VL, Lee YC, Schlesinger PH, Stahl PD. L-Fucose-terminated glycoconjugates are recognized by pinocytosis receptors on macrophages. Proc Natl Acad Sci U S A. 1981;78(2):1019–1022. | ||
Stahl PD, Rodman JS, Miller MJ, Schlesinger PH. Evidence for receptor-mediated binding of glycoproteins, glycoconjugates, and lysosomal glycosidases by alveolar macrophages. Proc Natl Acad Sci U S A. 1978;75(3):1399–1403. | ||
Kelly C, Jefferies C, Cryan SA. Targeted liposomal drug delivery to monocytes and macrophages. J Drug Deliv. 2011;2011:727241. | ||
Ikehara Y, Shiuchi N, Kabata-Ikehara S, et al. Effective induction of anti-tumor immune responses with oligomannose-coated liposome targeting to intraperitoneal phagocytic cells. Cancer Lett. 2008;260(1–2):137–145. | ||
Khandhar AP, Ferguson RM, Arami H, Krishnan KM. Monodisperse magnetite nanoparticle tracers for in vivo magnetic particle imaging. Biomaterials. 2013;34(15):3837–3845. | ||
Mazooz G, Mehlman T, Lai TS, Greenberg CS, Dewhirst MW, Neeman M. Development of magnetic resonance imaging contrast material for in vivo mapping of tissue transglutaminase activity. Cancer Res. 2005;65(4):1369–1375. | ||
Stimac D, Miletić D, Radić M, et al. The role of nonenhanced magnetic resonance imaging in the early assessment of acute pancreatitis. Am J Gastroenterol. 2007;102(5):997–1004. | ||
Chen KJ, Wolahan SM, Wang H, et al. A small MRI contrast agent library of gadolinium(III)-encapsulated supramolecular nanoparticles for improved relaxivity and sensitivity. Biomaterials. 2011;32(8):2160–2165. | ||
Saifuddin A, Ward J, Ridgway J, Chalmers AG. Comparison of MR and CT scanning in severe acute pancreatitis: initial experiences. Clin Radiol. 1993;48(2):111–116. | ||
Filippi M, Remotti D, Botta M, Terreno E, Tei L. GdDOTAGA(C18)2: an efficient amphiphilic Gd(iii) chelate for the preparation of self-assembled high relaxivity MRI nanoprobes. Chem Commun (Camb). 2015;51(98):17455–17458. | ||
Gambino G, Tei L, Carniato F, Botta M. Amphiphilic ditopic bis-aqua Gd-AAZTA-like complexes enhance relaxivity of lipidic MRI nanoprobes. Chem Asian J. 2016;11(15):2139–2143. | ||
Un K, Kawakami S, Suzuki R, Maruyama K, Yamashita F, Hashida M. Development of an ultrasound-responsive and mannose-modified gene carrier for DNA vaccine therapy. Biomaterials. 2010; 31(30):7813–7826. | ||
Lee YC, Stowell CP, Krantz MJ. 2-Imino-2-methoxyethyl 1-thioglycosides: new reagents for attaching sugars to proteins. Biochemistry. 1976;15(18):3956–3963. | ||
Zhou Z, Lu ZR. Gadolinium-based contrast agents for magnetic resonance cancer imaging. Wiley Interdiscip Rev Nanomed Nanobiotechnol. 2013;5(1):1–18. | ||
Zhang HW, Wang LQ, Xiang QF, et al. Specific lipase-responsive polymer-coated gadolinium nanoparticles for MR imaging of early acute pancreatitis. Biomaterials. 2014;35(1):356–367. | ||
Yoon JH, Lee JM, Paek M, Han JK, Choi BI. Quantitative assessment of hepatic function: modified look-locker inversion recovery (MOLLI) sequence for T1 mapping on Gd-EOB-DTPA-enhanced liver MR imaging. Eur Radiol. 2016;26(6):1775–1782. | ||
Terreno E, Castelli DD, Viale A, Aime S. Challenges for molecular magnetic resonance imaging. Chem Rev. 2010;110(5):3019–3042. | ||
Schmidt J, Rattner DW, Lewandrowski K, et al. A better model of acute pancreatitis for evaluating therapy. Ann Surg. 1992;215(1):44–56. | ||
Su X, Song H, Niu F, et al. Co-delivery of doxorubicin and PEGylated C16-ceramide by liposomes for enhanced therapy against multi-drug resistance. Nanomedicine (Lond). 2015;10(13):2033–2050. | ||
Song H, Su X, Yang K, et al. CD20 antibody-conjugated immunoliposomes for targeted chemotherapy of melanoma cancer initiating cells. J Biomed Nanotechnol. 2015;11(11):1927–1946. | ||
Langereis S, Geelen T, Grüll H, Strijkers GJ, Nicolay K. Paramagnetic liposomes for molecular MRI and MRI-guided drug delivery. NMR Biomed. 2013;26(7):728–744. | ||
Gao J, Feng SS, Guo Y. Antibody engineering promotes nanomedicine for cancer treatment. Nanomedicine (Lond). 2010;5(8):1141–1145. | ||
Chen Y, Jiang Y, Pahwa S, et al. MR fingerprinting for rapid quantitative abdominal imaging. Radiology. 2016;279(1):278–286. | ||
Schelbert EB, Messroghli DR. State of the art: clinical applications of cardiac T1 mapping. Radiology. 2016;278(3):658–676. | ||
Besa C, Bane O, Jajamovich G, Marchione J, Taouli B. 3D T1 relaxometry pre and post gadoxetic acid injection for the assessment of liver cirrhosis and liver function. Magn Reson Imaging. 2015;33(9):1075–1082. | ||
Tirkes T, Lin C, Fogel EL, Sherman SS, Wang Q, Sandrasegaran K. T1 mapping for diagnosis of mild chronic pancreatitis. J Magn Reson Imaging. Epub 2016 Aug 13. | ||
Kim M, Jang KM, Kim JH, et al. Differentiation of mass-forming focal pancreatitis from pancreatic ductal adenocarcinoma: value of characterizing dynamic enhancement patterns on contrast-enhanced MR images by adding signal intensity color mapping. Eur Radiol. Epub 2016 Aug 10. | ||
Tan MC, Mommaas AM, Drijfhout JW, et al. Mannose receptor-mediated uptake of antigens strongly enhances HLA class II-restricted antigen presentation by cultured dendritic cells. Eur J Immunol. 1997;27(9):2426–2435. |
Supplementary materials
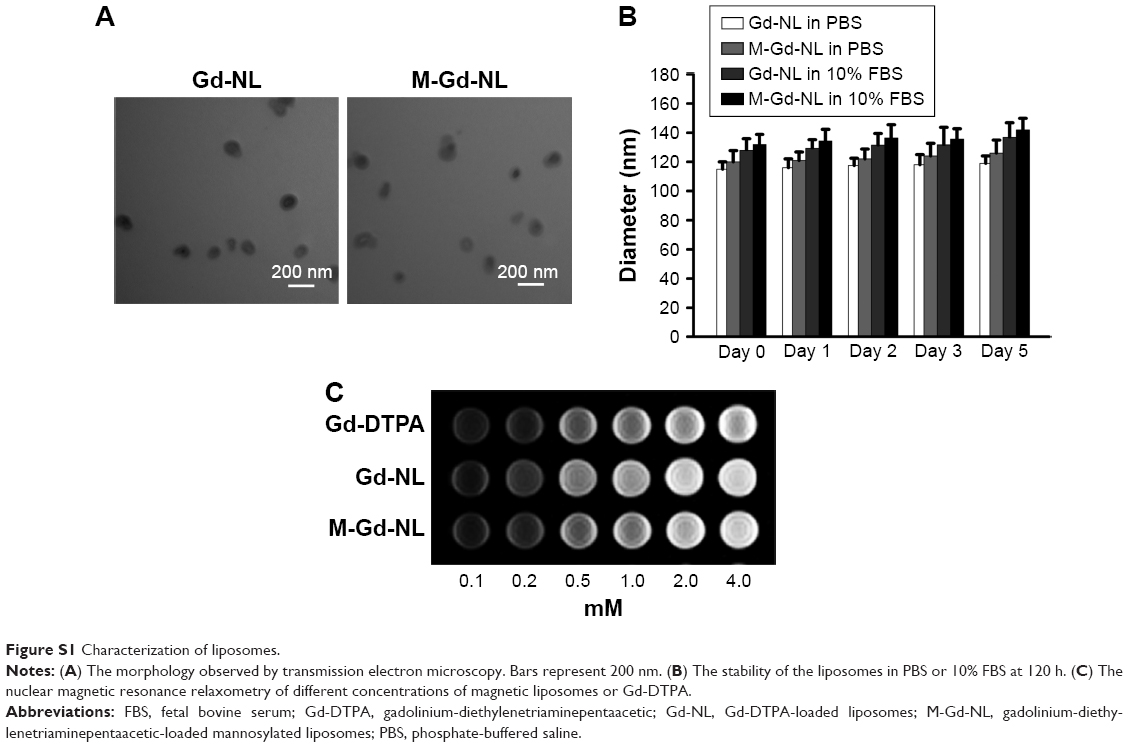 | Figure S1 Characterization of liposomes. |
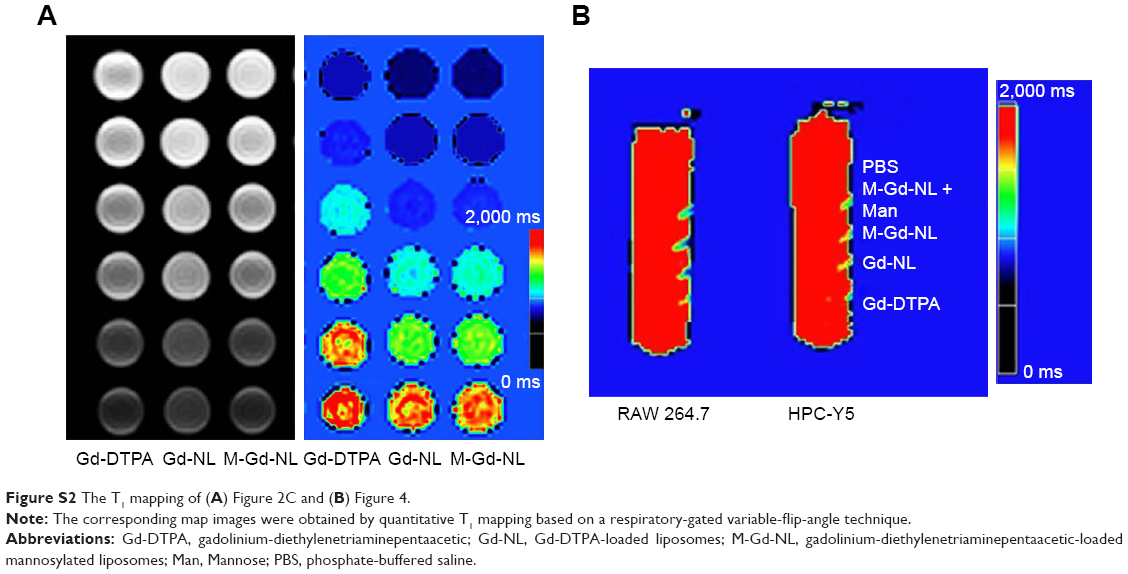 | Figure S2 The T1 mapping of (A) Figure 2C and (B) Figure 4. |
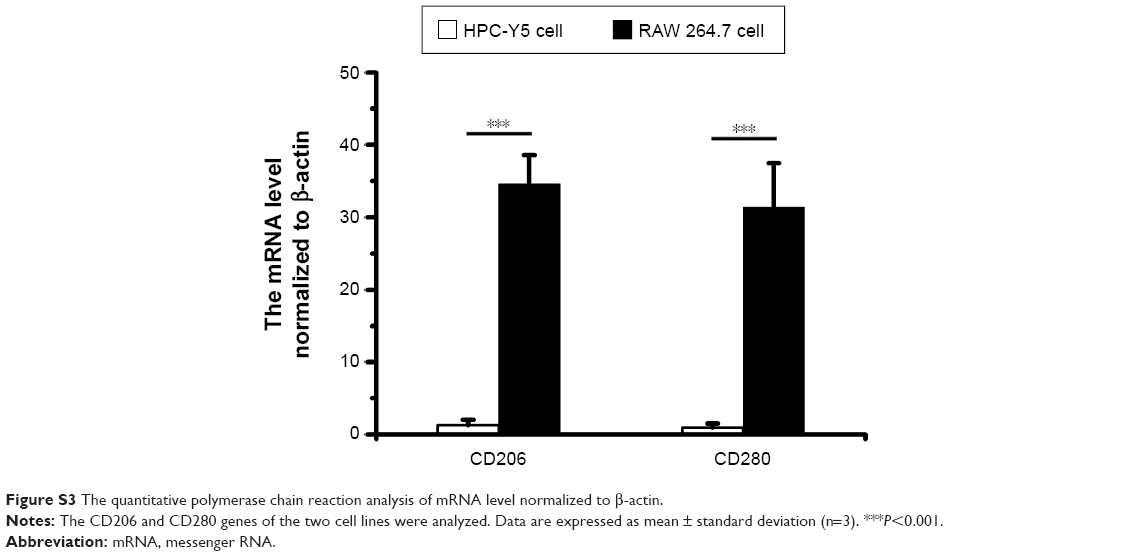 | Figure S3 The quantitative polymerase chain reaction analysis of mRNA level normalized to β-actin. |
 © 2017 The Author(s). This work is published and licensed by Dove Medical Press Limited. The
full terms of this license are available at https://www.dovepress.com/terms
and incorporate the Creative Commons Attribution
- Non Commercial (unported, 3.0) License.
By accessing the work you hereby accept the Terms. Non-commercial uses of the work are permitted
without any further permission from Dove Medical Press Limited, provided the work is properly
attributed. For permission for commercial use of this work, please see paragraphs 4.2 and 5 of our Terms.
© 2017 The Author(s). This work is published and licensed by Dove Medical Press Limited. The
full terms of this license are available at https://www.dovepress.com/terms
and incorporate the Creative Commons Attribution
- Non Commercial (unported, 3.0) License.
By accessing the work you hereby accept the Terms. Non-commercial uses of the work are permitted
without any further permission from Dove Medical Press Limited, provided the work is properly
attributed. For permission for commercial use of this work, please see paragraphs 4.2 and 5 of our Terms.