Back to Journals » International Journal of Nanomedicine » Volume 13
Mangosteen pericarp extract embedded in electrospun PVP nanofiber mats: physicochemical properties and release mechanism of α-mangostin
Authors Sriyanti I ![]() , Edikresnha D, Rahma A, Munir MM
, Edikresnha D, Rahma A, Munir MM ![]() , Rachmawati H, Khairurrijal K
, Rachmawati H, Khairurrijal K ![]()
Received 8 March 2018
Accepted for publication 24 May 2018
Published 31 August 2018 Volume 2018:13 Pages 4927—4941
DOI https://doi.org/10.2147/IJN.S167670
Checked for plagiarism Yes
Review by Single anonymous peer review
Peer reviewer comments 3
Editor who approved publication: Dr Thomas Webster
Ida Sriyanti,1–3 Dhewa Edikresnha,1,2 Annisa Rahma,4 Muhammad Miftahul Munir,1,2 Heni Rachmawati,4,5 Khairurrijal Khairurrijal1,2
1Department of Physics, Faculty of Mathematics and Natural Sciences, 2Research Center for Bioscience and Biotechnology, Institute for Research and Community Services, Institut Teknologi Bandung, Bandung, 3Department of Physics Education, Faculty of Education, Universitas Sriwijaya, Palembang, 4Pharmaceutics Research Division, School of Pharmacy, 5Research Center for Nanoscience and Nanotechnology, Institute for Research and Community Services, Institut Teknologi Bandung, Bandung, Indonesia
Background: α-Mangostin is a major active compound of mangosteen (Garcinia mangostana L.) pericarp extract (MPE) that has potent antioxidant activity. Unfortunately, its poor aqueous solubility limits its therapeutic application. Purpose: This paper reports a promising approach to improve the clinical use of this substance through electrospinning technique.
Methods: Polyvinylpyrrolidone (PVP) was explored as a hydrophilic matrix to carry α-mangostin in MPE. Physicochemical properties of MPE:PVP nanofibers with various extract-to-polymer ratios were studied, including morphology, size, crystallinity, chemical interaction, and thermal behavior. Antioxidant activity and the release of α-mangostin, as the chemical marker of MPE, from the resulting fibers were investigated.
Results: It was obtained that the MPE:PVP nanofiber mats were flat, bead-free, and in a size range of 387–586 nm. Peak shifts in Fourier-transform infrared spectra of PVP in the presence of MPE suggested hydrogen bond formation between MPE and PVP. The differential scanning calorimetric study revealed a noticeable endothermic event at 119°C in MPE:PVP nanofibers, indicating vaporization of moisture residue. This confirmed hygroscopic property of PVP. The absence of crystalline peaks of MPE at 2θ of 5.99°, 11.62°, and 13.01° in the X-ray diffraction patterns of electrospun MPE:PVP nanofibers showed amorphization of MPE by PVP after being electrospun. The radical scavenging activity of MPE:PVP nanofibers exhibited lower IC50 value (55–67 µg/mL) in comparison with pure MPE (69 µg/mL). The PVP:MPE nanofibers tremendously increased the antioxidant activity of α-mangostin as well as its release rate. Applying high voltage in electrospinning process did not destroy the chemical structure of α-mangostin as indicated by retained in vitro antioxidant activity. The release rate of α-mangostin significantly increased from 35% to over 90% in 60 minutes. The release of α-mangostin from MPE:PVP nanofibers was dependent on α-mangostin concentration and particle size, as confirmed by the first-order kinetic model as well as the Hixson–Crowell kinetic model.
Conclusion: We successfully synthesized MPE:PVP nanofiber mats with enhanced antioxidant activity and release rate, which can potentially improve the therapeutic effects offered by MPE.
Keywords: α-mangostin, mangosteen, polyvinylpyrrolidone, electrospinning, nanofiber, drug delivery system
Introduction
Mangosteen (Garcinia mangostana L.) is a tropical plant that is cultivated mostly in Southeast Asian countries. Xanthone-rich pericarp of mangosteen has demonstrated numerous biological activities including anti-inflammatory, antiparasitic, antitumor, and antioxidant activities.1–5 Xanthones exist as either oxygenated or prenylated form. The latter, particularly α-mangostin, β-mangostin, and γ-mangostin as the most abundant xanthone-type compounds, has gained a special attention due to its beneficial effects for health.6–8 Various studies have reported α-mangostin to exhibit antioxidant,9–11 antimicrobial,12–14 anti-inflamatory,15–17 and anticancer activities.18,19 However, the limited aqueous solubility20,21 property constricts bioavailability of α-mangostin via oral route. Hence, an appropriate delivery system is absolutely required to improve the efficacy of α-mangostin.
Nanotechnology seems to be a smart way to solve the clinical problem of α-mangostin. α-Mangostin can be incorporated into nano-sized biocompatible carriers such as biocompatible nanofibers. Decreasing particle size to nanoscale can greatly increase the surface area for a given quantity of biodegradable polymer material, which in turn significantly enhances the release of drug via drug diffusion and matrix degradation/erosion mechanisms.22–26 Nanofibers have been recognized for their applications in drug delivery.27–32 Nanofibers as drug delivery systems with their very large surface area to volume ratios have the potential to improve drug release significantly. Furthermore, the small dimension of fibers combined with their microporous structure provided by the polymer mimics a protective shield, resulting in increased drug loading and drug stability.33
Electrospinning is the most versatile technique for the synthesis of nanofibers.34,35 This technique involves Coulomb forces resulted from the applied electrical charge and elongation of polymer solution as a result of exposure to electrical charge. These events lead to the formation of fine fibers and accumulation of the fibers onto a grounded-collector.36 The size and morphology of the resulting fibers are highly tunable by proper adjustment of polymer properties (structure, molecular weight, and tacticity), precursor solution (viscosity and conductivity), and electrostatic field.37 Electrospinning offers great capability of producing fibers ranging from very small diameter to ≥10 nm and presents good mechanical characteristics with microporous structures and controlled surfaces,29 which makes electrospun fibers potentially demonstrate promising results as a drug delivery system.
Recently, few studies have reported successful development of polymer/mangosteen pericarp extract (MPE) nanofibers intended for various purposes. For instance, MPE was loaded onto polyvinyl alcohol (PVA) nanofibers for dermal delivery purpose38 and was spun in a mixture with chitosan (CS)/EDTA/PVA for wound healing.39 In such cases, the choice of polymer must be considered carefully since polymer can affect aqueous solubility of active compound and its release profile. Moreover, the underlining mechanism on how the polymer influences the release profile of the active substance needs to be understood. Water-soluble polymers such as PVA are a suitable matrix for nanofibers with rapid release. However, a highly soluble polymer such as PVP might be required in some cases, particularly when a faster release is desired.40 Therefore, the use of PVP for the production of MPE-loaded nanofibers intended for immediate release would be advantageous. Successful production of MPE:PVP nanofibers using electrospinning technique has been previously reported.34 However, comprehensive studies that investigate contributing factors affecting in vitro performance of MPE-containing nanofiber mats, such as crystallinity, size, and drug-to-polymer ratio, are still scarce.
In this study, we synthesized PVP:MPE nanofiber mats using electrospinning technique, in which PVP is an US Food and Drug Administration–approved polymer matrix that is acceptable for food and pharmaceutical products with low toxicity and highly biocompatible.34,41 In addition, it has great water solubility and spinnability,42 which are important for electrospinning process. It was expected that PVP would assist the release of α-mangostin more rapidly in comparison with other water-soluble polymers. The morphology, physicochemical characteristics, and in vitro release of α-mangostin, the marker compound for antioxidant activity of MPE, from the MPE:PVP nanofiber mats were examined. Moreover, in vitro antioxidant activity of α-mangostin was determined to study if a high voltage application during electrospinning impairs the biological activity of active compounds contained in MPE.
Materials and methods
Materials
Polyvinylpyrrolidone (PVP) with molecular weight of 1,300,000 kg mol−1, pure α-mangostin powder, and 1,1-diphenyl-2-picrylhydrazyl (DPPH) were obtained from Sigma-Aldrich Co. (St Louis, MO, USA). Mangosteen pericarp was collected from a local market in Bandung, Indonesia. Other chemical substances used for this study were of analytical grade.
α-Mangostin content assay
Pure MPE was prepared as follows. The fruit pericarps were rinsed with water thoroughly, cut into small pieces, and dried in oven at 50°C for 24 hours. The dried pericarps were milled into fine powder. The mangosteen pericarp powder was macerated with ethanol for 5 days. The as-macerated extract was filtered and concentrated using a rotary evaporator (RV 05-ST Janke & Kunkel IKA, Staufen, Germany) at 45°C and stored properly until used. α-Mangostin content in the MPE was analyzed using a high-performance liquid chromatography (HPLC) system as follows. MPE was accurately weighed and was dispersed in methanol with the final MPE content of 1,000 ppm. The mixture was homogenized for 20 minutes to allow for the extraction of α-mangostin. The mixture was then centrifuged at 10,000 rpm for 10 minutes, and the supernatant was collected. Dilution of the supernatant was performed accordingly.
The sample was injected into a C-18 column (250 × 4.6 mm, particle size of 5 μm; Phenomenex, CA, USA) using the HPLC system with a UV spectrophotometer detector (Agilent Technologies, Santa Clara, CA, USA). The mobile phase was water–methanol (95:5) with a flow rate of 1 mL/min. The pure MPE content was detected at a wavelength of 320 nm.
Preparation of nanofibers
PVP:MPE fibers were fabricated from a PVP:MPE precursor solution prepared with in situ process, in which PVP and MPE solutions were dissolved separately and then mixed together just before electrospinning process. The MPE solution (10 wt%) was prepared by dissolving MPE in ethanol at room temperature under constant stirring for 5 hours. Separately, the PVP solution was prepared in ethanol at 40°C and stirred for 2 hours. The PVP and MPE solutions were mixed and stirred for 1 hour at room temperature to form a homogeneous precursor solution.
An electrospinning apparatus (Nachriebe 600, Nachriebe; Integrated Laboratory of Materials and Instrumentation, Department of Physics, ITB, Bandung, Indonesia), which is schematically described in Figure 1, was used.67 It consists of a syringe pump to discharge the precursor solution in a syringe with needle, a high-voltage power supply (HVPS) with the positive pole connected to the needle to induce fiber formation via a solution jet, and a drum collector connected to the negative pole of HVPS to collect fibers. This apparatus produced fibers with very large surface area to volume ratio. Each precursor solution to produce nanofibers as given in Table 1, which is labeled as MF0, MF1, MF2, or MF3, was loaded into a 10 mL syringe with 0.45 mm needle. During electrospinning process, the flow rate of syringe pump was maintained at 5 μL/min, the high voltage at 10 kV, and the distance between needle and collector at 12 cm. The resulting fiber mats were subjected to α-mangostin content assay by using the method described in the previous section.
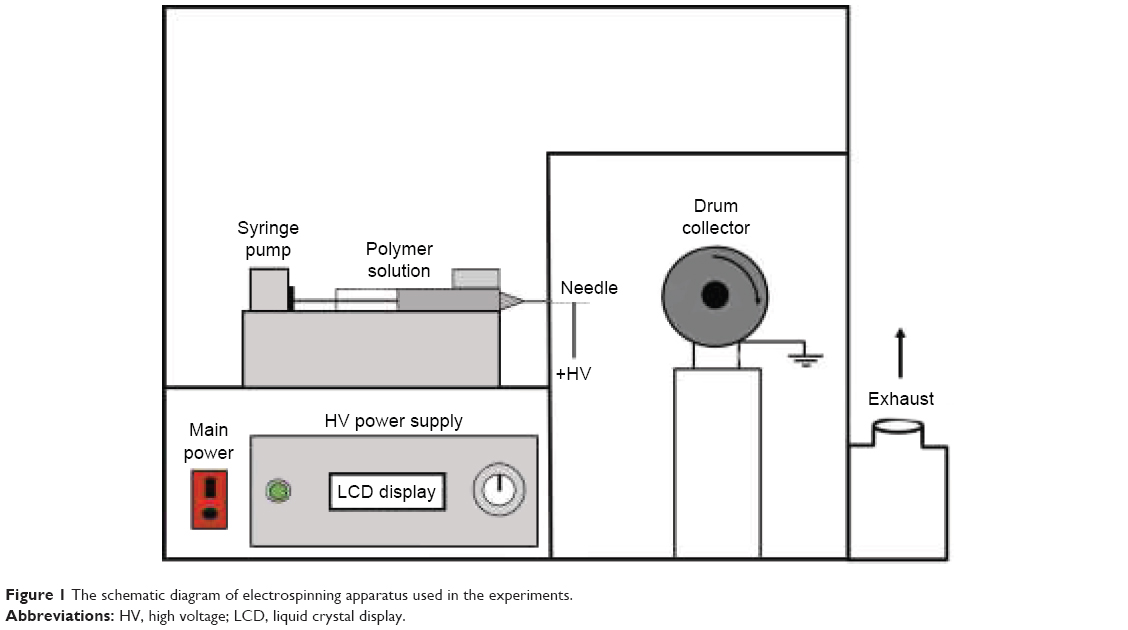 | Figure 1 The schematic diagram of electrospinning apparatus used in the experiments. |
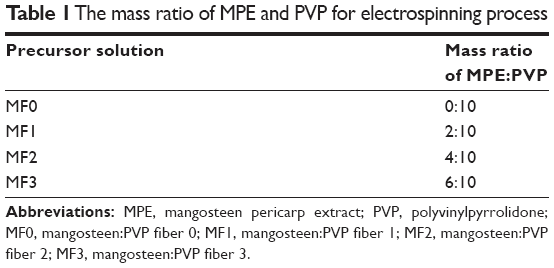 | Table 1 The mass ratio of MPE and PVP for electrospinning process |
Viscosity and conductivity
Viscosity and conductivity of the MF0, MF1, MF2, and MF3 precursor solutions were determined by using a Fenske-Ostwald viscometer (Thermo Fisher Scientific, Waltham, MA, USA) and a conductivity meter (Mettler Toledo) at 25°C, respectively.
Scanning electron microscopy
A scanning electron microscope (SEM, JSM-6510; JEOL, Tokyo, Japan) was used to examine the morphology of mats resulted from the MF0, MF1, MF2, and MF3 precursor solutions. Conductive coating of sample was applied prior to SEM imaging. SEM images of the mats were observed at the voltage of 10 kV and an optical magnification of 10,000 times. The size distribution of the fibers was determined using Origin ver.9 software (Origin Lab Corporation, MA, USA).
Fourier-transform infrared (FTIR) spectroscopy
FTIR analysis was performed to investigate the possible chemical interactions between PVP and MPE in the nanofibers. The FTIR spectra of nanofiber mats were acquired from an FTIR spectrophotometer (Alpha; Bruker, Germany) with spectral range of 500–4,000 cm−1.
X-ray diffraction (XRD)
An X-ray diffractometer (D8 Advance, Bruker) was used to obtain the XRD patterns of the pure MPE along with the MF0, MF1, MF2, and MF3 nanofiber mats. The sample was placed in a standard Cu tube and irradiated with Cu (Kα) with a wavelength of 1.5405 Å at an operating voltage of 40 kV and electric current of 35 mA. The angular position (2θ) of the diffraction pattern was recorded in the range of 5°–70°.
Differential scanning calorimetry
Thermal behaviors of the MF1, MF2, and MF3 nanofiber mats in comparison with the PVP (MF0) nanofiber mat were studied by a differential scanning calorimeter (DSC, STA PT1600; Linseis, NJ, USA). Accurately weighed samples were sealed in an aluminum crimp pan and scanned from 50°C to 270°C at a heating rate of 10°C/min.
Antioxidant activity
Scavenging activity of MPE/PVP nanofiber mats was performed by using a modified method reported by Blois.43 Various concentrations of the pure MPE were prepared, ranging from 10 to 80 μg/mL. Each preparation was reacted with equal volume of DPPH solution at 50 μg/mL concentration. The mixture was incubated for 30 minutes. The MF1, MF2, and MF3 nanofiber mats were treated likewise. The absorbance was measured after 30 minutes of incubation by using a UV-Visible spectrophotometer (DU 7500i; Beckman Coulter, CA, USA) at the wavelength of 515 nm. Methanol was used for blank absorbance reading. An amount of 50 μg/mL of DPPH solution was used as a control solution, and ascorbic acid was used as a reference material for antioxidant activity. The analysis was conducted in triplicate for ascorbic acid, pure MPE, and the nanofiber mats. Antioxidant activities of the pure MPE, MF1, MF2, and MF3 nanofiber mats were determined based on the reduction of DPPH absorbance by calculating the percentage of antioxidant activity.44
In vitro release study
Release profile of α-mangostin from the MF1, MF2, and MF3 nanofiber mats were studied on a dissolution test apparatus (SR8 Plus; Hanson Research, Los Angeles, CA, USA). Dissolution apparatus 2 (paddle apparatus) was used with the following conditions: paddle rotation speed of 50 rpm, 400 mL of phosphate-buffered solution (pH 6.8) as the medium, and temperature controlled at 37°C±0.5°C. Each nanofiber mat containing 40 mg of MPE was carefully weighed and was dispersed in the phosphate-buffered solution. This procedure was run triplicate. About 5 mL of aliquot was taken at 5, 10, 15, 30, 45, 60, and 120 minutes and the medium was replaced with equal volume of fresh buffer. The amount of α-mangostin released over time was measured by using the HPLC system at 320 nm as described previously. The summary of our study is illustrated in Figure 2.
 | Figure 2 Schematic illustration of the experiment. |
Release kinetics
The release kinetics of the pure MPE, PVP:MPE physical mixture, and nanofiber mats were investigated using zero-order model, first-order model,45,46 and Hixson–Crowell model,47 as follows:
- Zero-order model
In this model, the cumulative amount of drug released (Qt) is plotted against time. The pattern of drug release adopts the condition that the rate of drug release is independent of its concentration as shown by Eq (1).
|
|

where Qt is the total drug released at time t (in percentage concentration) and k0 is the constant of zero-order model (in concentration/time).
- Fist-order model
In this model, the log of the cumulative percentage of drug remaining is plotted against time. In this model, the rate of drug release is assumed to be dependent on its concentration as presented in Eq (2).
|
|
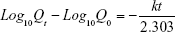
where Q0 is the initial concentration of the drug, k is the constant of first-order model, and t is the time.
- Hixson–Crowell model
This model is based on Hixson and Crowell (1931) recognizing that the regular area of the particle is proportional to the cubic root of its volume. This model has been used to describe the release profile considering the diminishing surface of the drug particles during the dissolution as in Eq (3).
|
|

where Q0 is the initial concentration of the drug, Qt is the amount of drug released at time t, and k is the constant of Hixson–Crowell model. A straight line can be gained by plotting  vs t while slope is the Hixson–Crowell constant.
Results and discussion
α-Mangostin content
α-Mangostin as the major xanthone in mangosteen pericarp was identified as a marker compound for quantitative analysis and standardization of MPE.12,48 Standardization of the MPE is required to maintain the product quality. In this study, this was achieved by determining the amount of α-mangostin contained in each nanofiber mat and the amount of α-mangostin released over time. It was found that the amount of α-mangostin in the pure MPE, MF1, MF2, and MF3 nanofiber mats were 13%, 1.3%, 2.6%, and 3.4%, respectively. When incorporated into nanofibers, the release rate of α-mangostin increased threefold in comparison with that of pure MPE, with more than 90% of α-mangostin released in just an hour. Figure 3 shows HPLC chromatograms of standard α-mangostin, MPE, and MF1, MF2, MF3 nanofiber mats. α-Mangostin was detected from the nanofiber samples by using the HPLC system at retention time of 6.4–6.7 minutes. The chromatogram showed that α-mangostin peak was clearly distinguished from the baseline and the other peaks.
 | Figure 3 HPLC chromatograms of α-mangostin, MPE and MF1-, MF2-, MF3 nanofiber mats. |
Morphology and average diameter of nanofibers
The morphology of MF0, MF1, MF2, and MF3 fiber mats observed by SEM is shown in Figure 4. The fibers were commonly ribbon-shaped without flaws such as bead formation or broken strands, with diameter in nanometer range. The presence of MPE with different mass concentrations in PVP fibers did not affect their morphologies. This finding is similar to our previous work in which the presence of curcumin in PVP nanofibers did not affect the shape of nanofibers.22 Although there were some polar–polar interactions between curcumin and PVP, the nanofibers were still in a uniform shape. Therefore, the formation of PVP:MPE nanofibers were absolutely influenced by the concentration of PVP:MPE solution in electrospinning process.
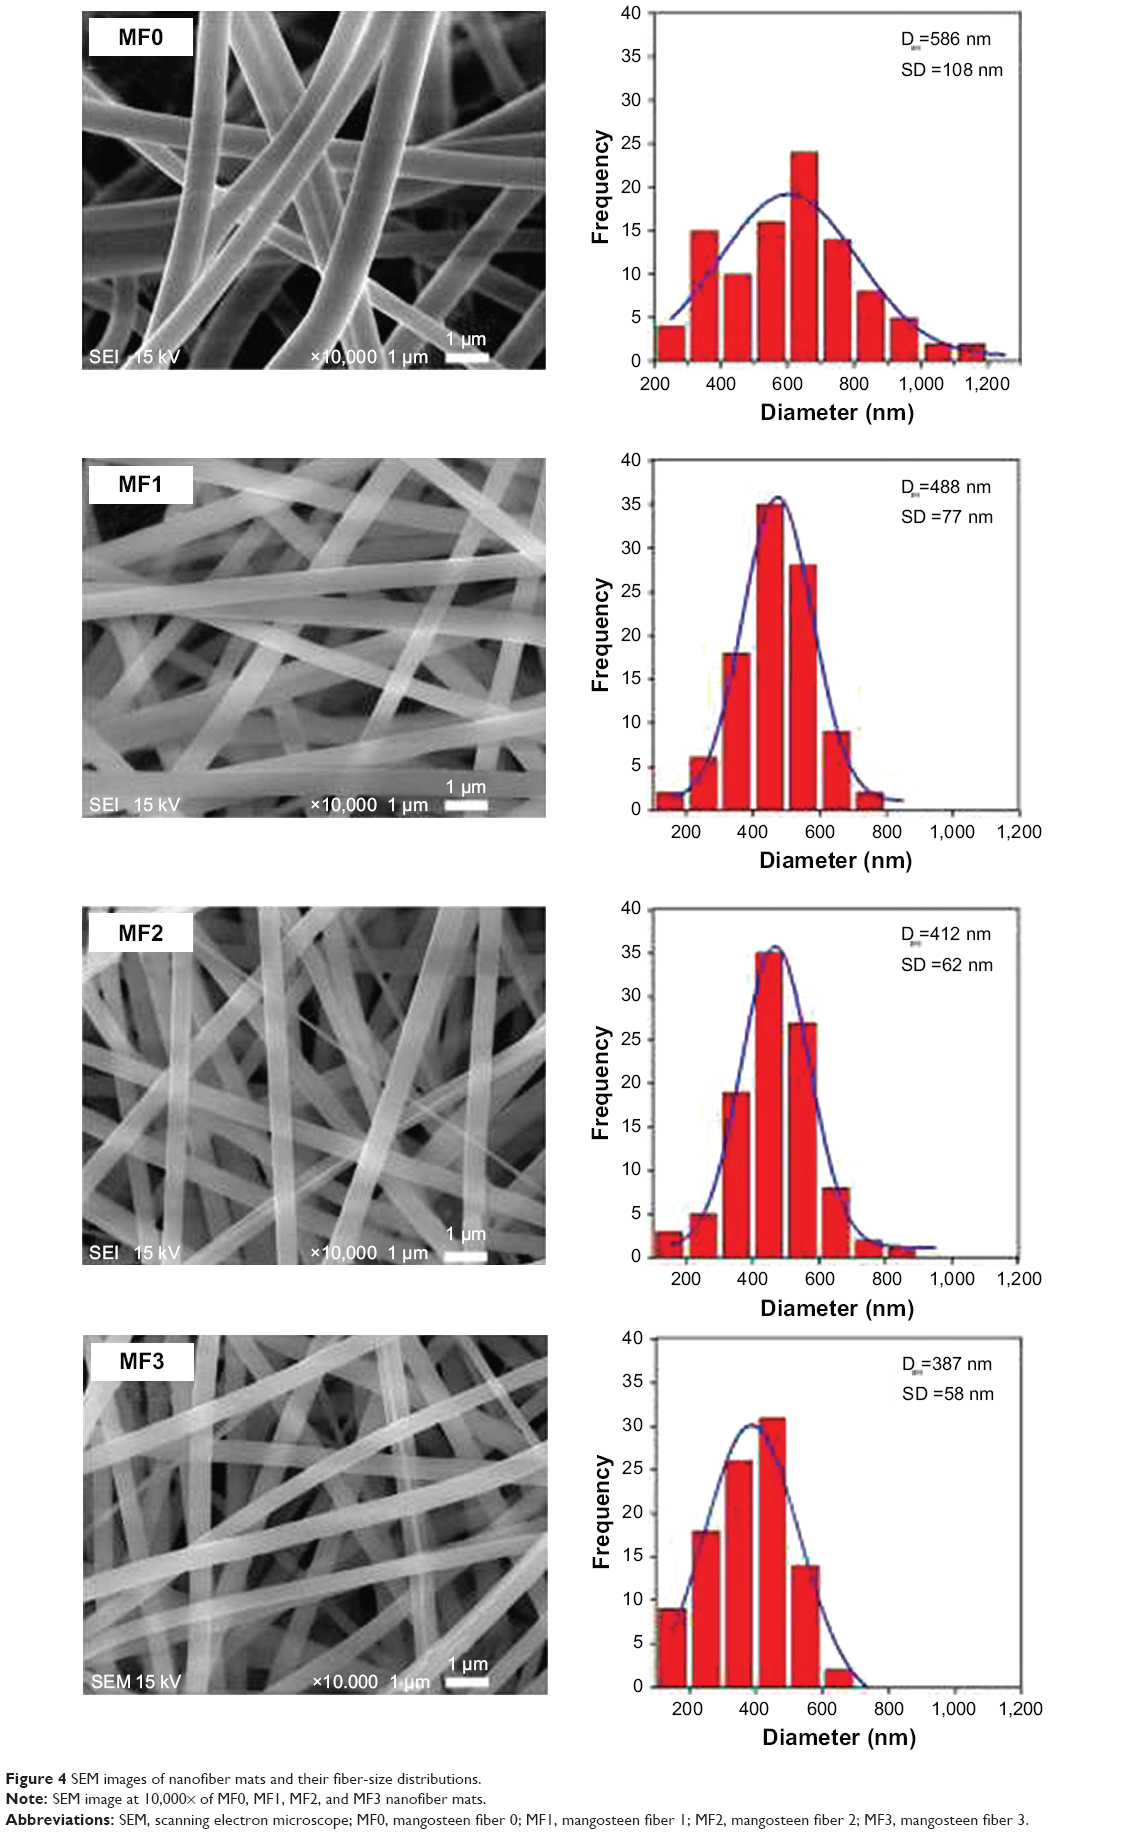 | Figure 4 SEM images of nanofiber mats and their fiber-size distributions. |
The diameters of MF0, MF1, MF2, and MF3 nanofibers of their mats varied in the range of 200 to 1,200 nm. The average diameters of these nanofibers were 586, 464, 412, and 387 nm, respectively. Figure 5 illustrates the average diameter of the nanofibers as a function of the MPE loaded to the nanofibers. As clearly depicted in the graph, the diameter of nanofibers decreased with the increase in MPE concentration. A possible reason is due to the influence of decreased viscosity and increased electric conductivity of the precursor solution. The viscosity of pure PVP precursor solution (MF0) was found to be 70.10 cP. In the presence of MPE, its viscosity decreased to 67.86, 61.76, and 55.87 cP for the MF1, MF2, and MF3 precursor solutions, respectively. The low-viscosity precursor solution resulted in less polymer unit per volume in the solution. Consequently, the polymer chains tend to interact with the solvent rather than to form a coiled structure and to entrap the solutes. Under this condition, the number of intermolecular interactions that can be formed between PVP and MPE such as van der Waals force, hydrogen bond, and dipole–dipole interaction is lower. These weak interactions caused PVP chains to straighten out in the solvent and be easily affected by the given electric field.36,49 The straightened PVP chains are more likely to achieve perfect elongation upon exposure to electrical charge during the electrospinning process, resulting in finer fibers. These presumptions can explain our findings where the diameter of the fibers became smaller when the viscosity decreased, with smallest diameter obtained in the MF3 nanofibers.
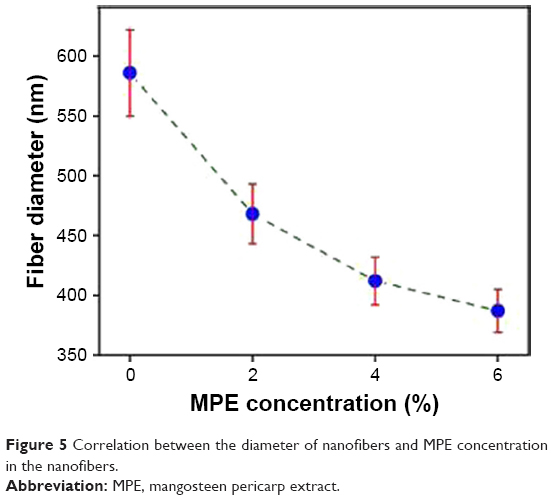 | Figure 5 Correlation between the diameter of nanofibers and MPE concentration in the nanofibers. |
It was found that the electrical conductivity of the PVP:MPE precursor solution increased as the concentration of MPE increased. The electrical conductivity of the MF3 precursor solution was the highest, that is, 258.3 μS/cm, while the MF1 had the lowest electrical conductivity at 118.2 μS/cm. Upon exposure to high voltage, the electrical conductivity of the precursor solution represents the number of ions at the surface of the solution. The MF3 precursor solution with a higher electrical conductivity underwent a rapid elongation due to higher ion formation on the surface of the solution.36,50 This phenomenon also explained a significant drop in the diameter of the electrospun nanofibers due to the increased electrical conductivity. These findings are in line with other studies that reported similar observation.51
FTIR spectroscopy analysis
FTIR study was conducted to identify characteristic functional groups in MPE, PVP (MF0) nanofiber mat, and MPE:PVP (MF1, MF2, and MF3 nanofiber mats). The recorded spectra are shown in Figure 6A. Hydroxyl group in the MPE was identified from a broad peak at 3,326 cm−1, which belongs to O−H stretching.21 This peak confirmed the presence of polyphenolic xanthones in the MPE.52 The peaks at 2,972 and 2,925 cm−1 were assigned to asymmetric C−H stretching of the methyl group.20,21 The presence of ester group in the MPE was indicated by sharp peaks at 1,639 cm−1 (C=O stretching of carbonyl group) and 1,279 cm−1 (C−O−C stretching of methoxy group).20,52 The medium-intensity peak at 1,423 cm−1 was assigned to asymmetric C=C stretching from aromatic ring.20 Alkene groups in the MPE were confirmed by the presence of peaks at 838 and 583 cm−1 for =C−H bending.53 The characteristic peaks of PVP were noticed in the FTIR spectrum of MF0 nanofiber mat: O−H stretching at around 3,420 cm−1, C=O stretching at 1,653 cm−1, and C−N stretching at 1,288 cm−1.54,55 Asymmetric stretching of CH2 in PVP chain was shown by the moderate peak at 2,952 cm−1.55
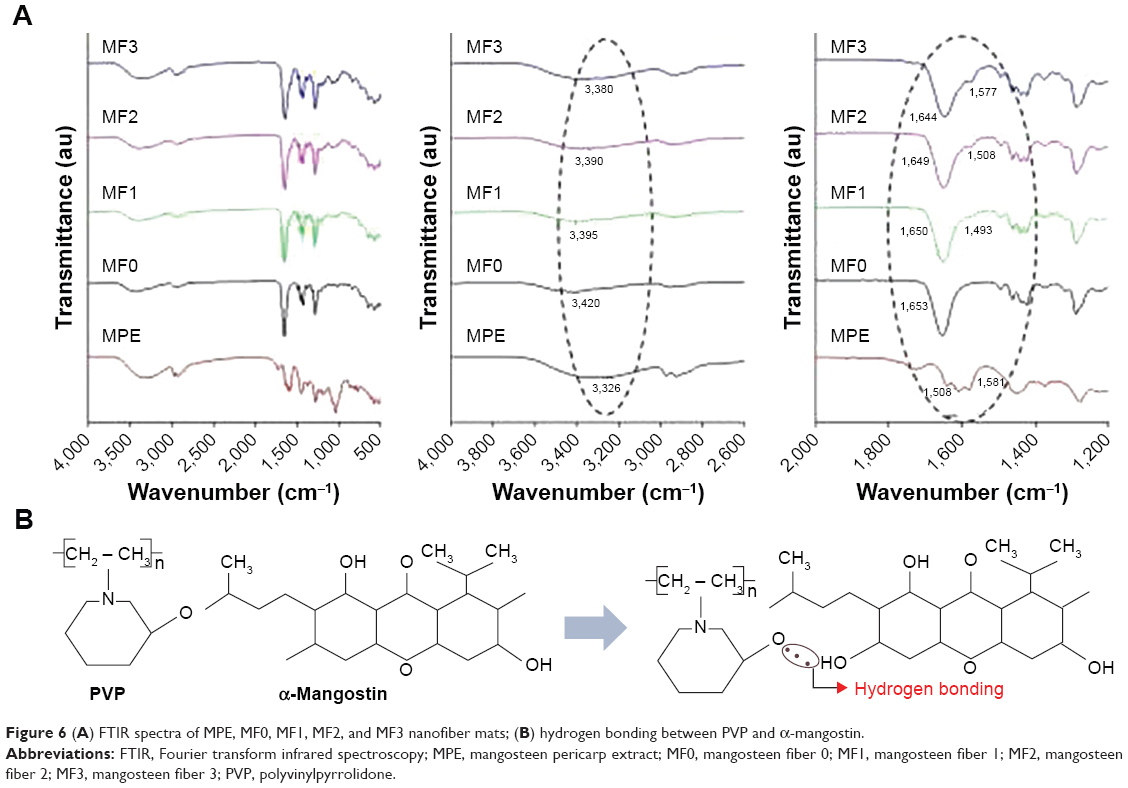 | Figure 6 (A) FTIR spectra of MPE, MF0, MF1, MF2, and MF3 nanofiber mats; (B) hydrogen bonding between PVP and α-mangostin. |
We observed two distinct features of infrared spectra of the MPE-containing nanofiber mats: 1) a higher MPE content led to sharper and more noticeable hydroxyl peaks occurring around 3,800–3,000 cm−1 and 2) a higher MPE content caused hydroxyl and carbonyl peak of PVP to shift toward lower wavenumbers. The hydroxyl peak of PVP in the MF0 nanofiber mat at 3,420 cm−1 shifted to 3,395 cm−1 in the MF1 nanofiber mat, while it changed to 3,390 and 3,380 cm−1 in the MF2 and MF3 nanofiber mats, respectively. The carbonyl stretching peak that belongs to pyrrolidone ring in PVP appeared at 1,653 cm−1. This peak appeared at 1,650 cm−1 in the MF1 nanofiber mat, while it existed at 1,649 and 1,644 cm−1 in the MF2 and MF3 nanofiber mats, respectively. The peak shift of carbonyl stretching was thought to be a result of intermolecular interaction between MPE and PVP via hydrogen bond formation,21 as shown in Figure 6B. The hydrogen bond is formed between hydroxyl group among the tricyclic rings in the MPE, as a strong hydrogen bond donor, and carbonyl group in the PVP, as a strong hydrogen bond acceptor. However, the presence of OH− stretching in the spectrum of pure PVP and its direction of peak shift indicated that the PVP chains were partially hydrated, owing to its hygroscopic nature.22 The adsorbed moisture on the surface of PVP was also confirmed by thermal analysis, which is described later in our DSC results. As a result, the moisture contained in PVP chains also formed hydrogen bonds with carbonyl groups in MPE. This premise is supported by the peak shift of aromatic C=C stretching of MPE from 1,581 to 1,577 cm−1 in MF3, to 1,508 cm−1 in the MF2 nanofiber mat, and to 1,493 cm−1 in the MF1 nanofiber mat. The peak shift of C=C stretching in the presence of PVP occurred as the result of decreased resonance of carbonyl-conjugated aromatic alkenes56 as the free carbonyl groups of MPE became hydrogen-bonded with hydroxyl groups of PVP. Considering that the glass transition point (Tg) of PVP is around 178°C,22 the PVP chains had sufficient rigidity to preserve this hydrogen bond-mediated intermolecular interaction under room temperature.57
XRD analysis
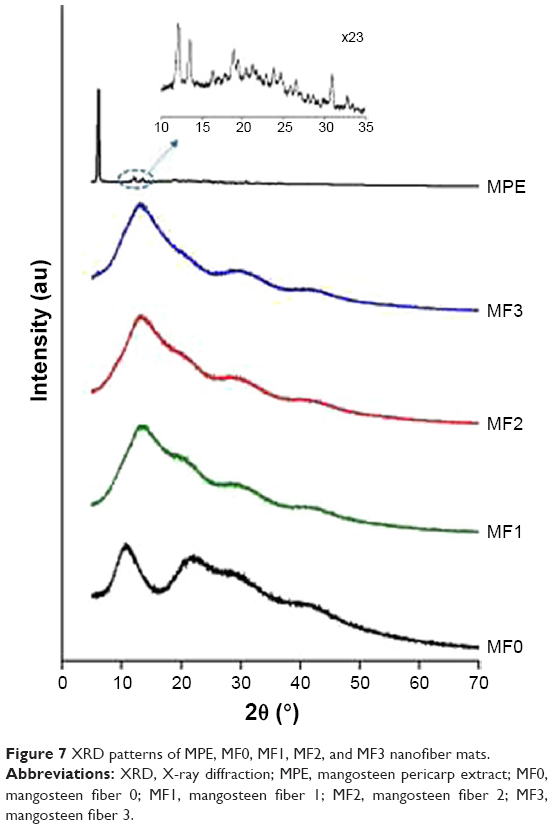
XRD patterns of the MPE, MF0, MF1, MF2, and MF3 nanofiber mats are shown in Figure 7. Using XPowder Ver.2004.04.70 PRO software, a typical diffraction pattern of MPE was found with intense peaks at 2θ of 5.99°, 11.62°, and 13.01°, indicating crystalline nature of MPE. The pattern and peaks exhibited by the MPE resemble those of mangosteen extract, despite slightly different 2θs (5.94°, 11.43°, and 12.69°).58 Due to the high abundance of α-mangostin content in the MPE, it was then thought that the diffraction pattern demonstrated by the MPE was originated from α-mangostin.45 Sharp and intense crystalline peaks in the MF1, MF2, and MF3 nanofiber mats were absent in the MF0 nanofiber mat. In contrast, two broad haloes were present at 2θs of 5° and40°. The second halo at 2θ of 22.72° was a shouldered peak with relatively lower intensity. The XRD pattern of the MF0 nanofiber mat clearly indicated amorphous PVP, as reported in the previous study.27
 | Figure 7 XRD patterns of MPE, MF0, MF1, MF2, and MF3 nanofiber mats. |
The XRD patterns of the MPE and PVP:MPE nanofiber mats suggested a crystalline-to-amorphous transformation of MPE, as indicated by the absence of crystalline peaks of the MPE in the MF1, MF2, and MF3 nanofiber mats. Note that PVP was reportedly capable of converting drug powder from crystalline state to amorphous state, particularly hydrophobic non-steroid anti-inflammatory drugs including indomethacin, ketoprofen, naproxen, and ibuproxam,59–62 in a binary system generated from co-milling, hot melt extrusion, or other mixing processes under a certain environment where PVP is in rubbery state (above the glass transition point, Tg).60–62 The degree of amorphization was dependent on the PVP content and the mechanism of amorphization involved loosening of crystal structure during exothermic mixing process, followed by dispersion in amorphous PVP chains and stabilization by intermolecular hydrogen bond between drug and PVP.62 Amorphization power of PVP is noteworthy, owing to its spherical amorphous shape.62 Below the Tg, PVP was able to induce amorphization of ibuprofen in a physical mixture over the storage time.60 In our study, conversion into amorphous state most probably occurred during the electrospinning process although the environment temperature was below the Tg of PVP. The applied voltage caused the drug/polymer solution to rapidly migrate from the needle tip to the collector. At the same time, the polymer underwent elongation along with solvent evaporation, resulting in solidification into a fiber.36 Within this extremely short time period, PVP and MPE molecules were incapable of rearranging their three-dimensional structure. As a result, the molecules were not highly ordered as in their crystalline state.
Our XRD study indicated molecular interactions between MPE and PVP, which strengthened the FTIR and DSC results. The XRD pattern of PVP was altered after being spun in a combination with MPE. The MPE nanofiber mats showed a broad halo instead of two haloes, peaking at 2θ of 13°–15°. Meanwhile, the characteristic halo of PVP at 2θ of 22.72° was not detected in the MF1, MF2, and MF3 nanofiber mats. This finding strengthened our presumption that MPE and MF0 (PVP) formed intermolecular interactions, particularly as hydrogen bonds, as explained in the FTIR studies.
Differential scanning calorimetry analysis
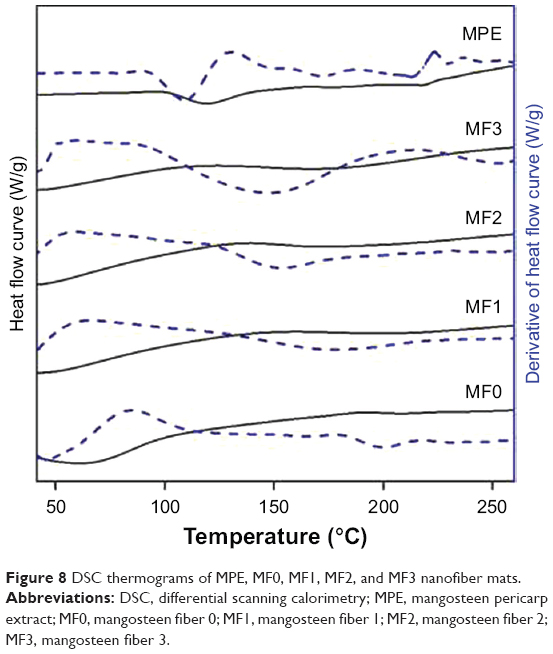
Figure 8 shows DSC thermograms of the MPE, MF0, MF1, MF2, and MF3 nanofiber mats. Three endothermic events were identified in MPE, peaking at 119°C, 177°C, and 218.1°C. The first endothermic peak was thought to originate from residual volatile compounds, mostly sesquiterpenes,63 since MPE was not exposed to temperature of >50°C throughout our study. The endothermic peaks at 177°C and 218.1°C indicated the melting point and decomposition of MPE, respectively, in which MPE was represented by the α-mangostin content. The DSC thermogram of PVP showed a broad endothermic event from 35°C to 100°C due to the evaporation of adsorbed moisture. Our thermogravimetric analysis showed that the weight loss of the MF0 nanofiber mat at 100°C was 3.6%. The Tg of PVP was not detected in the MF0, MF1, MF2, and MF3 nanofiber mats, which was attributed to mechanically induced stress during electrospinning process.22
 | Figure 8 DSC thermograms of MPE, MF0, MF1, MF2, and MF3 nanofiber mats. |
The DSC thermogram of the MF1, MF2, and MF3 nanofiber mats were similar except that the endothermic event taking place at 199.3°C in the MF1 nanofiber mat occurred at lower temperatures when the amount of MPE was increased, being 173.8°C in the MF2 nanofiber mat and 167.7°C in the MF3 nanofiber mat. These peaks were extremely broad, resembling a diffusion of melting points of MPE and PVP. Characteristic crystalline peaks of the MPE were unable to observe in the MF1, MF2, and MF3 nanofiber mats, most probably due to the condition where electrospinning process of the MPE:PVP solution inhibited the recrystallization of α-mangostin.45 Moreover, the appearance of a single broad halo instead of fusion endotherms indicated complete amorphization.62 The decrease in crystallinity of α-mangostin was also confirmed in the XRD analysis.
In vitro antioxidant activity
Antioxidant activity was detected in all MPE:PVP nanofiber mats (MF1, MF2, and MF3 nanofiber mats). The color of DPPH solution changed from purple to yellow after being reacted with MPE:PVP mats, indicating the quenching of DPPH free radicals by hydrogen donor groups in MPE:PVPV and, eventually, the formation of a stable compound.64,65 The hydrogen donor groups from α-mangostin, most commonly hydroxyl groups, play a fundamental role in scavenging the free radicals. The extent of antioxidant activity in this study was described by an IC50 value.43,66–68 A very strong antioxidant will have an IC50 value between 1 and 50 μg/mL, while strong antioxidant and moderate antioxidant will demonstrate IC50 values in 50–100 and 101–150 μg/mL range, respectively. IC50 value of ≥150 μg/mL indicates weak antioxidant activity.67,68
The IC50 values of the MPE, MF1, MF2, and MF3 nanofiber mats were compared to ascorbic acid as the reference for antioxidant activity (Table 2). It is clear that the MF3 nanofiber mat had the strongest antioxidant activity among the nanofiber mats as shown by its lower IC50 value. Surprisingly, the antioxidant activity of MPE in the MF1, MF2, and MF3 nanofiber mats were stronger than the pure MPE. These findings suggest that the antioxidant activity of MPE was enhanced due to the nanostructure offered by the nanofiber mats. In nanofiber form, α-mangostin particles, in nanometer size, are distributed in a matrix with very high surface area.69 As a result, the number of α-mangostin particles that can be released at a given time is significantly higher, and thus, α-mangostin can quench the free radicals more effectively. Our findings show that the stability of the biologically active compounds in MPE can still be maintained during the electrospinning process. Our previous study showed a similar report, in which the antioxidant activity of MPE was not weakened by the electrospinning process, despite the use of high voltage for a long period.67
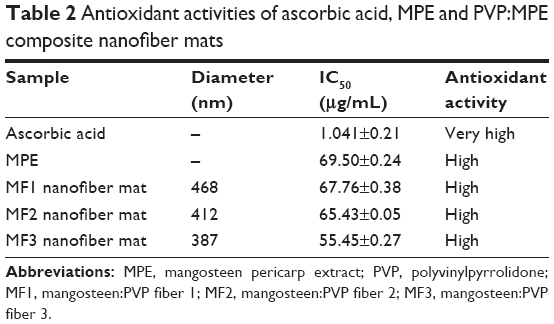 | Table 2 Antioxidant activities of ascorbic acid, MPE and PVP:MPE composite nanofiber mats |
In vitro release study
α-Mangostin possesses limited aqueous solubility20 yet good intestinal absorption,70 which means that solubility of α-mangostin is the rate-limiting step. We attempted to increase the release rate of α-mangostin by incorporating MPE into nano-sized fibers, presuming that there would be higher fraction of dissolved α-mangostin readily absorbed by the intestinal membrane at given time. The release study was adapted from standard protocol of dissolution test for immediate-release drug dosage form with modifications. Until recently, there is no single standardized method for release or dissolution study of drug from nano-sized dosage form.71 However, this release study can be a predictive tool to investigate the release behavior, an important biopharmaceutical aspect of nanoparticulate delivery system.
Earlier, we intended to investigate pH-dependence of α-mangostin release by studying the release rate in two different media: acidic (pH 1.2) and basic (pH 6.8). However, α-mangostin was not detected when acidic medium (pH 1.2) was used. The phosphate-buffered solution (pH 6.8) was chosen since the pH mimics the small intestine environment, the region of gastrointestinal tract where most xanthones can be absorbed.72 The amount of α-mangostin released from the three nanofiber preparations and pure MPE was carried out in phosphate buffer pH 6.8 at 37°C for 2 hours. The release profiles are shown in Figure 9. Overall, the release of α-mangostin from the MF1, MF2, and MF3 nanofiber mats exhibited triphasic pattern. In such pattern, extremely high release rate or burst release effect takes place in the first phase as the result of accumulation of drug molecules on the surface of the polymeric-based system. The second phase, which is identified by a slower release rate, generally indicates drug release via mild polymer degradation or chain scission.73,74 Finally, as the polymer is continuously hydrated, water can eventually reach the fiber further and bulk erosion occurs. The time required to reach bulk erosion makes the release rate slower than those in the prior phases.73,75,76 The multi-phase release pattern was typical of small-molecule release from a polymeric matrix, and this was not related to the overall release rate. In fact, release rate of α-mangostin was improved by incorporation into nanofiber, being three times higher than α-mangostin release from pure MPE.
 | Figure 9 The release profile of α-mangostin from MPE:PVP (MF1, MF2, and MF3) nanofiber mats and pure MPE at pH 6.8. |
As seen in Figure 9, it is clear that α-mangostin release from the pure MPE was lower in comparison with those of the MF1, MF2, and MF3 nanofiber mats. Less than 35% of α-mangostin was released from the pure MPE over 60 minutes. Meanwhile, α-mangostin in the nanofiber mats was immediately released with 90% average cumulative percentage in 60 minutes. It is clear that encapsulation of MPE into PVP-based nanofibers, regardless the ratio of MPE:PVP, has improved the rate of α-mangostin release dramatically. This indicated that the release enhancement was not only due to improvement of surface hydrophilicity by PVP.77
The nature of nanofibers, where the surface area at a given volume is very high, played significant role for release rate enhancement of α-mangostin. This finding is in accordance with the Nernst–Brunner equation:
|
|
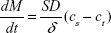
where dM/dt is the amount of drug dissolved at given time, S is the surface area, D is the diffusion coefficient, cs and ct denote the solubility of the drug and concentration of drug dissolved in the aqueous medium, respectively, and δ is the thickness of diffusion layer.78 With an extremely high surface area in nanofiber, water can easily penetrate and then release α-mangostin from the fiber matrix. In addition, with the high surface area, more particles of MPE would reside on the surface of nanofibers and ready to be released. The release mechanism due to hydrophilic characteristic of PVP is suggested through diffusion79 as the release kinetic followed first-order model. The release kinetic is described in the next section.
Our XRD and DSC studies indicated that conversion of MPE from crystalline state to amorphous state was due to electrospinning process. This can be another explanation for the rapid release of α-mangostin because an amorphous drug tends to have higher release rate. In amorphous state, the molecular interaction is relatively weaker and the molecular arrangement is rather irregular in comparison with crystalline state.80,81 Consequently, amorphous α-mangostin contained in the MF1, MF2, and MF3 nanofiber mats can be dissolved more rapidly, and thus, α-mangostin tends to diffuse out into the release medium on a higher rate.
The release rate of α-mangostin was found to be higher in nanofibers with smaller diameters. As shown in Figure 9, the MF3 and MF2 nanofiber mats with respective diameters of 387 and 412 nm released 100% of α-mangostin within 60 minutes. Meanwhile, the MF1 nanofiber mat with a higher diameter of 468 nm only released 90% of α-mangostin over similar period. These results could be explained as follows. It was reported that polymer chains with smaller fibers have higher rate of absorbance of the molecules of solvent.40,82 Thus, it enlarges the volume of the polymer matrix which then allows the coil of polymer chains to be less tight, in which the PVP nanofibers reach a swollen state. As a result, the solvent can reach α-mangostin particles and dissolve them more easily. The dissolved α-mangostin can then immediately diffuse out of the matrix.
Release kinetics
A number of kinetic models represent release mechanisms of a certain drug from a certain matrix; zero-order, first-order, Higuchi, and Hixson–Crowell are examples of those kinetic models.45–47 To study the release mechanism of α-mangostin from the fibers, release patterns were fitted to those five models based on R-square value (Table 3). In vitro release of α-mangostin from the pure MPE followed the zero-order kinetic model, but it followed the first-order one when formulated into nanofibers. This means that the release of active compound in nanofibers was mainly controlled by drug concentration. In contrast, the release of α-mangostin from the pure MPE was concentration-independent. However, the release kinetic model of the MF1, MF2, and MF3 nanofiber mats also fitted well with the Hixson–Crowell model. This indicated that changes in surface area and diameter of matrix contributed for the release mechanism.46,83,84
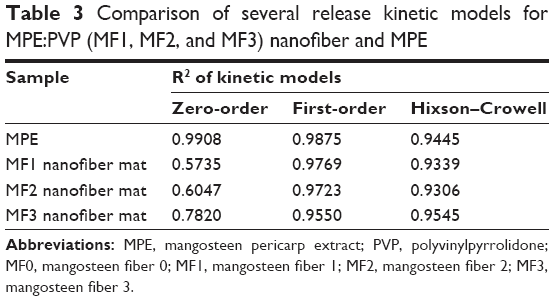 | Table 3 Comparison of several release kinetic models for MPE:PVP (MF1, MF2, and MF3) nanofiber and MPE |
The Hixson–Crowell kinetic model considers that 1) the mass of dissolved compound does not significantly change with time, 2) the dissolving particles are spherical and do not change with time, and 3) the particles do not disintegrate into several fragments during dissolution.85 As illustrated in Figure 9, the release rates of α-mangostin from the MF1, MF2, and MF3 nanofiber mats were significantly high in the first 20 minutes, but dropped quickly afterwards. Despite the presumed mechanism of triphasic release which was thought to be facilitated by drug accumulation on the matrix surface, polymer chain scission and bulk erosion,77,79 another possibility should be taken into consideration. This is because the first-order kinetic is based on the following assumptions: 1) the matrix is a non-swelling compound and 2) the matrix remains intact throughout the release process.86
In the previous study, it was found that the solid dispersion of ketoconazole/PVP nanoparticles grew into micrometer-sized particles during dissolution study.87 Therefore, it is also possible that the α-mangostin molecules, which have been released from the nanofiber mat during the first phase of release (ie, >60% in the first 20 minutes), undergo supersaturation and precipitate into nanoparticles. The nanoparticles were subjected to nucleation and thus particle growth occurred. This event might result in a decreased release rate in the subsequent phase, where the amount of released α-mangostin was <30% from 20 to 60 minutes.
Conclusion
Bead-free nanofibers were successfully synthesized from electrospinning of MPE:PVP solution. Size controlling was achieved by adjusting the viscosity and conductivity of precursor solution. Higher MPE content in the precursor solution lowered the viscosity while increased the conductivity. The SEM analysis revealed that the size of the nanofiber decreased as the MPE:PVP ratio was increased. However, the morphology of MPE:PVP nanofibers was identical in all preparations regardless the MPE content, confirming the excellent spinnability of PVP. Findings of the FTIR and DSC analyses suggested hydrogen-bond formation between MPE and PVP although PVP still retained its hygroscopic property. Crystalline-to-amorphous transformation was evident, as verified in the XRD study. α-Mangostin in the MPE:PVP nanofibers performed better radical scavenging and had significantly higher release rate in comparison with the pure MPE, as confirmed in antioxidant assay and in vitro release study. Enhanced antioxidant activity and release rate of α-mangostin from the MPE:PVP nanofibers was facilitated by high surface area of the nanofiber network. The mechanism of α-mangostin release from the MPE:PVP nanofibers was dependent on drug concentration and particle size since the release kinetic followed the first-order model as well as the Hixson–Crowell model. With the improvement of antioxidant activity and release rate, MPE:PVP nanofiber mats can potentially improve the clinical outcomes offered by MPE.
Acknowledgment
This research was financially supported by the Directorate of Research and Community Engagement of Ministry of Research, Technology and Higher Education, Republic of Indonesia under the University’s Excellence Research (PUPT) Grant in the fiscal year 2016–2017.
Disclosure
The authors report no conflicts of interest in this work.
References
Kosem N, Ichikawa K, Utsumi H, Moongkarndi P. In vivo toxicity and antitumor activity of mangosteen extract. J Nat Med. 2013;67:255–263. | ||
Moongkarndi P, Kosem N, Kaslungka S, Luanratana O, Pongpan N, Neungton N. Antiproliferation, antioxidation and induction of apoptosis by Garcinia mangostana (mangosteen) on SKBR3 human breast cancer cell line. J Ethnopharmacol. 2004;90(1):161–166. | ||
Wang JJ, Sanderson BJ, Zhang W. Cytotoxic effect of xanthones from pericarp of the tropical fruit mangosteen (Garcinia mangostana Linn.) on human melanoma cells. Food Chem Toxicol. 2011;49:2385–2391. | ||
Chin Y-W, Jung H-A, Chai H, Keller WJ, Kinghorn AD. Xanthones with quinone reductase-inducing activity from the fruits of Garcinia mangostana (mangosteen). Phytochemistry. 2008;69:754–758. | ||
Akao Y, Nakagawa Y, Linuma M, Nozawa Y. Anti-cancer effects of xanthones from pericarps of mangosteen. Int J Mol Sci. 2008;9:355–370. | ||
Pedraza-Chaverri J, Cárdenas-Rodríguez N, Orozco-Ibarra M, Pérez-Rojas JM. Medicinal properties of mangosteen (Garcinia mangostana). Food and Chem Toxicol. 2008;46:3227–3239. | ||
Hemshekhar M, Sunitha K, Santhosh MS, et al. An overview on genus Garcinia: phytochemical and therapeutical aspects. Phytochem Rev. 2011;10:325–351. | ||
Han A-R, Kim J-A, Lantvit DD, et al. Cytotoxic xanthone constituents of the stem bark of Garcinia mangostana (mangosteen). J Nat Prod. 2009;72:2028–2031. | ||
Kondo M, Zhang L, Ji H, Kou Y, Ou B. Bioavailability and antioxidant effects of a xanthone-rich mangosteen (Garcinia mangostana) product in humans. J Agric Food Chem. 2009;57:8788–8792. | ||
Yu L, Zhao M, Yang B, Zhao Q, Jiang Y. Phenolics from hull of Garcinia mangostana fruit and their antioxidant activities. Food Chem. 2007;104:176–181. | ||
Ibrahim MY, Hashim NM, Mariod AA, et al. α-Mangostin from Garcinia mangostana Linn: an updated review of its pharmacological properties. Arab J Chem. 2014;9:317–329. | ||
Palakawong C, Sophanodora P, Pisuchpen S, Phongpaichit S. Antioxidant and antimicrobial activities of crude extracts from mangosteen (Garcinia mangostana L.) parts and some essential oils. Int Food Res J. 2010;17:583–589. | ||
Al-Massarani SM, El Gamal AA, Al-Musayeib NM, et al. Phytochemical, antimicrobial and antiprotozoal evaluation of Garcinia mangostana pericarp and α-mangostin, its major xanthone derivative. Molecules. 2013;18:10599–10608. | ||
Arunrattiyakorn P, Suksamrarn S, Suwannasai N, Kanzaki H. Microbial metabolism of α-mangostin isolated from Garcinia mangostana L. Phytochemistry. 2011;72:730–734. | ||
Chen L-G, Yang L-L, Wang C-C. Anti-inflammatory activity of mangostins from Garcinia mangostana. Food Chem Toxicol. 2008;46:688–693. | ||
Gutierrez-Orozco F, Chitchumroonchokchai C, Lesinski GB, Suksamrarn S, Failla ML. α-Mangostin: anti-inflammatory activity and metabolism by human cells. J Agric Food Chem. 2013;61:3891–3900. | ||
Liu S-H, Lee L-T, Hu N-Y, et al. Effects of alpha-mangostin on the expression of anti-inflammatory genes in U937 cells. Chin Med. 2012;7:19. | ||
Shibata M-A, Iinuma M, Morimoto J, et al. α-Mangostin extracted from the pericarp of the mangosteen (Garcinia mangostana Linn) reduces tumor growth and lymph node metastasis in an immunocompetent xenograft model of metastatic mammary cancer carrying a p53 mutation. BMC Med. 2011;9:69. | ||
Johnson JJ, Petiwala SM, Syed DN, et al. α-Mangostin, a xanthone from mangosteen fruit, promotes cell cycle arrest in prostate cancer and decreases xenograft tumor growth. Carcinogenesis. 2012;33:413–419. | ||
Ahmad M, Yamin BM, Lazim AM. A study on dispersion and characterisation of α-mangostin loaded pH sensitive microgel systems. Chem Cent J. 2013;7:85. | ||
Aisha AF, Ismail Z, Abu-Salah KM, Majid AMSA. Solid dispersions of α-mangostin improve its aqueous solubility through self-assembly of nanomicelles. J Pharm Sci. 2012;101:815–825. | ||
Rahma A, Munir MM, Khairurrijal K, Prasetyo A, Suendo V, Rachmawati H. Intermolecular interactions and the release pattern of electrospun curcumin-polyvinyl(pyrrolidone) fiber. Biol Pharm Bull. 2016;39:163–173. | ||
Kumar M. Nano and microparticles as controlled drug delivery devices. J Pharm Pharm Sci. 2000;3:234–258. | ||
Soppimath KS, Aminabhavi TM, Kulkarni AR, Rudzinski WE. Biodegradable polymeric nanoparticles as drug delivery devices. J Control Release. 2001;70:1–20. | ||
Agnihotri SA, Mallikarjuna NN, Aminabhavi TM. Recent advances on chitosan-based micro-and nanoparticles in drug delivery. J Control Release. 2004;100:5–28. | ||
Kumari A, Yadav SK, Yadav SC. Biodegradable polymeric nanoparticles based drug delivery systems. Colloids Surf B Biointerfaces. 2010;75:1–18. | ||
Rasekh M, Karavasili C, Soong YL, et al. Electrospun PVP-indomethacin constituents for transdermal dressings and drug delivery devices. Int J Pharm. 2014;473:95–104. | ||
Rathinamoorthy R. Nanofiber for drug delivery system. Pak Text J. 2012;61:45–48. | ||
Hu X, Liu S, Zhou G, Huang Y, Xie Z, Jing X. Electrospinning of polymeric nanofibers for drug delivery applications. J Control Release. 2014;185:12–21. | ||
Bhandari J, Mishra H, Mishra PK, Wimmer R, Ahmad FJ, Talegaonkar S. Cellulose nanofiber aerogel as a promising biomaterial for customized oral drug delivery. Int J Nanomedicine. 2017;12:2021–2031. | ||
Son YJ, Kim WJ, Yoo HS. Therapeutic applications of electrospun nanofibers for drug delivery systems. Arch Pharm Res. 2014;37:69–78. | ||
Yoo HS, Kim TG, Park TG. Surface-functionalized electrospun nanofibers for tissue engineering and drug delivery. Adv Drug Deliv Rev. 2009;61:1033–1042. | ||
Shen X, Yu D, Zhu L, Branford-White C, White K, Chatterton NP. Electrospun diclofenac sodium loaded Eudragit® L 100-55 nanofibers for colon-targeted drug delivery. Int J Pharm. 2011;408:200–207. | ||
Sriyanti I, Edikresnha D, Munir MM, Rachmawati H, Khairurrijal K. Electrospun polyvinylpyrrolidone (PVP) nanofiber mats loaded by Garcinia mangostana L. extracts. Mater Sci Forum. 2017;880:11–14. | ||
Munir MM, Iskandar F, Khairurrijal K, Okuyama K. A constant-current electrospinning system for production of high quality nanofibers. Rev Sci Instrum. 2008;79:4–7. | ||
Ramakrishna S, Fujihara K, Teo WE, Lim TC, Ma Z. An Introduction to Electrospinning and Nanofibers. Singapura: World Scientific Publishing Company. 2005:1–396. | ||
Huang S, Zhou L, Zhou D. Preparation and properties of electrospun poly(vinyl pyrrolidone)/cellulose nanocrystal/silver nanoparticle composite fibers. Materials. 2016;9:523. | ||
Opanasopit P, Ruktanonchai U, Suwantong O, et al. Electrospun poly(vinyl alcohol) fiber mats as carriers for extracts from the fruit hull of mangosteen. J Cosmet Sci. 2008;59:233–242. | ||
Charernsriwilaiwat N, Rojanarata T, Ngawhirunpat T, Sukma M, Opanasopit P. Electrospun chitosan-based nanofiber mats loaded with Garcinia mangostana extracts. Int J Pharm. 2013;452:333–343. | ||
Yu D-G, Shen X-X, Branford-White C. Oral fast-dissolving drug delivery membranes prepared from electrospun polyvinylpyrrolidone ultrafine fibers. Nanotechnology. 2009;20:055104. | ||
Dai XY, Nie W, Wang YC, Shen Y, Li Y, Gan SJ. Electrospun emodin polyvinylpyrrolidone blended nanofibrous membrane: a novel medicated biomaterial for drug delivery and accelerated wound healing. J Mater Sci. 2012;23:2709–2716. | ||
Bonan RF, Bonan PR, Batista AU, et al. In vitro antimicrobial activity of solution blow spun poly (lactic acid)/polyvinylpyrrolidone nanofibers loaded with Copaiba (Copaifera sp.) oil. Mater Sci Eng C. 2015;48:372–377. | ||
Blois M. Antioxidant determinations by the use of a stable free radical. Nature. 1958;181:1199–1200. | ||
Deo P, Hewawasam E, Karakoulakis A, et al. In vitro inhibitory activities of selected Australian medicinal plant extracts against protein glycation, angiotensin converting enzyme (ACE) and digestive enzymes linked to type II diabetes. BMC Complement Altern Med. 2016;16:435. | ||
Samprasit W, Rojanarata T, Akkaramongkolporn P, Ngawhirunpat T, Kaomongkolgit R, Opanasopit P. Fabrication and in vitro/in vivo performance of mucoadhesive electrospun nanofiber mats containing alpha-mangostin. AAPS PharmSciTech. 2015;16:1140–1152. | ||
Singhvi G, Singh S. Review: in-vitro drug release characterization models. Int J Pharm Stud Res. 2011;2:77–84. | ||
Costa P, Lobo JMS. Modeling and comparison of dissolution profiles. Eur J Pharm Sci. 2001;13:123–133. | ||
Thong NM, Quang DT, Bui NHT, Dao DQ, Nam PC. Antioxidant properties of xanthones extracted from the pericarp of Garcinia mangostana (mangosteen): a theoretical study. Chem Phys Lett. 2015;625:30–35. | ||
Doi M, Edwards SF. The Theory of Polymer Dynamics. Oxford: Clarendon Press; 2009:140–143. | ||
Fong H, Chun I, Reneker D. Beaded nanofibers formed during electrospinning. Polymer. 1999;40:4585–4592. | ||
Tan S, Inai R, Kotaki M, Ramakrishna S. Systematic parameter study for ultra-fine fiber fabrication via electrospinning process. Polymer. 2005;46:6128–6134. | ||
Ghazali SIS, Lian GE, Abd Ghani KD. Chemical constituent from roots of Garcinia mangostana (Linn.). Int J Chem. 2010;2:134–142. | ||
Aminah LN, Leong ST, Wong YS, Ong SA, Kairulazam CK. Biodiesel production of Garcinia mangostana Linn seeds by two-phase solvent extraction and alkali-catalyzed transesterification. Int J Chem Eng Appl. 2013;4:3–6. | ||
Vijaya N, Selvasekarapandian S, Hirankumar G, et al. Structural, vibrational, thermal, and conductivity studies on proton-conducting polymer electrolyte based on poly (N-vinylpyrrolidone). Ionics. 2012;18:91–99. | ||
Borodko Y, Habas SE, Koebel M, Yang P, Frei H, Somorjai GA. Probing the interaction of poly (vinylpyrrolidone) with platinum nanocrystals by UV- Raman and FTIR. J Phys Chem B. 2006;110:23052–23059. | ||
Robinson JW, Frame ES, Frame GM II. Undergraduate Instrumental Analysis. Florida: CRC Press; 2014. | ||
Imamura K, Asano Y, Maruyama Y, et al. Characteristics of hydrogen bond formation between sugar and polymer in freeze-dried mixtures under different rehumidification conditions and its impact on the glass transition temperature. J Pharm Sci. 2008;97:1301–1312. | ||
Samprasit W, Akkaramongkolporn P, Ngawhirunpat T, Rojanarata T, Kaomongkolgit R, Opanasopit P. Fast releasing oral electrospun PVP/CD nanofiber mats of taste-masked meloxicam. Int J Pharm. 2015;487:213–222. | ||
Cirri M, Mura P, Rabasco A, Gines J, Moyano J, Gonzalez-Rodriguez M. Characterization of ibuproxam binary and ternary dispersions with hydrophilic carriers. Drug Dev Ind Pharm. 2004;30:65–74. | ||
Ivanov IT, Tsokeva Z. Effect of chirality on PVP/drug interaction within binary physical mixtures of ibuprofen, ketoprofen, and naproxen: a DSC study. Chirality. 2009;21:719–727. | ||
Lim RTY, Ng WK, Tan RB. Dissolution enhancement of indomethacin via amorphization using co-milling and supercritical co-precipitation processing. Powder Technol. 2013;240:79–87. | ||
Zerrouk N, Mennini N, Maestrelli F, Chemtob C, Mura P. Comparison of the effect of chitosan and polyvinylpyrrolidone on dissolution properties and analgesic effect of naproxen. Eur J Pharm Biopharm. 2004;57:93–99. | ||
MacLeod AJ, Pieris NM. Volatile flavour components of mangosteen (Garcinia mangostana). Phytochemistry. 1982;21:117–119. | ||
Suttirak W, Manurakchinakorn S. In vitro antioxidant properties of mangosteen peel extract. J Food Sci Technol. 2012;12:3546–3558. | ||
Moongkarndi P, Jaisupa N, Samer J, et al. Comparison of the biological activity of two different isolates from mangosteen. J Pharm Pharmacol. 2014;66:1171–1179. | ||
Nsimba RY, Kikuzaki H, Konishi Y. Antioxidant activity of various extracts and fractions of Chenopodium quinoa and Amaranthus spp. seeds. Food Chem. 2008;106:760–766. | ||
Sriyanti I, Edikresnha D, Rahma A, Munir MM, Rachmawati H, Khairurrijal K. Correlation between structures and antioxidant activities of polyvinylpyrrolidone/Garcinia mangostana L. extract composite nanofiber mats prepared using electrospinning. J Nanomater. 2017;2017:9687896. | ||
Fidrianny I, Natalia S, Insanu M. Antioxidant capacities of various fruit extracts from three varieties of tomato and correlation with total phenolic, flavonoid, carotenoid content. Int J Pharm Clin Res. 2015;7:283–289. | ||
Huang ZM, Zhang YZ, Kotaki M, Ramakrishna SA. Review on polymer nanofibers by electrospinning and their applications in nanocomposites. Compos Sci Technol. 2003;63:2223–2253. | ||
Choi YH, Han SY, Kim Y-J, Kim Y-M, Chin Y-W. D Absorption, tissue distribution, tissue metabolism and safety of α-mangostin in mangosteen extract using mouse models. Food Chem Toxicol. 2014;66:140–146. | ||
Shen J, Burgess DJ. In vitro dissolution testing strategies for nanoparticulate drug. Drug Deliv Transl Res. 2013;3:409–415. 72.Gutierrez-Orozco F, Failla ML. Biological activities and bioavailability of mangosteen xanthones: a critical review of the current evidence. Nutrients. 2013;5:3163–3183. | ||
Fu Y, Kao WJ. Drug release kinetics and transport mechanisms of non-degradable and degradable polymeric delivery systems. Expert Opin Drug Deliv. 2010;7:429–444. | ||
Holowka E, Bhatia SK. Drug Delivery: Materials Design and Clinical Perspective. New York: Springer; 2014. | ||
Grizzi I, Garreau H, Li S, Vert M. Hydrolytic degradation of devices based on poly (DL-lactic acid) size-dependence. Biomaterials. 1995;16:305–311. | ||
Von Burkersroda F, Schedl L, Göpferich A. Why degradable polymers undergo surface erosion or bulk erosion. Biomaterials. 2002;23:4221–4231. | ||
Li X-Y, Wang X, Yu D-G, et al. Electrospun borneol-PVP nanocomposites. J Nanomater. 2012;2012:731382. | ||
Brunner E. Reaktionsgeschwindigkeit in heterogenen Systemen. Z. J Phys Chem. 1904;47:56–102. | ||
Karavas E, Georgarakis E, Sigalas MP, Avgoustakis K, Bikiaris D. Investigation of the release mechanism of a sparingly water-soluble drug from solid dispersions in hydrophilic carriers based on physical state of drug, particle size distribution and drug–polymer interactions. Eur J Pharm Biopharm. 2007;66:334–347. | ||
Meng F, Trivino A, Prasad D, Chauhan H. Investigation and correlation of drug polymer miscibility and molecular interactions by various approaches for the preparation of amorphous solid dispersions. Eur J Pharm Sci. 2015;71:12–24. | ||
Baghel S, Cathcart H, O’Reilly NJ. Polymeric amorphous solid dispersions: a review of amorphization, crystallization, stabilization, solid-state characterization, and aqueous solubilization of biopharmaceutical classification system class II drugs. J Pharm Sci. 2016;105:2527–2544. | ||
Yu DG, Wang X, Li XY, Chian W, Li Y, Liao YZ. Electrospun biphasic drug release polyvinylpyrrolidone/ethyl cellulose core/sheath nanofibers. Acta Biomater. 2013;9:5665–5672. | ||
Rao KS, Nagabhushanam M, Chowdary K. In vitro dissolution studies on solid dispersions of mefenamic acid. Indian J Pharm Sci. 2011;73:243. | ||
Risdian C, Nasir M, Rahma A, Rachmawati H. The influence of formula and process on physical properties and the release profile of PVA/BSA nanofibers formed by electrospinning technique. J Nano Res. 2015;31:103–116. | ||
Siepmann J, Siepmann F. Mathematical modeling of drug dissolution. Int J Pharm. 2013;30:12–24. | ||
Mulye N, Turco S. A simple model based on first order kinetics to explain release of highly water soluble drugs from porous dicalcium phosphate dihydrate matrices. Drug Dev Ind Pharm. 1995;21:943–953. | ||
Kanaujia P, Lau G, Ng WK, et al. Nanoparticle formation and growth during in vitro dissolution of ketoconazole solid dispersion. J Pharm Sci. 2011;100:2876–2885. |
 © 2018 The Author(s). This work is published and licensed by Dove Medical Press Limited. The
full terms of this license are available at https://www.dovepress.com/terms
and incorporate the Creative Commons Attribution
- Non Commercial (unported, 3.0) License.
By accessing the work you hereby accept the Terms. Non-commercial uses of the work are permitted
without any further permission from Dove Medical Press Limited, provided the work is properly
attributed. For permission for commercial use of this work, please see paragraphs 4.2 and 5 of our Terms.
© 2018 The Author(s). This work is published and licensed by Dove Medical Press Limited. The
full terms of this license are available at https://www.dovepress.com/terms
and incorporate the Creative Commons Attribution
- Non Commercial (unported, 3.0) License.
By accessing the work you hereby accept the Terms. Non-commercial uses of the work are permitted
without any further permission from Dove Medical Press Limited, provided the work is properly
attributed. For permission for commercial use of this work, please see paragraphs 4.2 and 5 of our Terms.