Back to Journals » Cancer Management and Research » Volume 13
Malignancy Risk Stratification Prediction of Amorphous Calcifications Based on Clinical and Mammographic Features
Authors Shen L, Ma X, Jiang T, Shen X, Yang W, You C ![]() , Peng W
, Peng W
Received 13 October 2020
Accepted for publication 17 December 2020
Published 12 January 2021 Volume 2021:13 Pages 235—245
DOI https://doi.org/10.2147/CMAR.S286269
Checked for plagiarism Yes
Review by Single anonymous peer review
Peer reviewer comments 2
Editor who approved publication: Dr Eileen O'Reilly
Lijuan Shen,1,2,* Xiaowen Ma,2,3,* Tingting Jiang,2,3 Xigang Shen,2,3 Wentao Yang,3,4 Chao You,2,3 Weijun Peng2,3
1Shanghai Institute of Medical Imaging, Shanghai, People’s Republic of China; 2Department of Radiology, Fudan University Shanghai Cancer Center, Shanghai, People’s Republic of China; 3Department of Oncology, Fudan University Shanghai Cancer Center, Shanghai, People’s Republic of China; 4Department of Pathology, Fudan University Shanghai Cancer Center, Shanghai, People’s Republic of China
*These authors contributed equally to this work
Correspondence: Weijun Peng; Chao You
Fudan University Shanghai Cancer Center, No. 270, Dongan Road, Xuhui District, Shanghai 200032, People’s Republic of China
Tel +86-15026544096
; +86-21-64175590
Fax +86-21-64174774
Email [email protected] : [email protected]
Purpose: To explore the potential factors influencing the malignancy risk of amorphous calcifications and establish a predictive nomogram for malignancy risk stratification.
Patients and Methods: Consecutive mammograms from January 2013 to December 2018 were retrospectively reviewed. Traditional clinical features were recorded, and mammographic features were estimated according to the 5th BI-RADS. Included calcifications were randomly divided into the training and validation cohorts. A nomogram was developed to graphically predict the risk of malignancy (risk) based on stepwise multivariate logistic regression analysis. The discrimination and calibration performance of the model were assessed in both the training and validation cohorts.
Results: Finally, 1018 amorphous calcifications with final pathological results in 907 women were identified with a malignancy rate of 28.4% (95% CI: 25.7%, 31.3%). The malignancy rates of subgroups divided by the distribution of calcifications, quantity of calcifications, age, menopausal status and family history of cancer were significantly different. There were 712 cases and 306 cases in the training and validation cohorts. The prediction nomogram was finally developed based on four risk factors, including age and distribution, maximum diameter and quantity of calcifications. The AUC of the nomogram was 0.799 (95% CI: 0.761, 0.836) in the training cohort and 0.795 (95% CI: 0.738, 0.852) in the validation cohort.
Conclusion: On mammography, the distribution, maximum diameter and quantity of calcifications are independent predictors of malignant amorphous calcifications and can be easily obtained in the clinic. The nomogram developed in this study for individualized malignancy risk stratification of amorphous calcifications shows good discrimination performance.
Keywords: breast cancer, mammography, calcifications, malignancy risk stratification, nomogram
Introduction
Breast cancer has become the most common malignant tumor in women worldwide, and early diagnosis and breast screening are very important to improve prognosis.1 Calcifications are an important early sign of breast cancer, and mammography is the main screening method that is sensitive to calcifications.2 Amorphous was one of the suspicious morphologies of calcifications categorized by the 5th edition of the Breast Imaging Reporting and Data System (BI-RADS), defined as relatively small and fuzzy calcifications with diameters less than 0.5 mm and was recommended as category 4B with a positive predictive value (PPV) of approximately 20%.3
Currently, several studies4–7 have suggested that not all amorphous calcifications require a biopsy. Especially for grouped amorphous calcifications found by screening mammograms, biopsy may lead to false positives and overdiagnosis. Even though malignant results are mostly ductal carcinoma in situ (DCIS), biopsy has little effect on prognosis. The comprehensive management of amorphous calcifications may reduce the biopsies of benign lesions. Therefore, how to predict the malignancy risk of calcifications more accurately has become an urgent problem to be solved.
A nomogram is a statistical method that can represent a prediction model in a simple graph and can be easily applied in the clinic.8 Previous studies have shown that this method could be used to predict malignant calcifications.9–11 However, the above studies focused on all kinds of breast calcifications, and there was no specific discussion on amorphous calcifications. Thus, the objective of this study was to explore the potential influencing factors of the malignancy risk of amorphous calcifications and establish a nomogram for individualized malignancy risk stratification.
Patients and Methods
Study Population
This retrospective study was approved by the medical ethics committee of Fudan University Shanghai Cancer Center (approval number: 1507149-8), and the informed consent requirement was waived because the study was retrospective and the data were anonymized. We also have complied with the World Medical Association Declaration of Helsinki regarding the ethical conduct of research involving human subjects. In our institution, all amorphous calcifications except those in diffuse distribution are assessed as BIRADS 4A or higher and recommend tissue diagnosis. Female patients with amorphous calcifications on mammography who obtained accurate pathological results between January 2013 and December 2018 were included, and 2453 groups of amorphous calcifications were retrospectively reviewed. The exclusion criteria were as follows: (1) with masses or other suspicious signs (n=1236); (2) invasive examinations (such as biopsy or surgery) performed within 6 months before mammography (n=160); and (3) only shown on one view (n=32). A total of 1025 groups of pure amorphous calcifications were included. Because we could not determine the scope of diffuse calcifications on images corresponding to pathological results, 7 diffuse distribution groups were excluded. Finally, 1018 groups of amorphous calcifications in 907 female patients (93 patients had two groups, and 9 patients had three groups) were estimated.
Data Analysis
All mammograms were analyzed and interpreted based on the 5th edition of BI-RADS by two radiologists with 10 and 14 years of experience in breast imaging who were blinded to the pathological results. They evaluated the breast composition categories, distribution of calcifications (1 grouped, 2 segmental, 3 regional), quantity of the groups of calcifications (abbreviated as quantity, classified as 1 single, 2 multiple unilateral and 3 multiple bilateral) and BI-RADS category together and negotiated for one assessment. The maximum diameters of the group of calcifications (abbreviated as MD) were measured in the two views, and the larger diameter was recorded. When there were different opinions, another reader with more experience (25 years) analyzed the images and discussed the findings with first the two readers to reach a consensus for the final assessment.
Clinical and histopathologic features were also obtained from medical records, including age, menopausal status, purpose of examination (abbreviated as purpose, classified as screening mammogram and diagnostic mammogram) and personal or family history of cancer. Age was divided into four groups: 1 <40 years, 2 40–49 years, 3 50–59 years, and 4 ≥60 years. The final pathological results were categorized as malignant and benign lesions. High-risk lesions, such as lobular carcinoma in situ and phyllodes tumors, which are controversial in terms of whether they are benign or malignant, were not included from the study at the beginning, because they did not meet the inclusion criteria for obtaining accurate pathological results.
Statistical Analysis
Statistical analysis was performed using R software (version 3.6.1, R Foundation for Statistical Computing, Vienna, Austria, http://www.r-project.org). Quantitative data are expressed as the mean ± standard deviation, and qualitative data are expressed as the number of cases and percentage. Fisher’s exact tests, χ2 tests or Mann–Whitney U-tests were used to compare the single factors between benign and malignant categories where appropriate. The calcifications were divided into subgroups by qualitative features, and the malignancy rates and the corresponding exact 95% confidence intervals (CIs) were calculated and compared. The difference was statistically significant at P<0.05.
Development and Validation of the Prediction Models
We divided the patients into a training cohort and a validation cohort at a ratio of 7:3 by stratified randomization through the “caret” package to obtain the same benign and malignant proportions. The training cohort was used to develop prediction models. All the features were analyzed by univariate analysis, and then the statistically significant features were introduced into the stepwise multivariate binary logistic regression analysis to develop the prediction models, with the Akaike information criterion (AIC) and likelihood ratio test (LR test) as stopping rules. The coefficients for each feature and constants in the equation were generated separately, and then the risk of malignancy (risk) was calculated for each group of calcifications.
The discrimination and calibration performance were assessed in both the training and validation cohorts. Receiver operating characteristic (ROC) curves were drawn to evaluate and compare the discrimination of the models with the area under the ROC curve (AUC) and 95% CI. The calibration performance was assessed by 10-fold cross-validation calibration curves. The Hosmer-Lemeshow goodness-of-fit test was used to evaluate the overall fit, where P>0.05 indicates a better fit. Decision curve analysis (DCA) was conducted to demonstrate the clinical utility of the prediction models by quantifying the net benefit for a series of threshold probabilities.
Finally, we used a nomogram to visualize the optimal model to facilitate the application of the model in the clinic.
Results
Clinicopathological Information
The average age of the 907 patients, including 665 premenopausal (73.4%) and 242 postmenopausal (26.6%) patients, was 46.7±8.70 years (range, 24–86 years). The malignancy rate of the 1018 groups of amorphous calcifications was 28.4% (95% CI: 25.7%, 31.3%), with 289 malignant calcifications and 729 benign calcifications. The detailed pathological results are shown in Table 1. The mean age of patients with benign calcifications (46.3±8.10 years) and malignant calcifications (47.6±10.0 years) was not statistically significant (P=0.084). A total of 769 calcifications were found by screening mammograms, and 249 calcifications were found by diagnostic mammograms. Between the benign and malignant calcifications, clinical features including age group, menopausal status, purpose and history of cancer were significantly different (P<0.05).
 |
Table 1 Pathological Results of Calcifications |
Features of Mammography
In terms of the breast composition categories, there were 6 calcifications found in fatty breast tissue, 29 calcifications in scattered fibroglandular density, 871 calcifications in heterogeneously dense breast tissue and 112 calcifications in extremely dense breast tissue. There were 699 calcifications of grouped distribution, 214 of segmental distribution and 105 of regional distribution. The average MD was 15.3±13.78 mm for benign calcifications and 27.3±18.86 mm for malignant calcifications (P<0.001). Between the benign and malignant calcifications, the distribution, MD and quantity were significantly different (P<0.05). There were 64 (6.29%) discrepancies in morphology, 35 (3.44%) in distribution, 74 (7.27%) in measurement and 24 (2.36%) in quantity determined by the third reader by consensus. Typical MG images are shown in Figure 1.
 |
Figure 1 (A and B) Multiple unilateral grouped amorphous calcifications (circle and arrow) detected on screening mammography of 51 years old woman was classified as BI-RADS category 4A. Biopsy confirmed one group of calcifications (circle) adenosis with fibroadenoma. (C and D) Single grouped amorphous calcifications (circle) detected on diagnostic mammography for self-found lump of 43 years old woman was classified as BI-RADS category 4B. The final postoperative pathological result was ductal carcinoma in situ. (E and F) Single segmental amorphous calcifications (between two lines) detected on screening mammography of 42 years old woman was classified as BI-RADS category 4B. The final postoperative pathological result was adenosis. (G and H) Single regional amorphous calcifications (circle) detected on screening mammography of 42 years old woman was classified as BI-RADS category 4B. Postoperative pathology confirmed adenosis. |
Malignancy Rate Analysis
The malignancy rates in the subgroups with significant differences are shown in Table 2. The highest malignancy rate was 70.4% in the diagnostic mammogram group, and the malignancy rates were between 10% and 50% in the remaining subgroups. The malignancy rate of the segmental distribution subgroup (65.9%) was higher than that of the grouped (16.7%) and regional (29.5%) distribution subgroups. The malignancy rate of 783 calcifications categorized as BI-RADS 4A by our radiologists was 10.2%, that of 197 calcifications categorized as BI-RADS 4B was 61.8%, and that of 103 calcifications categorized as BI-RADS 4C was 91.3%.
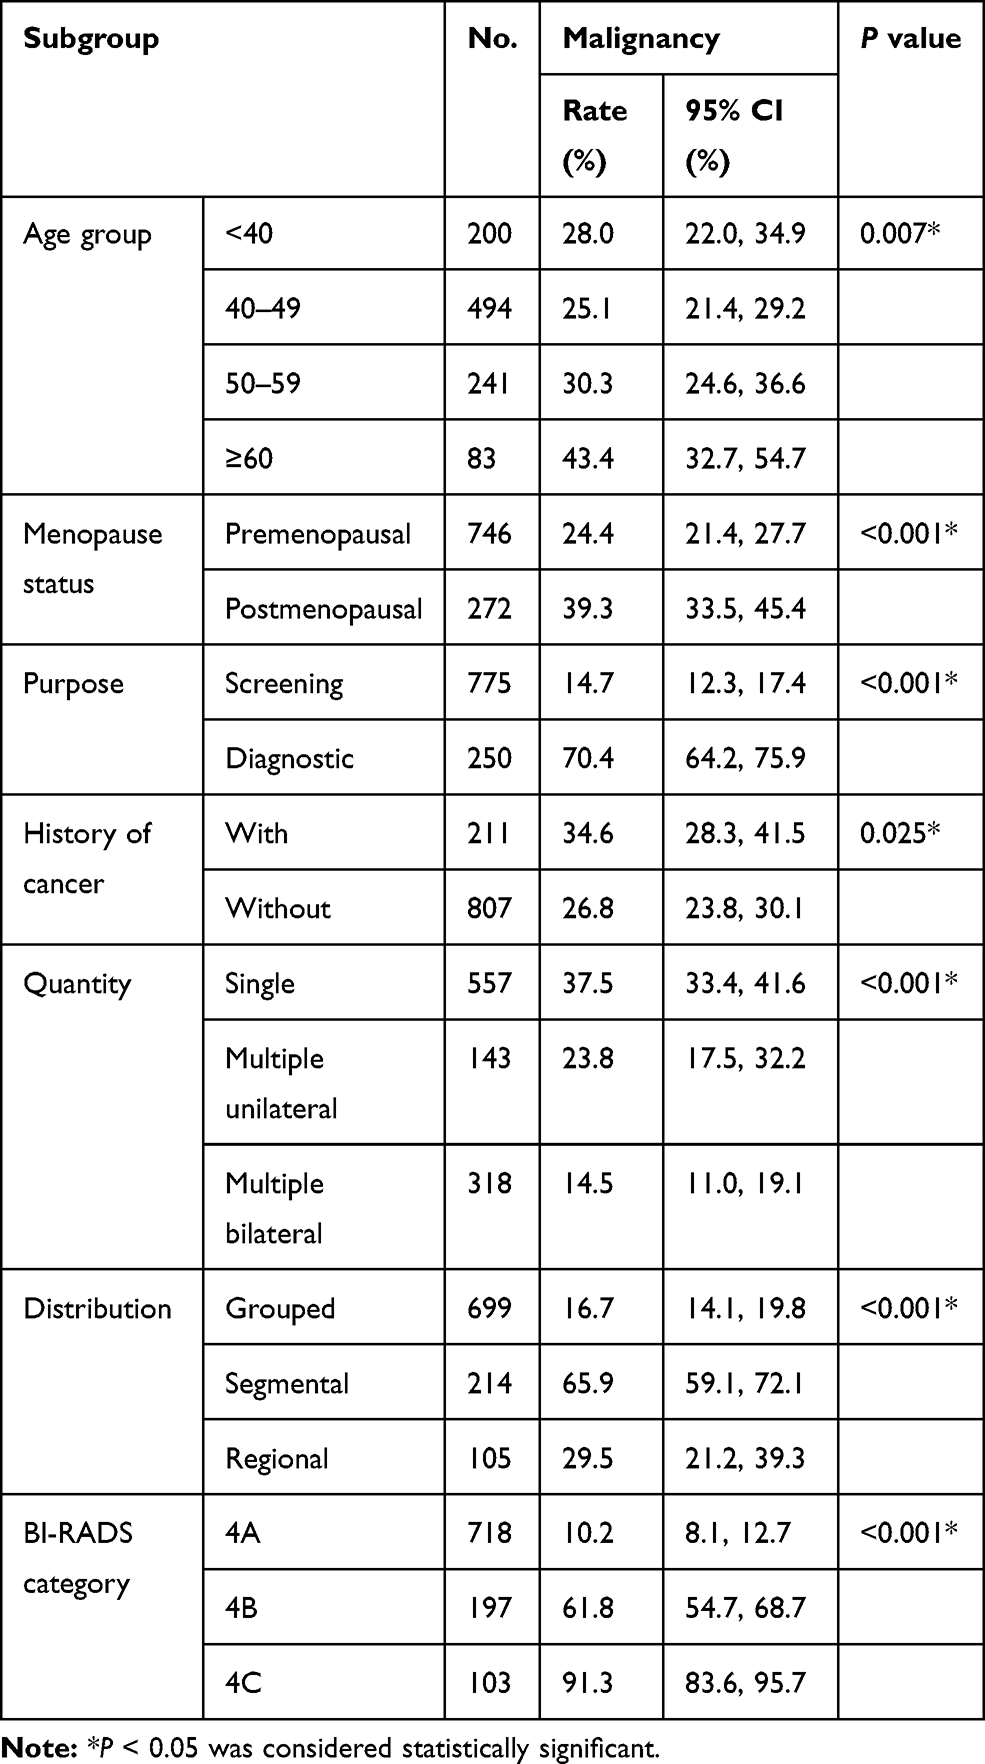 |
Table 2 The Malignancy Rates of Statistically Different Subgroup |
Combining the clinical features and distribution features of calcifications, the malignancy rate of grouped amorphous calcifications found by screening mammograms was 7.8% (95% CI: 5.8%, 10.4%) less than 10%. For premenopausal females without a history of cancer, the malignancy rate of grouped amorphous calcifications found by screening mammograms was only 4.9% (95% CI: 3.0%, 7.7%).
Prediction Models
A total of 1018 groups of amorphous calcifications were randomly divided into 712 groups in the training cohort and 306 groups in the validation cohort, with malignancy rates of 28.1% (95% CI: 24.8%, 31.6%) and 29.1% (95% CI: 24.1%, 34.6%), respectively. There was no significant difference in the malignancy rate or clinical or mammographic features between the training cohort and validation cohort (P>0.05). The training cohort was used to establish the prediction models.
Between benign and malignant calcifications, age group, menopausal status, distribution, MD and quantity were significantly different. To avoid overfitting, age group and menopausal status were introduced separately to develop prediction models with the other three risk factors because age group and menopausal status were age-related features. The odds ratios (ORs) with 95% CIs of the four selected risk factors and P values in the two prediction models are detailed in Table 3.
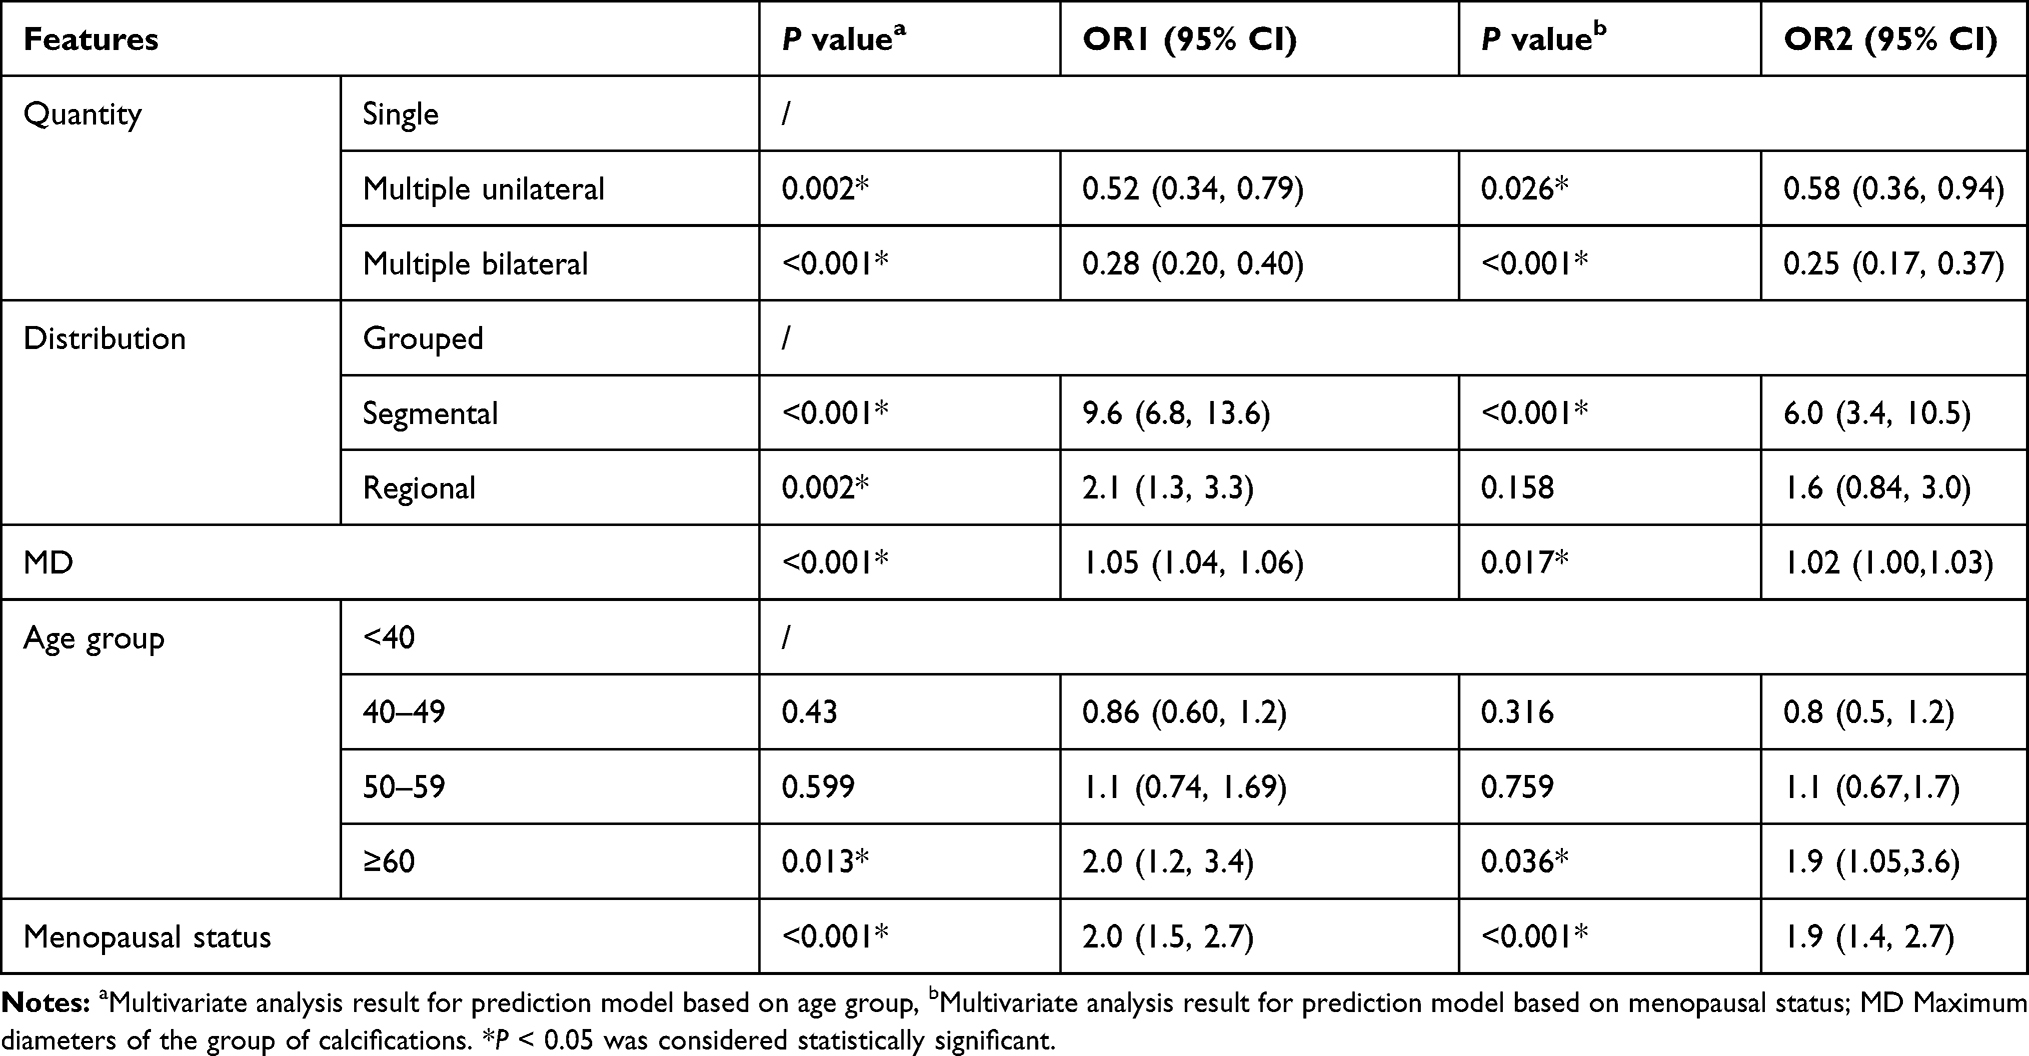 |
Table 3 Multivariate Analysis for Prediction Models Based on Age Group and Menopausal Status |
The AUCs of the models based on age group and menopausal status were 0.799 (95% CI: 0.761, 0.836) and 0.800 (95% CI: 0.763, 0.838) in the training cohort and 0.795 (95% CI: 0.738, 0.852) and 0.802 (95% CI: 0.748, 857) in the validation cohort, respectively (Figure 2). The DeLong test confirmed no significant differences in the two models between the training and validation cohorts (P=0.725, 0.378). Considering that menopausal status is not always available for every patient and that age information is more convenient for clinical application, the age group model was chosen as the optimal prediction model for the construction of the nomogram (Figure 3).
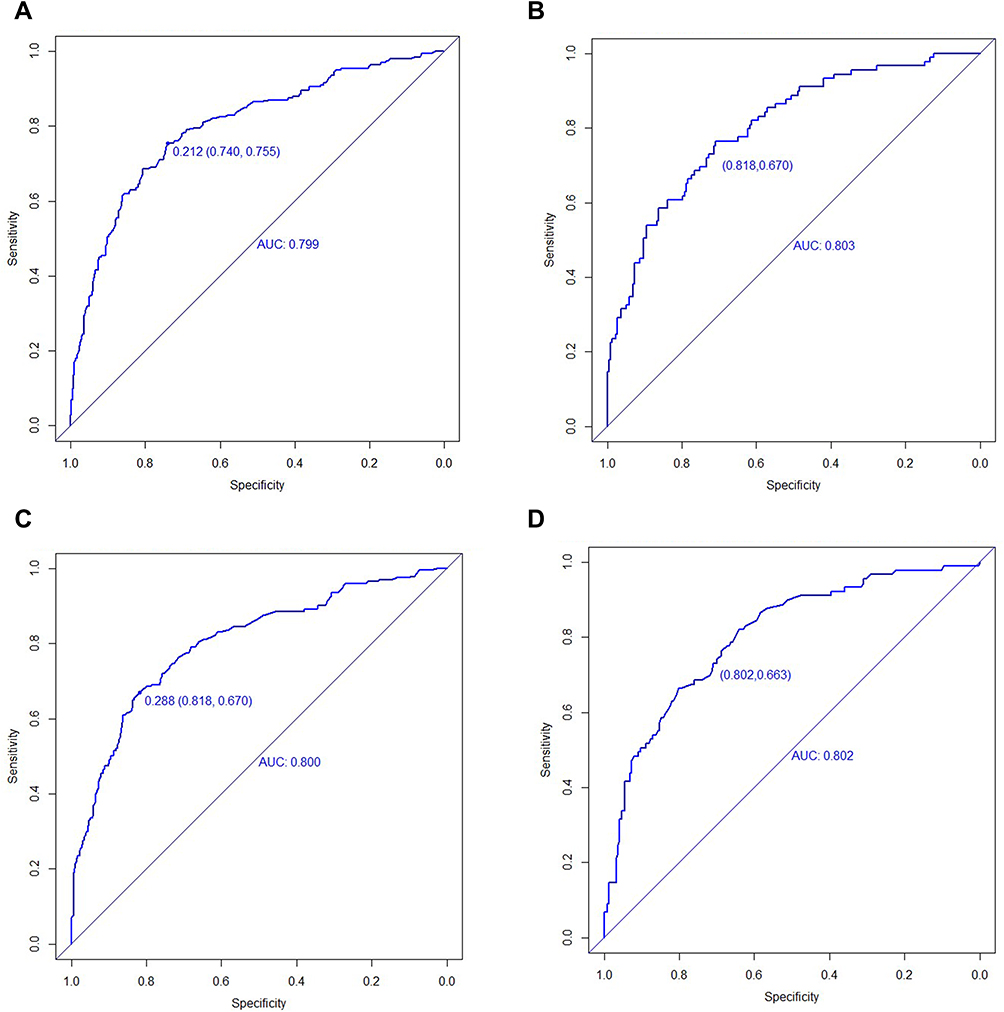 |
Figure 2 Receiver operating characteristic (ROC) curves of the prediction models (contains area under the ROC curve (AUC) and the cutoff value of the maximum Youden Index (specificity, sensitivity)). (A and B) ROC curve of the age model in the training/validation cohort, (C and D) ROC curve of the menopausal status model in the training/validation cohort. |
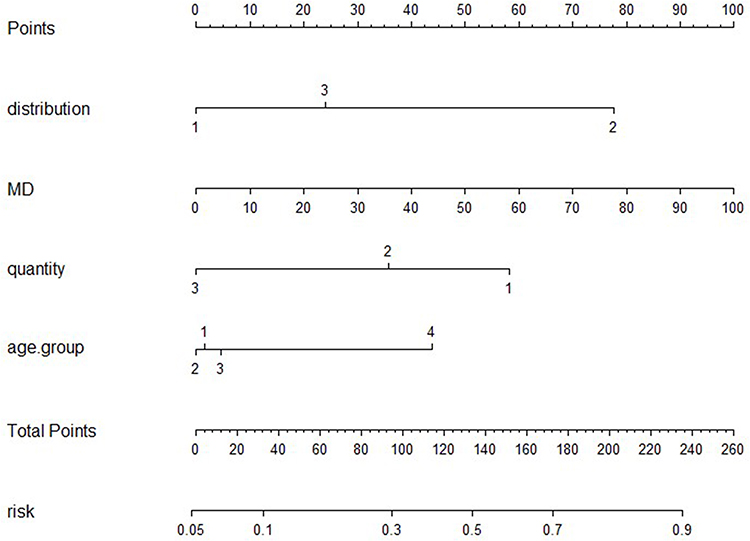 |
Figure 3 The nomogram of the prediction model. Every risk factor corresponds to “Points”, and “Total Points”, which is the sum of the “Points” of each risk factor, corresponds to “risk”. “Distribution” represents the distribution of calcifications: 1 grouped, 2 segmental, and 3 regional. “MD” represents the maximum diameter of the group of calcifications. “Quantity” represents the quantity of the groups of calcifications: 1 represents single, 2 represents multiple unilateral and 3 represents multiple bilateral. For the “age group”, 1 represents <40 years old, 2 represents 40–49 years, 3 represents 50–59 years, and 4 represents ≥60 years. |
Based on the predictive nomogram, the distribution of predicted risk was significantly different for benign and malignant calcifications (Figure 4A and B). The 10-fold cross-validation calibration curve showed good calibration efficiency (Figure 5A and B). The average absolute errors of the training cohort and the validation cohort were 0.015 and 0.013, respectively. The P-value of the Hosmer-Lemeshow goodness-of-fit test was 0.263. The DCA curves demonstrated that our model had good clinical utility (Figure 5C and D).
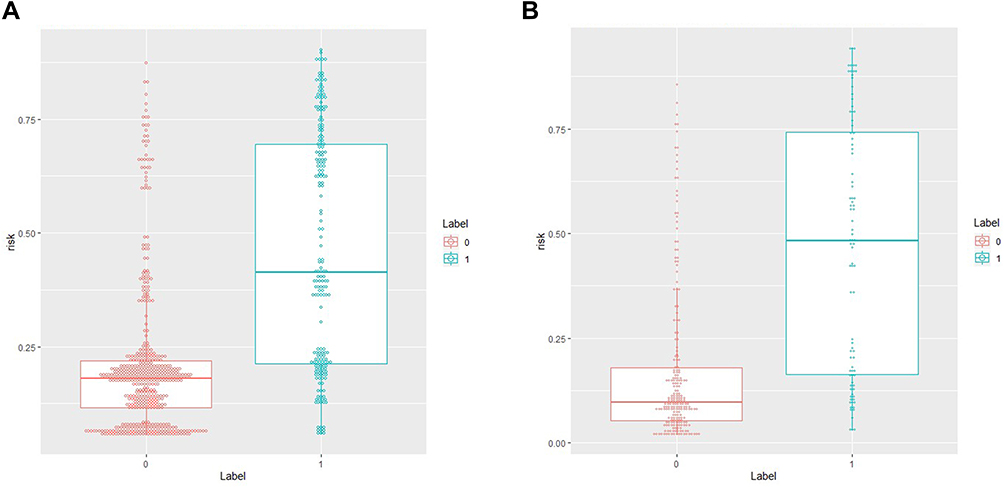 |
Figure 4 The risk distribution box diagram of the prediction model. Red represents benign cases, blue represents malignant cases, and the distribution of benign and malignant cases is different. (A) Distribution map of the training cohort, (B) distribution map of the validation cohort. |
 |
Figure 5 The 10-fold cross-validation calibration curves showed that the model has good calibration performance in the training cohort (A) and validation cohort (B), with average absolute errors of 0.015 and 0.013, respectively. Decision curve analysis (DCA) showed that the training cohort (C) and validation cohort (D) both had high net clinical benefit with the use of the model. |
Discussion
In this study, we summarized the malignancy rates of amorphous calcifications and the subgroups divided by related features. The malignancy rates in subgroups divided by age, menopausal status, purpose, quantity, distribution and BI-RADS category were significantly different. Then, we built two prediction models, and the optimal model showed high discrimination and calibration ability. The features of age, MD, distribution and quantity of calcifications were independent predictors of malignancy risk of amorphous calcifications.
In our study, the total malignancy rate of amorphous calcifications was 28.4%, which was in accordance with BI-RADS category 4B. The malignancy rate of each BI-RADS category assessed by the doctors was higher than or close to the upper limit of the recommended PPVs. In Kim et al’s12 study, the malignancy rate of BI-RADS category 4A cases (17.6%) was also higher than that of the guideline PPV (2–10%). This finding may indicate that doctors may slightly underestimate the malignancy rates of amorphous calcifications, but this still requires verification by multiple institutions and more observers. Moy13 reviewed previous studies and found that the malignancy rates of amorphous calcifications in biopsy are 13–26% (average 20%). Recently, Sen et al14 reported that the malignancy rate was 12.6% (36/285) for amorphous calcifications. For grouped amorphous calcifications identified on screening mammography, the malignancy rate was only 2.8% (6/216) in Iwase et al’s7 study, while in our cohort, the malignancy rate was 7.8% (45/578), which was higher than their results but similar to the results of the studies of Oligane et al4 (7.0%, 25/356) and Kim et al5 (7.6%, 7/92). The difference might be related to different study populations and sample sizes.
Previous studies have demonstrated the importance of menopausal status and age in breast cancer assessment.4,11,15 In our research, the malignancy rate of patients older than 60 years was higher than that of younger patients. Similar results were reported by Oligane et al,4 who found that patients younger than 50 years had a lower malignancy rate. In the outcome evaluation of the biopsies of microcalcifications in the setting of population-based breast cancer screening, Farshid et al16 indicated that women older than 70 years have a higher malignancy rate than women younger than 50 years. In addition, this study proposed that the patient’s family history of breast cancer was related to malignant lesions. Oligane et al4 suggested that breast cancer/ovarian cancer history is an influential factor for malignancy. Our results also showed that the malignancy rate of the subgroup without a history of cancer was significantly lower than that of the subgroup with a history of cancer.
Distribution and morphology are recognized as independent influencing factors of calcifications.4,5,11,17 Generally, the malignancy rate of calcifications with only one pure morphology is lower than that of calcifications with more than one type of suspicious morphology.14 Previous studies on the PPVs of morphology and distribution descriptors demonstrated an increasing trend toward malignancy from amorphous/coarse heterogeneous to fine pleomorphic/fine linear/fine-linear branching microcalcifications and from regional/grouped to segmental/linear distribution.5,11,17 Our study focused on only one suspicious amorphous morphology type, which has a lower PPV. For distribution, our result is similar to previous studies that grouped calcifications are the most common and have the lowest malignancy rate, while segmental distribution has the highest malignancy rate. The malignancy rates of grouped, segmental and regional distributions were consistent with the PPVs in BI-RADS guidelines.
Farshid et al16 reported that MD was an independent predictor of malignancy, and the cutoff value was 15 mm. However, Sen et al14 suggested that the size ranges of malignant and benign lesions overlapped, which makes it difficult to use this factor as a single predictor of malignancy. MD was found to be one of the four predictors in our study, and with the usage of the nomogram, the predicted risk had little overlap.
Some studies have presented computerized methods that may offer support in the evaluation of calcifications.14,18,19 A nomogram is a visual statistical tool that can incorporate multiple risk factors, so its predictive ability is more comprehensive than that of a single risk factor.20,21 It has been successfully used in the field of breast cancer to predict neoadjuvant efficacy, disease-free survival, lymph node metastasis and the malignancy risk of calcifications in breast cancer patients.15,22–27 Our results showed that the nomogram can also be used to individually predict malignancy risk for amorphous calcifications, and we suppose that it is better than assess all the amorphous calcifications into BI-RADS 4B only.
Our research has the following limitations. First, this study was a single-center retrospective study and only included patients with pathology, without follow-up patients and prospective external verification of other institutions. This may cause selection bias and affect the statistical results of the malignancy rate, so prospective, multicenter, large-scale research studies including follow-up cases are needed to verify our results. Second, the cases in this study were mainly heterogeneously dense and extremely dense breasts, which are the common glandular density types for women in our country, so some other accompanying mammographic features may be obscured, such as asymmetric density and masses. Third, although the prediction model has good diagnostic efficiency, there were still many cases of missed diagnoses, and further improvement of the model is needed to reduce the rate of missed diagnoses, such as combining ultrasonographic and magnetic resonance imaging (MRI) findings or introducing other computer-aided technologies and learning techniques.
Conclusion
In conclusion, the malignancy rate of amorphous calcifications was consistent with the PPV of BI-RADS 4B, and the malignancy rate of grouped amorphous calcifications found by screening mammography was consistent with the PPV of BI-RADS 4A. The distribution of calcifications, MD and quantity of calcifications are independent mammographic predictors of amorphous microcalcifications. The nomogram based on age and mammographic features has good diagnostic and calibration performance. It can be used in the clinic to individually predict malignancy risk for amorphous calcifications to make more precise assessments.
Abbreviations
AIC, Akaike information criterion; AUC, area under the ROC curve; BI-RADS, Breast Imaging Reporting and Data System; CIs, confidence intervals; DCA, decision curve analysis; DCIS, ductal carcinoma in situ; LR test, likelihood ratio test; MD, maximum diameters of the group of calcifications; ORs, odds ratios; PPV, positive predictive value; ROC, Receiver operating characteristic.
Author Contributions
All authors made substantial contributions to conception and design, acquisition of data, or analysis and interpretation of data; took part in drafting the article or revising it critically for important intellectual content; agreed to submit to the current journal; gave final approval of the version to be published; and agree to be accountable for all aspects of the work.
Funding
This work was supported by the National Natural Science Foundation of China, Youth Science Fund Project(no.81901703), Natural Science and Technology Major Project (no.2020ZX09201-013) and the National Natural Science Foundation of China (no. 61731008). This project has also been funded by Shanghai “Rising Stars of Medical Talent” Youth Development Program, Medical Imaging Practitioner Program (no. SHWRS (2020)_087) and Shanghai Municipal Health Planning Commission Youth Project (no. 20184Y0010).
Disclosure
The authors report no conflicts of interest in this work.
References
1. Siegel RL, Miller KD, Jemal A. Cancer statistics, 2020. CA Cancer J Clin. 2020;70(1):7–30. doi:10.3322/caac.21590
2. Stomper PC, Connolly JL. Ductal carcinoma in situ of the breast: correlation between mammographic calcification and tumor subtype. AJR Am J Roentgenol. 1992;159(3):483–485. doi:10.2214/ajr.159.3.1323923
3. Sickles EA, D’Orsi CJ, Bassett LW, et al. ACR BI-RADS mammography. In: ACR BI-RADS Atlas, Breast Imaging Reporting and Data System. Reston, VA, American College of Radiology. 2013;61–78.
4. Oligane HC, Berg WA, Bandos AI, et al. Grouped amorphous calcifications at mammography: frequently atypical but rarely associated with aggressive malignancy. Radiology. 2018;288(3):671–679. doi:10.1148/radiol.2018172406
5. Kim SY, Kim HY, Kim EK, Kim MJ, Moon HJ, Yoon JH. Evaluation of malignancy risk stratification of microcalcifications detected on mammography: a study based on the 5th edition of BI-RADS. Ann Surg Oncol. 2015;22(9):2895–2901. doi:10.1245/s10434-014-4362-6
6. Grimm LJ, Johnson DY, Johnson KS, et al. Suspicious breast calcifications undergoing stereotactic biopsy in women ages 70 and over: breast cancer incidence by BI-RADS descriptors. Eur Radiol. 2017;27(6):2275–2281. doi:10.1007/s00330-016-4617-7
7. Iwase M, Tsunoda H, Nakayama K, et al. Overcalling low-risk findings: grouped amorphous calcifications found at screening mammography associated with minimal cancer risk. Breast Cancer. 2017;24(4):579–584. doi:10.1007/s12282-016-0742-z
8. Iasonos A, Schrag D, Raj GV, et al. How to build and interpret a nomogram for cancer prognosis. J Clin Oncol. 2008;26(8):1364–1370. doi:10.1200/JCO.2007.12.9791
9. Timmers JMH, Verbeek ALM, IntHout J, et al. Breast cancer risk prediction model: a nomogram based on common mammographic screening findings. Eur Radiol. 2013;23(9):2413–2419. doi:10.1007/s00330-013-2836-8
10. Park HS, Kim HY, Park S, et al. A nomogram for predicting underestimation of invasiveness in ductal carcinoma in situ diagnosed by preoperative needle biopsy. Breast. 2013;22(5):869–873. doi:10.1016/j.breast.2013.03.009
11. Wang H, Lai J, Li J, et al. Does establishing a preoperative nomogram including ultrasonographic findings help predict the likelihood of malignancy in patients with microcalcifications? Cancer Imaging. 2019;19(1):46. doi:10.1186/s40644-019-0229-1
12. Kim J, Kim EK, Kim MJ, Moon HJ, Yoon JH. “Category 4A” microcalcifications: how should this subcategory be applied to microcalcifications seen on mammography? Acta Radiol. 2018;59(2):147–153. doi:10.1177/0284185117709036
13. Moy L. Should we continue to biopsy all amorphous calcifications? Radiology. 2018;288(3):680–681. doi:10.1148/radiol.2018180767
14. Sen LQC, Huang ML, Leung JWT, Wei W, Adrada BE. Malignancy rates of stereotactic biopsies of two or more distinct sites of suspicious calcifications in women without known breast cancer. Clin Imaging. 2019;58:156–160. doi:10.1016/j.clinimag.2019.07.007
15. Chai X, Sun MY, Jia HY, et al. A prognostic nomogram for overall survival in male breast cancer with histology of infiltrating duct carcinoma after surgery. PeerJ. 2019;7:e7837. doi:10.7717/peerj.7837
16. Farshid G, Sullivan T, Downey P, Gill PG, Pieterse S. Independent predictors of breast malignancy in screen-detected microcalcifications: biopsy results in 2545 cases. Br J Cancer. 2011;105(11):1669–1675. doi:10.1038/bjc.2011.466
17. Berg WA, Arnoldus CL, Teferra E, et al. Biopsy of amorphous breast calcifications: pathologic outcome and yield at stereotactic biopsy. Radiology. 2001;221(2):495–503. doi:10.1148/radiol.2212010164
18. Basile TMA, Fanizzi A, Losurdo L, et al. Microcalcification detection in full-field digital mammograms: a fully automated computer-aided system. Phys Med. 2019;64:1–9. doi:10.1016/j.ejmp.2019.05.022
19. Fanizzi A, Basile TMA, Losurdo L, et al. A machine learning approach on multiscale texture analysis for breast microcalcification diagnosis. BMC Bioinform. 2020;21(Suppl 2):91. doi:10.1186/s12859-020-3358-4
20. Huang Y, Liu Z, He L, et al. Radiomics signature: a potential biomarker for the prediction of disease-free survival in early-stage (I or II) non-small cell lung cancer. Radiology. 2016;281(3):947–957. doi:10.1148/radiol.2016152234
21. Kattan MW. Judging new markers by their ability to improve predictive accuracy. J Natl Cancer Inst. 2003;95(9):634–635. doi:10.1093/jnci/95.9.634
22. Yu FH, Wang JX, Ye XH, et al. Ultrasound-based radiomics nomogram: a potential biomarker to predict axillary lymph node metastasis in early-stage invasive breast cancer. Eur J Radiol. 2019;119:108658. doi:10.1016/j.ejrad.2019.108658
23. Sadeghi M, Alamdaran S, Daneshpajouhnejad P, et al. A logistic regression nomogram to predict axillary lymph node metastasis in early invasive breast cancer patients. Breast J. 2019;25(4):769–771. doi:10.1111/tbj.13340
24. Han L, Zhu Y, Liu Z, et al. Radiomic nomogram for prediction of axillary lymph node metastasis in breast cancer. Eur Radiol. 2019;29(7):3820–3829. doi:10.1007/s00330-018-5981-2
25. Gooch Jessica C, Schnabel F, Chun J, et al. A nomogram to predict factors associated with lymph node metastasis in ductal carcinoma in situ with microinvasion. Ann Surg Oncol. 2019;26(13):4302–4309. doi:10.1245/s10434-019-07750-9
26. Hwang HW, Jung H, Hyeon J, et al. A nomogram to predict pathologic complete response (pCR) and the value of tumor-infiltrating lymphocytes (TILs) for prediction of response to neoadjuvant chemotherapy (NAC) in breast cancer patients. Breast Cancer Res Treat. 2019;173(2):255–266. doi:10.1007/s10549-018-4981-x
27. Pan X, Yang W, Chen Y, et al. Nomogram for predicting the overall survival of patients with inflammatory breast cancer: a SEER-based study. Breast. 2019;47:56–61. doi:10.1016/j.breast.2019.05.015
 © 2021 The Author(s). This work is published and licensed by Dove Medical Press Limited. The
full terms of this license are available at https://www.dovepress.com/terms
and incorporate the Creative Commons Attribution
- Non Commercial (unported, 3.0) License.
By accessing the work you hereby accept the Terms. Non-commercial uses of the work are permitted
without any further permission from Dove Medical Press Limited, provided the work is properly
attributed. For permission for commercial use of this work, please see paragraphs 4.2 and 5 of our Terms.
© 2021 The Author(s). This work is published and licensed by Dove Medical Press Limited. The
full terms of this license are available at https://www.dovepress.com/terms
and incorporate the Creative Commons Attribution
- Non Commercial (unported, 3.0) License.
By accessing the work you hereby accept the Terms. Non-commercial uses of the work are permitted
without any further permission from Dove Medical Press Limited, provided the work is properly
attributed. For permission for commercial use of this work, please see paragraphs 4.2 and 5 of our Terms.