Back to Journals » Clinical Ophthalmology » Volume 15
Macular Vessel Density in Diabetic Retinopathy Patients: How Can We Accurately Measure and What Can It Tell Us?
Authors Pramil V, Levine ES, Waheed NK
Received 3 February 2021
Accepted for publication 19 March 2021
Published 13 April 2021 Volume 2021:15 Pages 1517—1527
DOI https://doi.org/10.2147/OPTH.S272328
Checked for plagiarism Yes
Review by Single anonymous peer review
Peer reviewer comments 2
Editor who approved publication: Dr Scott Fraser
Varsha Pramil,1,2 Emily S Levine,1,2 Nadia K Waheed1
1New England Eye Center, Tufts Medical Center, Boston, MA, USA; 2Tufts University School of Medicine, Boston, MA, USA
Correspondence: Nadia K Waheed
New England Eye Center, Tufts Medical Center, 260 Tremont St., Boston, MA, 02116, USA
Tel +1 617-636-4600
Fax +1 617-636-4866
Email [email protected]
Abstract: Diabetic retinopathy is one of the leading causes of blindness worldwide. Optical coherence tomography angiography (OCTA) is a non-invasive technology that provides depth-resolved images of the chorioretinal vasculature and allows for the understanding of the changes in vasculature with diabetic retinopathy. Not only can it provide qualitative information, but OCTA can also provide quantitative information about the vasculature in patients with diabetic retinopathy. Macular vessel density is one of the quantitative metrics that can be obtained from OCTA images. This is a repeatable and non-subjective measurement that can provide valuable insight into the pathophysiology of diabetic retinopathy. In this non-systematic review, the measurement of macular vessel density in diabetic retinopathy and the reasons for its importance in the diagnosis and management of patients with diabetes and varying severities of diabetic retinopathy is discussed.
Keywords: diabetic retinopathy, macular vessel density, OCTA
Introduction
By the year 2040, over 642 million people worldwide are estimated to be diagnosed with diabetes mellitus.1 Unmanaged diabetes can lead to many complications including diabetic retinopathy (DR), one of the leading causes of visual impairment and blindness. Microvascular changes in the retina secondary to persistent hyperglycemia and inflammation are the hallmark of DR, progressing to retinal neovascularization, macular ischemia and macular edema which cause vision loss.2–4
The severity of DR is most commonly characterized with use of fundus photographs according to the criteria provided by the Early Treatment Diabetic Retinopathy Study (ETDRS) extension of the modified Airlie House Classification.5 Additionally, a more suitable and simplified method for clinical practice based on findings on dilated ophthalmoscopy, the International Diabetic Retinopathy Severity (IDRS) scale, has also been proposed. In both classifications, increased stage of retinopathy is correlated with the severity and number of retinal lesions, such as microaneurysms and hemorrhages along with the presence of retinal neovascularization, on examination.6–8
Beyond the imaging modalities utilized in such structured classification schemes, additional imaging techniques have been used clinically to evaluate, stage and monitor patients with DR, including fluorescein angiography (FA), optical coherence tomography (OCT) and OCT angiography (OCTA). Additionally, investigational modalities such as adaptive optics, hyperspectral imaging and retinal oximetry have also been used.9 The majority of these imaging technologies provide qualitative and subjective methods by which to classify diabetic patients. However, the clinical use of quantitative biomarkers in the diagnosis and risk assessment of DR would provide a more standardized, repeatable and reproducible approach in the evaluation of these patients. Specifically, recent research involving OCTA has shown that this imaging modality can be useful for quantitative analysis of patients with DR.
OCTA is a non-invasive imaging technology that relies on the decorrelation signal between repeated B-scans at the same location in order to provide depth-resolved images of the retinal vasculature. Two common types of OCTA devices currently used are spectral domain (SD) and swept source (SS) devices, both of which use Fourier domain detection to generate an image.10,11 Whereas FA involves the injection of dye into a patient’s blood vessels, OCTA is completely non-invasive. Moreover, studies have shown that FA is best at measuring larger vessels as well as more superficial vessels.12 Since pathology in DR starts in the microvasculature and is hypothesized to preferentially involve the deep retinal capillary plexus initially, FA may not be very sensitive to the earliest vascular changes in DR.13
OCTA is characterized by its high-resolution imaging especially of the retinal microvasculature. Therefore, it may be more sensitive to the earliest manifestations of the disease. Moreover, since OCTA is depth-resolved, it is able to visualize the deep capillary plexus of the retina, one of the earliest involved in DR. Due to this, OCTA is comparable to FA for detecting areas of non-perfusion and/or neovascularization in addition to providing further characterization of each retinal capillary layer in DR.14–16 Figure 1 outlines the differences between FA and OCTA imaging in a patient with DR. Figure 2 depicts the differences in vasculature between DR stages as visualized by OCTA.
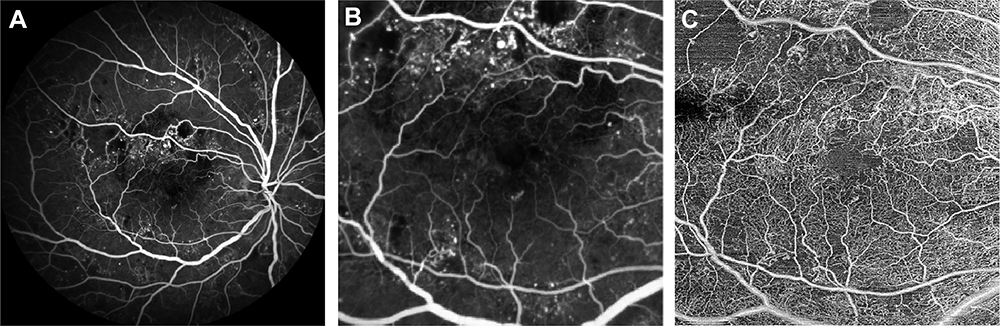 |
Figure 1 Original images from a patient with severe non-proliferative diabetic retinopathy with macular edema. (A) Fluorescein angiography (FA) image. (B) Cropped FA image scaled to the 6 x 6 mm macular region shown in the corresponding swept-source optical coherence tomography angiography (SS-OCTA) image. (C) 6 x 6 mm macular SS-OCTA en face image from the total retinal layer slab. In the SS-OCTA image, areas of capillary dropout are clearly evident, and the retinal microvasculature can be better appreciated. In the FA image, larger superficial vessels are emphasized and microaneurysms along with patchy areas of macular ischemia can be seen. |
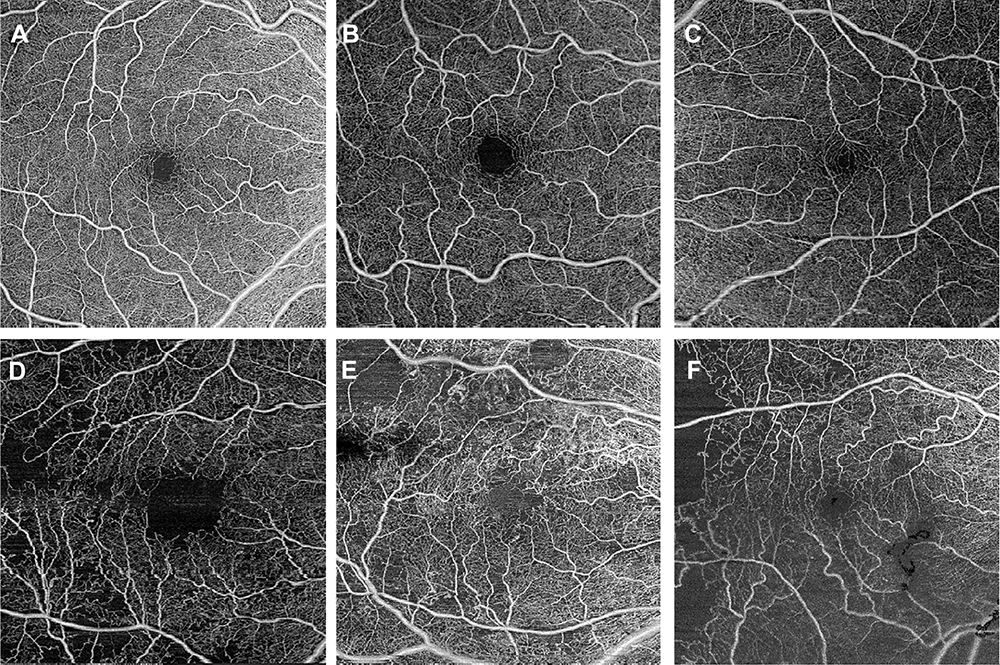 |
Figure 2 A-F show 6 x 6 mm original macular SS-OCTA en face images from the total retinal layer slab of patients with varying stages of diabetes and retinopathy from a (A) healthy control with no diabetes (B) a patient with diabetes and no retinopathy, (C) mild non-proliferative DR, (D) moderate non-proliferative DR, (E) severe non-proliferative DR and (F) proliferative DR. As the DR becomes more severe, increased vasculature loss can be seen as areas of darker patches with no microvasculature evident. |
Many OCTA quantification metrics have been suggested to be altered in diabetic retinopathy and therefore as DR biomarkers. This includes foveal avascular zone (FAZ) area and perimeter, FAZ contour irregularity, blood vessel tortuosity (BVT), blood vessel caliber (BVC), vessel perimeter index (VPI), fractal dimension (FD) and peripapillary vessel density in addition to macular vessel density. In this article, we will focus on the macular vessel density, which is one of the metrics that has been shown to be valuable parameter in the evaluation of patients with DR. While many of the others metrics also show associations with diabetic retinopathy, and may have specific advantages, those are outside of the scope of this review.17–20
What is Macular Vessel Density?
There are various metrics that can be used to assess the density of the vasculature in the macula. These include vessel area density, vessel length density and skeletonized vessel density. While vessel area density calculates the percentage of total vascular area in the area of interest, both vessel length density and skeletonized vessel density quantify the proportion of total vessel length in the area of interest. This is computed after skeletonization, or the reduction of each vessel’s width to 1 pixel. An advantage of skeletonized vessel parameters is that, unlike vessel area density, it is not as confounded by scan quality and image resolution.24 Additionally, vessel skeleton density reduces the weightage of large vessels in an image and may therefore be more sensitive to changes in the microvasculature. However, vessel area density may be a more physiologic parameter providing more information about the vasculature as both vessel size and length are taken into account.25 Compared to vessel area density, skeletonized vessel density or vessel length density has been reported to have higher intradevice repeatability. However, since these calculations reduce vessels to one pixel thick, and pixel dimensions vary with resolution of the device and of the image output, skeletonized vessel densities have lower interdevice reproducibility, and this is especially true when comparing between spectral-domain and swept-source systems.21–23
Macular vessel density specifically refers to the proportion of the macula with blood flow compared to the total macular area. It is one of the most widely used OCTA measurements in literature. Macular vessel area density, macular vessel length density and macular vessel skeletonized density measurements can all be used to quantify vessel density in the macula. Macular perfusion density and macular capillary network density are sometimes used in the literature in leu of macular vessel area density, but these parameters are all defined and calculated similarly.
Macular vessel area density has been shown to decrease with age but can also act as a surrogate for macular perfusion and can be used to quantitatively monitor the effects of ophthalmological disorders on the vasculature.26 For example, reduced macular vessel area density has been shown in patients with mild to moderate primary open-angle glaucoma, early-stage ethambutol induced optic neuropathy, and DR.27,28 This metric along with vessel skeletonized/length density has also been shown to be highly reproducible in both healthy eyes and eyes with retinal disorders.21,29
The macular vessel densities can be calculated from the full retinal vasculature as well as the superficial capillary plexus (SCP), intermediate capillary plexus (ICP) and deep capillary plexus (DCP). The calculation can also be made specific to the different regions of the macula such as within concentric circles with enlarging diameters of 1 mm, 3 mm and 6 mm around the fovea corresponding to the foveal, parafoveal and perifoveal regions, respectively, in addition to regions 1–8 as depicted by the ETDRS grid. By measuring the macular vessel density in specific regions of the macula and analyzing which region of the macula corresponds with disease, the pathophysiology of retinal diseases, including DR, can be better understood.
Methods to Calculate Macular Vessel Density
There are several different methods that can be utilized to calculate macular vessel area density, but all follow the same general process. The initial step in most methods involves automated segmentation of the retinal layers by the OCTA software in order to generate en face images of the retinal vessels in the layers of interest. Manual correction of the segmentation can be done in cases of macular edema or atrophy. Next, a binarization thresholding method is applied to this en face image whereby OCTA signal above this threshold is interpreted as flow, and finally, the macular vessel area density – the area of flow relative to total area or the area of total vessel length relative to total area is calculated from the binarized image. In order to calculate the skeletonized vessel or vessel length density, each vessel in the binarized image was skeletonized in order to have a width of 1 pixel. The skeletonized vessel or vessel length density was then calculated to be the proportion of skeletonized vascular area in the total area of interest.
Many binarization methods can be used in the assessment of macular vessel density. Currently, there is no one method that is recommended for use in all OCTA studies. The different binarization methods fall under two main categories: global binarization threshold methods, where one threshold value is applied for the whole image, and the local or adaptive thresholding methods, where different threshold values are assigned throughout the image. Brightness and contrast adjustments of the images can also affect the vessel density calculations. One study analyzed five different binarization methods using the image processing software ImageJ: the global default, the global mean, the global Nobuyuki,30 the local mean and the local Phalsalkar et al31 Additionally, five different brightness/contrast changes were also made as follows: no change, increased brightness, increased contrast, increased brightness and contrast and contrast-limited adaptive histogram equalization. These 5 binarization methods used in addition to brightness/contrast changes resulted in significantly different macular vessel area density measurements in the superficial retinal plexus of healthy individuals.32 This variation in measurements highlights the need for a consistent binarization thresholding method to be recommended for all future OCTA studies calculating quantitative measurements such as vessel area density.
Studies have used a variety of different software to generate vessel density calculations. In one study, SS-OCTA imaging was used to calculate the macular vessel area density in patients with varying stages of DR including those with macular edema. Here, the authors used the publicly available GNU image manipulation program (GIMP)’s color selection tool to delineate the visible vessels in the en face macular image and measure the area occupied by these delineated vessels compared to the total area in the image.33 Another utilized a different method involving a custom automated fractal analysis algorithm including image magnification correction based on axial length. The image was processed in 2 ways: one only showing large vessels using global thresholding, gray-voting, Gabor filtering and adaptive thresholding and the other showing large and small vessels using global thresholding, a gray-voting algorithm and adaptive thresholding. These two images were subtracted to obtain a binarized image only showing small vessels and then further processed with skeletonization from which macular vessel skeletonized/length density could be calculated. This method accounted for both the density and complexity of the vasculature.34 Meanwhile, other studies have calculated both metrics using a custom MATLAB software. This software applied a global thresholding binarization to all macular images and used the final binarized image to calculate the vessel area and vessel length or skeletonized vessel density.35
Some OCTA devices also have built-in software that can calculate macular vessel density automatically. This includes the AngioAnalytics software in the RTVue-XR Avanti SD-OCTA system and another built-in software in the Nidek RS-3000 Advance 2 SD-OCTA device. These proprietary, automated methods have been shown to have strong repeatability and reproducibility. Studies calculating the vessel length and vessel area density in OCTA en face images of the superficial retinal plexus using the AngioPlex software in the Cirrus SD-OCTA device have found high reproducibility between different Cirrus OCTA devices and operators and high repeatability within healthy controls and those with retinal diseases.36,37 Another study found that the macular vessel area density calculations using the AngioAnalytics software, when compared to previously published methods of binarization and skeletonization, was able to better detect changes in the macular vessel density of patients with severe non-proliferative DR from those of healthy patients.38 Although these different devices are all able to detect macular vessel density changes, absolute numerical results can be different. For example, when macular vessel density, including both macular vessel area and skeletonized vessel density, has been calculated using three different types of OCTA devices, RTVue XR Avanti, Cirrus HD-OCT 5000 and Plex Elite 9000, significant variability in the calculations was found across the devices suggesting that the values of vessel density cannot be easily compared in research studies if the same OCTA device is not used.21,36,39 In addition to these fully automated algorithms by devices, other studies have found similar results with custom semiautomated algorithms.40
Furthermore, applying projection removal software when calculating macular vessel density in individual retinal layers is vital. When calculations of macular vessel area and skeletonized vessel densities in the deep and intermediate retinal capillary plexus with and without the use of projection removal have been compared, the values have been significantly different.41 This is because projection artifact, which is due to light passing through moving blood that encounters the tissue below and reflects back in the pattern of the overlying blood vessel, will increase the perceived flow signal. Additionally, different projection removal software use different techniques to remove overlying flow and may result in different density results even when applied to the same scans.41,42 Therefore, it is important to choose the same projection removal software when comparing macular vessel density measurements.
It is also important to consider the quality of the OCTA scans obtained. Increased signal strength of scans results in higher repeatability of vessel area density calculations.43 The signal strength of OCTA scans depends on both modifiable and unmodifiable factors. Acquisition of scans can be improved with better patient positioning or use of lubricating eye drops. Media opacity also plays an important role in determining the OCTA scan quality. Patients with cataracts or vitreous floaters have increased media opacity that cannot be modified during scan acquisition. Therefore, it is important to account for the effects of shadowing on vessel density in patients who have media opacity. In these patients, the shadowing may cause it to artifactually appear as vessel loss.44,45
Additionally, axial length variations can have an impact on macular vessel density measurements. In one study, image magnification correction utilizing axial length measurements was found to have a greater effect on absolute foveal superficial retinal vessel area density (SVRD) measurements compared to parafoveal SVRD measurements. This was hypothesized to be an effect of the foveal avascular zone (FAZ) occupying a large portion of the image used to quantify foveal SVRD. Due to this, small changes in the foveal vasculature can have a big impact on this calculation. Refractive error was not shown to predict change in foveal or parafoveal SVRD. Therefore, when interpreting the absolute vessel density values from different studies, it is important to pay attention to whether image magnification correction has been done, especially when including the foveal region. Otherwise, subtracting the FAZ area when measuring foveal SVRD may compensate for the vasculature changes induced by image magnification correction.46 However, increases in FAZ area have been shown to be correlated with DR severity.20 By excluding this region in patients with DR, true macular vessel density measurements depicting macular ischemia may not be calculated.
Moreover, there are many scan sizes that can be used to quantify vessel density. When comparing macular scans with 3 x 3 mm, 6 x 6 mm and 12 x 12 mm fields of view from the same patients with varying stages of DR, absolute macular vessel area and vessel length/skeletonized density values differed. This could be attributed to lower resolution in scans with larger field of view as shown by decreased image quality of 3 x 3 mm cropped regions of the 6 x 6 mm and 12 x 12 mm images compared to the image quality of the acquired 3 x 3 mm macular scans. Additionally, a greater proportion of the image is occupied by large, superficial vessels in scans of larger sizes. Because DR more greatly affects smaller vessels, vasculature changes in these patients may be masked when evaluating with these larger scans. On the other hand, with smaller fields of view, the FAZ may be overrepresented leading to larger absolute vessel density measurement changes with small regions of microvasculature dropout.47,48 This suggests it may be useful to consider scan size when analyzing all macular vessel density measurements.
Although the methods in which macular vessel density can be calculated in DR vary and can result in different absolute values, their overarching findings are similar. For example, when 7 different previously published methods to examine which method is able to best classify the differences between healthy eyes and DR eyes, it was shown that all methods of calculating vessel area and skeletonized vessel density were able to differentiate the diseased eyes.49 This shows there is not one algorithm that is superior to others but that the same algorithm needs to be used when comparing values between research studies or when doing a longitudinal study. Figure 3 shows a few different thresholding/binarization algorithms that can be applied to calculate vessel area density using the ImageJ software.
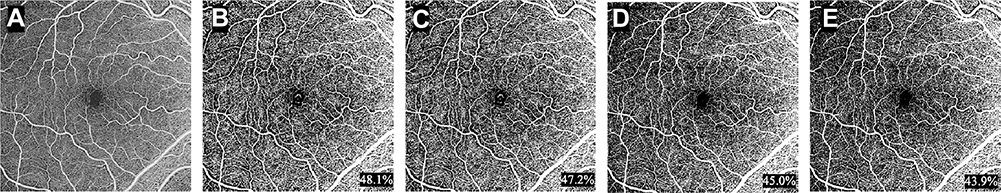 |
Figure 3 Vessel area density measurements (bottom right) were calculated after application of various binarization thresholding methods in ImageJ to an (A) original 6x6 mm macular SS-OCTA en face image of a healthy control, including (B) Local Bernsen, (C) Local MidGrey, (D) Global Default and (E) Global Otsu. |
Therefore, when calculating macular vessel density, although multiple methods will result in similar correlations in DR, it is important to use images with good signal strength, to apply the same projection removal software when making calculations for a specific retinal plexus and pay attention to image magnification corrections. When all of these checks are sanctioned, any binarization thresholding method can be used to produce precise results of vessel density.
An additional factor to consider is how pathology can alter macular vessel density. Extreme care must be taken when measuring macular vessel density in conditions that result in inaccurate segmentation such as in patients with DME or macular ischemia. Automated segmentation in these instances often fails, and while manual correction can be done, it is often inaccurate because of the distortion of the normal retinal architecture and the difficulty in accurately delineating the anatomical landmarks.50 Similarly, although 3 distinct retinal layers (superficial capillary plexus, intermediate capillary plexus and deep capillary plexus) are recognized, many studies continue to collapse the intermediate and deep capillary plexus into one layer called the deep vascular complex.51 Therefore, when comparing vessel density measurements among different studies, or even in the same study across different devices, it is important to pay attention to the segmentation methods used. Because of this and because of the limitations of current projection artifact removal tools, it is probably more accurate when quantifying, to evaluate the full retina rather than measuring the vessel density in the individual retinal layers.21
Additional factors that must be considered when evaluating vessel density are the effect of shadowing, vignetting, and motion artifacts. Shadowing artifacts are characterized by an attenuation of OCTA signal due to blocking of the OCT light beam. This can occur as a result of hemorrhages, drusen or increased media opacity as mentioned above. In chronic diabetic macular edema (DME), for example, turbid fluid may shadow, obscuring vessels and result in artifactually reduced vessel density.44,52 Similarly, motion artifacts as a result of patient movement during scan acquisition can alter vessel density measurements. These artifacts present as white horizontal lines on the en face OCTA image. Because vasculature in OCTA scans is determined based on motion detection, motion artifacts can falsely be interpreted as blood flow. It is important that good acquisition technique, as well as tools such as eye tracking and software-based motion correction are utilized in order to reduce the effects of these artifacts on vessel density measurements.44,52,53 Additionally, sometimes the only way to correct for these artifacts is by looking at the images and removing areas of motion artifact from the analysis.54 Vignetting artifacts, occurring at the margins of the image as a result of large OCT beam size, small pupil and axial misalignment can lead to falsely decreased vessel density measurements. Some artifacts can be combated by decreasing the beam size and dilating the pupil. However, axial misalignment causes the OCT beam pivot to be offset from the pupil and blocked by the iris, resulting in a low-signal artifact. This occurs especially in scans with larger fields of view due to the wider scan angles.55 Therefore, it is important to recognize the presence of, and to exclude areas with such artifacts, when comparing and calculating vessel density measurements.
Importance of Measuring Macular Vessel Density
The measurement of macular vessel density in patients with DR provides a quantitative and reliable tool to assess the development and severity of this disease. By calculating macular vessel density, patients with different stages of DR can be analyzed.56 Comparing macular vessel density in patients with DR to healthy individuals can help us understand the vasculature changes that occurs as a result of DR in a more systematic way than qualitative assessment can provide.
For example, one study has shown that compared to healthy individuals, there is a significant difference in the mean macular vessel area density in the SCP and DCP of patients with DR.33 Vessel area density in the SCP and DCP has also been found to be correlated with visual acuity (VA).57,58 Specifically, decreased VA was more associated with decreased vessel area density in the deep capillary plexus. This finding may suggest that the deep retinal capillaries are most affected by diabetic macular ischemia. In fact, decreased DCP perfusion has been reported to be correlated with macular photoreceptor and outer retinal degeneration, confirming the role of the DCP in providing blood flow to the outer retina when choriocapillaris perfusion is compromised.59 Macular vessel length density along with FAZ circularity has also been found to be highly correlated with macular ganglion cell/inner plexiform layer (mGCIPL) thinning as a proxy for inner retinal layer thinning.18,60 Together, this data suggests that vascular changes in DR are associated with neuroretinal degeneration. Vasculature loss in the DCP may be directly related to functional vision loss and therefore, macular vessel density calculations in the DCP could be used as an objective measure of DR progression.57 Another study has corroborated the finding of decreased macular vessel area density in the DCP of patients with diabetes and no DR in addition to enlarged FAZ area in the SCP, further emphasizing that DCP changes may play an important role in the development of even subclinical DR.61
Additionally, macular vessel area and skeletonized vessel density have been shown to be negatively correlated with DR severity,40,62–64 with temporal perifoveal SCP vessel area density and temporal parafoveal and foveal DCP vessel area density found to be among the best metrics to characterize the different stages of DR.65,66 In addition to differentiating between patients with different stages of DR, macular vessel density measurements can help predict progression of DR in patients with diabetes. A recent study reported that decreased macular vessel area density in the DCP results in increased risk of DR worsening whereas decreased SCP vessel area density results in increased risk of DME development.67
Macular vessel density in DR may also be associated with disorganization of inner retinal layers (DRIL). DRIL can be identified on optical coherence tomography (OCT) and occurs when ganglion cell-inner plexiform layer complex, inner nuclear layer and outer plexiform layer boundaries become indistinct. This OCT metric has been shown to predict visual acuity in patients with DME.68 Because microvasculature dropout can cause inner retinal layer dysfunction, DRIL has also been reported to be a predictor of nonperfusion in eyes with DR.69 Additionally, patients with DR and DRIL, including those with resolved DME, were found to have decreased superficial macular vessel area density when compared to these patients without DRIL.70,71 Areas with DRIL were also found to have greater disruption of photoreceptor layers.71 This suggests that macular ischemia in the superficial capillary plexus due to DR can lead to inner retinal layer pathology and eventually, visual acuity loss.
Finally, in addition to visual acuity, other functional parameters have been shown to be associated with macular vessel density in DR. Using microperimetry, it has been reported that retinal sensitivity is correlated with deep perifoveal vessel area density in patients with varying severities of DR.56 Additionally, when DR patients were followed for one-year, retinal sensitivity was also discovered to be correlated with larger decreases in SCP vessel area density.72 This suggests that SCP vessel area density changes could predict functional loss in DR patients, making macular vessel density an important parameter to monitor.
Other vascular metrics such as FAZ area have also been shown to be related to DR severity. However, many different factors such as gender and age play a role in this metric, making it not very specific. Likewise, the FAZ vasculature changes have been noted to happen in the later stages of DR making it an unreliable metric for screening purposes compared to macular vessel density.64 Decreased fractal dimension, which measures the complexity of retinal vasculature branching; increased avascular area, which measures the non-perfused area of an area of interest; and increased intercapillary area, which measures vessel spacing are other vascular metrics that have all been shown to be associated with diabetic retinopathy.13,40,73 Like vessel density, these parameters have all been found to be sensitive in assessing vascular changes in diabetic retinopathy. Unlike vessel density, these parameters are less dependent on factors such as signal strength and image artifact.73–75 This suggests that it may be important to utilize a combination of these metrics in order to fully understand disease pathophysiology.
Limitations and Future Directions of Macular Vessel Density Measurements in Diabetic Retinopathy
Although macular vessel density measurements have provided valuable insight into the pathophysiology of diabetic retinopathy, this measurement does have some limitations. OCTA itself is privy to image artifacts and automated segmentation errors, specifically when DME is present, as noted above.50–54,76 Additionally, many different OCTA devices exist and macular vessel density values from different devices are not comparable.21,22,39 Therefore, it is generally recommended that the same type of device be used for longitudinal follow-up of vessel density in the same patient. Also, since not all clinical sites have the same machine, this calculation has not yet seen widespread adoption as a metric in clinical trials and thus for clinical use.
Moreover, macular vessel density may not be the only important vessel density measurement to quantitatively evaluate DR. Peripapillary vessel area and vessel length density measurements should also be considered when evaluating DR as these metrics has been shown to be negatively correlated with DR severity and associated with mGCIPL and peripapillary retinal nerve fiber layer (pRNFL) thickness.77 Similarly, temporal peripapillary vessel area density has been reported to be a predictor of DR progression.35 Earlier peripapillary SCP vessel length density findings compared to macular vessel density findings have also been shown in diabetic patients.78 This suggests that macular and peripapillary vessel density measurements could be used in conjunction for clinical assessment of diabetic patients.
In addition to macular and peripapillary vessel density, other metrics have been shown to predict DR progression and clinical outcomes as well. Specifically, FAZ area and fractal dimension in the DCP have been reported as DR progression predictors.68 FAZ area, fractal dimension and average vascular caliber have also been found to correlate with DR severity, making these metrics useful for DR diagnosis.40,47
These findings suggest that macular vessel density is one measurement among other imaging features that can help improve a predictive or diagnostic algorithm for patients with diabetes. Artificial intelligence (AI) has become prominent in the field of ophthalmology and especially retina. Currently, there is an AI-based algorithm incorporating the use of fundus photographs that has been approved for identification of greater than mild DR with 87.4% accuracy.79 Additionally, a 94.3% accuracy has been reported in automated diagnosis of non-proliferative DR in a machine-learning algorithm incorporating blood vessel density, blood vessel caliber and FAZ area from OCTA images.80 Macular vessel density may serve as one piece of the algorithmic puzzle in combination with multiple other imaging features in the future. By using such an algorithm, clinicians will be able to incorporate macular vessel density measurements as a way to identify patients that are at increased risk for developing or progressing with DR and initiate more frequent follow-up visits and closer monitoring.
Conclusion
Macular vessel density is an important measurement that can provide invaluable information about the vasculature changes in DR. Although few limitations do exist, this calculation allows for the quantitative and objective monitoring of vascular changes in DR and aids in the understanding of DR pathophysiology. In the future, this metric could be utilized among other features in AI to predict DR progression clinical settings. Therefore, it is important to accurately measure macular vessel density and understand its usefulness in patients with DR.
Disclosure
Dr Nadia K Waheed reports grants from Research to Prevent Blindness, during the conduct of the study; personal fees, non-financial support from Nidek, personal fees, non-financial support from Carl Meditec Zeiss, non-financial support from Heidelberg, personal fees from Topcon, and non-financial support from Optovue, outside the submitted work. The authors report no other conflicts of interest in this work.
References
1. Ogurtsova K, da Rocha Fernandes JD, Huang Y, et al. IDF diabetes atlas: global estimates for the prevalence of diabetes for 2015 and 2040. Diabetes Res Clin Pract. 2017;128:40–50. doi:10.1016/j.diabres.2017.03.024
2. Antonetti DA, Klein R, Gardner TW. Diabetic retinopathy. N Engl J Med. 2012;366(13):1227–1239. doi:10.1056/NEJMra1005073
3. Cheung N, Mitchell P, Wong TY. Diabetic retinopathy. Lancet. 2010;376(9735):124–136. doi:10.1016/S0140-6736(09)62124-3
4. Gupta P, Gan A, Man R, et al. Impact of incidence and progression of diabetic retinopathy on vision-specific functioning. Ophthalmology. 2018;125:1401–1409. doi:10.1016/j.ophtha.2018.02.011
5. Early Treatment Diabetic Retinopathy Study Research Group. Grading diabetic retinopathy from stereoscopic color fundus photographs–an extension of the modified Airlie House classification. ETDRS report number 10. Ophthalmology. 1991;98(5 Suppl):786–806.
6. Stitt A, Curtis T, Chen M, et al. The progress in understanding and treatment of diabetic retinopathy. Prog Retin Eye Res. 2015;51:156–186.
7. Early Treatment Diabetic Retinopathy Study Research Group. Grading diabetic retinopathy from stereoscopic color fundus photographs – an extension of the modified airlie house classification. Ophthalmology. 1991;98:786–806.
8. Wilkinson CP, Ferris FL
9. Cole E, Novais E, Louzada R, et al. Contemporary retinal imaging techniques in diabetic retinopathy: a review. Clin Experiment Ophthalmol. 2016;44:289–299. doi:10.1111/ceo.12711
10. Spaide R, Fujimoto J, Waheed K, et al. Optical coherence tomography angiography. Prog Retin Eye Res. 2018;64:1–55.
11. de Carlo T, Romano A, Waheed N, et al. A review of optical coherence tomography angiography (OCTA). Int J Retina Vitreous. 2015;1:1–15. doi:10.1186/s40942-015-0005-8
12. Spaide RF, Klancnik JM, Cooney MJ. Retinal vascular layers imaged by fluorescein angiography and optical coherence tomography angiography. JAMA Ophthalmol. 2015;133(1):45–50. doi:10.1001/jamaophthalmol.2014.3616
13. Zhu TP, Li EH, Li JY, et al. Comparison of projection-resolved optical coherence tomography angiography-based metrics for the early detection of retinal microvascular impairments in diabetes mellitus. Retina. 2020;40(9):1783–1792. doi:10.1097/IAE.0000000000002655
14. Ishibazawa A, Nagaoka T, Takahashi A, et al. Optical coherence tomography angiography in diabetic retinopathy: a prospective pilot study. Am J Ophthalmol. 2015;160(1):35–44. doi:10.1016/j.ajo.2015.04.021
15. Hwang T, Jia Y, Gao S, et al. Optical coherence tomography angiography features of diabetic retinopathy. Retina. 2015;35(11):2371–2376. doi:10.1097/IAE.0000000000000716
16. Nagiel A, Sadda SR, Sarraf D. A promising future for optical coherence tomography angiography. JAMA Ophthalmol. 2015;133:629–630. doi:10.1001/jamaophthalmol.2015.0668
17. Alam M, Zhang Y, Lim J, et al. Quantitative optical coherence tomography angiography features for objective classification and staging of diabetic retinopathy. Retina. 2020;40(2):322–332. doi:10.1097/IAE.0000000000002373
18. Kim K, Kim E, Yu S. Optical coherence tomography angiography analysis of foveal microvascular changes and inner retinal layer thinning in patients with diabetes. Br J Ophthalmol. 2018;102(9):1226–1231. doi:10.1136/bjophthalmol-2017-311149
19. Rodrigues T, Marques J, Soares M, et al. Macular OCT-angiography parameters to predict the clinical stage of nonproliferative diabetic retinopathy: an exploratory analysis. Eye (Lond). 2019;33(8):1240–1247.
20. Tang F, Ng D, LamA et al. Determinants of quantitative optical coherence tomography angiography metrics in patients with diabetes. Sci Rep. 2017;7:1–15. doi:10.1038/s41598-016-0028-x
21. Arya M, Rebhun CB, Alibhai AY, et al. Parafoveal retinal vessel density assessment by optical coherence tomography angiography in healthy eyes. Ophthalmic Surg Lasers Imaging Retina. 2018;49(10):S5–S17. doi:10.3928/23258160-20180814-02
22. Lei J, Pei C, Wen C, Abdelfattah NS. Repeatability and reproducibility of quantification of superficial peri-papillary capillaries by four different optical coherence tomography angiography devices. Sci Rep. 2018;8(1):17866. doi:10.1038/s41598-018-36279-2
23. Sorour O, Arya M, Waheed N. New findings and challenges in OCT angiography for diabetic retinopathy. Ann Eye Sci. 2018;3:44. doi:10.21037/aes.2018.08.03
24. Chu Z, Lin J, Gao C, et al. Quantitative assessment of the retinal microvasculature using optical coherence tomography angiography. J Biomed Opt. 2016;21(6):66008. doi:10.1117/1.JBO.21.6.066008
25. Al-Sheikh M, Falavarjani KG, Tepelus TC, Sadda SR. Quantitative comparison of swept-source and spectral-domain OCT angiography in healthy eyes. Ophthalmic Surg Lasers Imaging Retina. 2017;48(5):385–391. doi:10.3928/23258160-20170428-04
26. Jo YH, Sung KR, Shin JW. Effects of age on peripapillary and macular vessel density determined using optical coherence tomography angiography in healthy eyes. Invest Ophthalmol Vis Sci. 2019;60(10):3492–3498. doi:10.1167/iovs.19-26848
27. Moghimi S, Zangwill LM, Penteado RC, et al. Macular and optic nerve head vessel density and progressive retinal nerve fiber layer loss in glaucoma. Ophthalmology. 2018;125(11):1720–1728. doi:10.1016/j.ophtha.2018.05.006
28. Su L, Li Q, Zhu L, et al. Characterisation of macular superficial vessel density alteration in preclinical ethambutol-induced optic neuropathy using optical coherence tomography angiography. Br J Ophthalmol. 2020. doi:10.1136/bjophthalmol-2020-317742
29. You Q, Freeman WR, Weinreb RN, et al. Reproducibility of vessel density measurement with optical coherence tomography angiography in eyes with and without retinopathy. Retina. 2017;37(8):1475–1482. doi:10.1097/IAE.0000000000001407
30. Nobuyuki O. A threshold selection method from gray-level histograms. IEEE Trans Sys Man Cybern. 1979;9(1):62–66. doi:10.1109/TSMC.1979.4310076
31. Phansalkar N, More S, Sabale A, Joshi M. Adaptive local thresholding for detection of nuclei in diversity-stained cytology images. Proc IEEE Int Conf Comm Signal Process. 2011;218–220.
32. Mehta N, Braun PX, Gendelman I, et al. Repeatability of binarization thresholding methods for optical coherence tomography angiography image quantification. Sci Rep. 2020;10(1):15368. doi:10.1038/s41598-020-72358-z
33. Al-Sheikh M, Akil H, Pfau M, Sadda SR. Swept-source OCT angiography imaging of the foveal avascular zone and macular capillary network density in diabetic retinopathy. Invest Ophthalmol Vis Sci. 2016;57(8):3907–3913. doi:10.1167/iovs.16-19570
34. Chen Q, Ma Q, Wu C, et al. Macular vascular fractal dimension in the deep capillary layer as an early indicator of microvascular loss for retinopathy in type 2 diabetic patients. Invest Ophthalmol Vis Sci. 2017;58:3785–3794. doi:10.1167/iovs.17-21461
35. Custo Greig E, Brigell M, Cao F, et al. Macular and peripapillary optical coherence tomography angiography metrics predict progression in diabetic retinopathy: a Sub-analysis of TIME-2b study data. Am J Ophthalmol. 2020;219:66–76. doi:10.1016/j.ajo.2020.06.009
36. Lei J, Durbin MK, Shi Y, et al. Repeatability and reproducibility of superficial macular retinal vessel density measurements using optical coherence tomography angiography en face images. JAMA Ophthalmol. 2017;135(10):1092–1098. doi:10.1001/jamaophthalmol.2017.3431
37. Coscas F, Sellam A, Glacet-Bernard A, et al. Normative data for vascular density in superficial and deep capillary plexuses of healthy adults assessed by optical coherence tomography angiography. Invest Ophthalmol Vis Sci. 2016;57(9):OCT211–OCT223. doi:10.1167/iovs.15-18793
38. Pedinielli A, Bonnin S, Sanharawi ME, et al. Three different optical coherence tomography angiography measurement methods for assessing capillary density changes in diabetic retinopathy. Ophthalmic Surg Lasers Imaging Retina. 2017;48(5):378–384. doi:10.3928/23258160-20170428-03
39. Levine ES, Arya M, Chaudhari J, et al. Repeatability and reproducibility of vessel density measurements on optical coherence tomography angiography in diabetic retinopathy. Graefe’s Arch Clin Exp Ophthalmol. 2020;258(8):1685–1687. doi:10.1007/s00417-020-04716-6
40. Kim AY, Chu Z, Shahidzadeh A, et al. Quantifying microvascular density and morphology in diabetic retinopathy using spectral-domain optical coherence tomography angiography. Invest Ophthalmol Vis Sci. 2016;57(9):OCT362–70. doi:10.1167/iovs.15-18904
41. Ashraf M, Sampani K, Abu-Qamar O, et al. Optical coherence tomography angiography projection artifact removal: impact on capillary density and interaction with diabetic retinopathy severity. Transl Vis Sci Technol. 2020;9(7):10. doi:10.1167/tvst.9.7.10
42. Borrelli E, Sadda SR, Uji A, Querques G. Pearls and Pitfalls of optical coherence tomography angiography imaging: a review. Ophthalmol Ther. 2019;8(2):215–226. doi:10.1007/s40123-019-0178-6
43. Czakó C, István L, Ecsedy M, et al. The effect of image quality on the reliability of OCT angiography measurements in patients with diabetes. Int J Retina Vitreous. 2019;5:46. doi:10.1186/s40942-019-0197-4
44. Greig EC, Duker JS, Waheed NK. A practical guide to optical coherence tomography angiography interpretation. Int J Retina Vitreous. 2020;6(1):55. doi:10.1186/s40942-020-00262-9
45. Yu JJ, Camino A, Liu L, et al. Signal strength reduction effects in OCT angiography. Ophthalmol Retina. 2019;3(10):835–842. doi:10.1016/j.oret.2019.04.029
46. Sampson DM, Gong P, An D, et al. Axial length variation impacts on superficial retinal vessel density and foveal avascular zone area measurements using optical coherence tomography angiography. Invest Ophthalmol Vis Sci. 2017;58:3065–3072. doi:10.1167/iovs.17-21551
47. Hirano T, Kitahara J, Toriyama Y, et al. Quantifying vascular density and morphology using different swept-source optical coherence tomography angiographic scan patterns in diabetic retinopathy. Br J Ophthalmol. 2019;103(2):216–221. doi:10.1136/bjophthalmol-2018-311942
48. Rabiolo A, Gelormini F, Marchese A, et al. Macular perfusion parameters in different angiocube sizes: does the size matter in quantitative optical coherence tomography angiography? Invest Ophthalmol Vis Sci. 2018;59(1):231–237. doi:10.1167/iovs.17-22359
49. Rabiolo A, Gelormini F, Sacconi R, et al. Comparison of methods to quantify macular and peripapillary vessel density in optical coherence tomography angiography. PLoS One. 2018;13(10):e0205773. doi:10.1371/journal.pone.0205773
50. Ghasemi Falavarjani K, Habibi A, Anvari P, et al. Effect of segmentation error correction on optical coherence tomography angiography measurements in healthy subjects and diabetic macular oedema. Br J Ophthalmol. 2020;104(2):162–166. doi:10.1136/bjophthalmol-2019-314018
51. Hirano T, Chanwimol K, Weichsel J, et al. Distinct retinal capillary plexuses in normal eyes as observed in optical coherence tomography angiography axial profile analysis. Sci Rep. 2018;8(1):9380. doi:10.1038/s41598-018-27536-5
52. Spaide RF, Fujimoto JG, Waheed NK. Image artifacts in optical coherence tomography angiography. Retina. 2015;35(11):2163–2180. doi:10.1097/IAE.0000000000000765
53. Holmen IC, Konda SM, Pak JW, et al. Prevalence and severity of artifacts in optical coherence tomographic angiograms. JAMA Ophthalmol. 2020;138(2):119–126. doi:10.1001/jamaophthalmol.2019.4971
54. Alibhai AY, De Pretto LR, Moult EM, et al. Quantification of retinal capillary nonperfusion in diabetics using wide-field optical coherence tomography angiography. Retina. 2020r;40(3):412–420. doi:10.1097/IAE.0000000000002403
55. De Pretto LR, Moult EM, Alibhai AY, et al. Controlling for artifacts in widefield optical coherence tomography angiography measurements of non-perfusion area. Sci Rep. 2019;9(1):9096. doi:10.1038/s41598-019-43958-1
56. Ash T, Atl G, Dsw T, et al. Diabetic macular ischemia: correlation of retinal vasculature changes by optical coherence tomography angiography and functional deficit. Retina. 2020;40(11):2184–2190. doi:10.1097/IAE.0000000000002721
57. Dupas B, Minvielle W, Bonnin S, et al. Association between vessel density and visual acuity in patients with diabetic retinopathy and poorly controlled Type 1 diabetes. JAMA Ophthalmol. 2018;136(7):721–728. doi:10.1001/jamaophthalmol.2018.1319
58. Samara WA, Shahlaee A, Adam MK, et al. Quantification of diabetic macular ischemia using optical coherence tomography angiography and its relationship with visual acuity. Ophthalmology. 2017;124(2):235–244. doi:10.1016/j.ophtha.2016.10.008
59. Scarinci F, Nesper PL, Fawzi AA. Deep retinal capillary nonperfusion is associated with photoreceptor disruption in diabetic macular ischemia. Am J Ophthalmol. 2016;168:129–138. doi:10.1016/j.ajo.2016.05.002
60. Tang FY, Ng DS, Lam A, et al. Determinants of quantitative optical coherence tomography angiography metrics in patients with diabetes. Sci Rep. 2017;7(1):2575. doi:10.1038/s41598-017-02767-0
61. Furino C, Montrone G, Cicinelli MV, et al. Optical coherence tomography angiography in diabetic patients without diabetic retinopathy. Eur J Ophthalmol. 2020;30(6):1418–1423. doi:10.1177/1120672119895701
62. Lavia C, Couturier A, Erginay A, et al. Reduced vessel density in the superficial and deep plexuses in diabetic retinopathy is associated with structural changes in corresponding retinal layers. PLoS One. 2019;14:7. doi:10.1371/journal.pone.0219164
63. Ryu G, Kim I, Sagong M. Topographic analysis of retinal and choroidal microvasculature according to diabetic retinopathy severity using optical coherence tomography angiography. Graefes Arch Clin Exp Ophthalmol. 2020;259(1):61–68. doi:10.1007/s00417-020-04785-7
64. Shen C, Yan S, Du M, et al. Assessment of capillary dropout in the superficial retinal capillary plexus by optical coherence tomography angiography in the early stage of diabetic retinopathy. BMC Ophthalmol. 2018;18(1):113. doi:10.1186/s12886-018-0778-2
65. Li X, Xie J, Zhang L, et al. Identifying microvascular and neural parameters related to the severity of diabetic retinopathy using optical coherence tomography angiography. Invest Ophthalmol Vis Sci. 2020;61(5):39. doi:10.1167/iovs.61.5.39
66. Rodrigues TM, Marques JP, Soares M, et al. Macular OCT-angiography parameters to predict the clinical stage of nonproliferative diabetic retinopathy: an exploratory analysis. Eye (Lond). 2019;33(8):1240–1247.
67. Sun Z, Tang F, Wong R, et al. OCT angiography metrics predict progression of diabetic retinopathy and development of diabetic macular edema: a prospective study. Ophthalmology. 2019;126(12):1675–1684. doi:10.1016/j.ophtha.2019.06.016
68. Sun JK, Lin MM, Lammer J, et al. Disorganization of the retinal inner layers as a predictor of visual acuity in eyes with center-involved diabetic macular edema. JAMA Ophthalmol. 2014;132:1309–1316. doi:10.1001/jamaophthalmol.2014.2350
69. Nicholson L, Ramu J, Triantafyllopoulou I, et al. Diagnostic accuracy of disorganization of the retinal inner layers in detecting macular capillary non-perfusion in diabetic retinopathy. Clin Exp Ophthalmol. 2015;43(8):735–741. doi:10.1111/ceo.12557
70. Cennamo G, Montorio D, Fossataro F, Fossataro C, Tranfa F. Evaluation of vessel density in disorganization of retinal inner layers after resolved diabetic macular edema using optical coherence tomography angiography. PLoS One. 2021;16(1):e0244789. doi:10.1371/journal.pone.0244789
71. Onishi AC, Ashraf M, Soetikno BT, Fawzi AA. Multilevel ischemia in disorganization of the retinal inner layers on projection-resolved optical coherence tomography angiography. Retina. 2019;39(8):1588–1594. doi:10.1097/IAE.0000000000002179
72. Tsai ASH, Jordan-Yu JM, Gan ATL, et al. Diabetic macular ischemia: influence of optical coherence tomography angiography parameters on changes in functional outcomes over one year. Invest Ophthalmol Vis Sci. 2021;62(1):9. doi:10.1167/iovs.62.1.9
73. You QS, Wang J, Guo Y, et al. Optical coherence tomography angiography avascular area association with 1-year treatment requirement and disease progression in diabetic retinopathy. Am J Ophthalmol. 2020;217:268–277. doi:10.1016/j.ajo.2020.04.024
74. Tey KY, Teo K, Tan ACS, et al. Optical coherence tomography angiography in diabetic retinopathy: a review of current applications. Eye Vis (Lond). 2019;6:37. doi:10.1186/s40662-019-0160-3
75. Bhardwaj S, Tsui E, Zahid S, et al. Value of fractal analysis of optical coherence tomography angiography in various stages of diabetic retinopathy. Retina. 2018;38(9):1816–1823. doi:10.1097/IAE.0000000000001774
76. Tarassoly K, Miraftabi A, Soltan Sanjari M, Parvaresh MM. The relationship between foveal avascular zone area, vessel density, and cystoid changes in diabetic retinopathy: an optical coherence tomography angiography study. Retina. 2018;38(8):1613–1619. doi:10.1097/IAE.0000000000001755
77. Shin YI, Nam KY, Lee SE, et al. Peripapillary microvasculature in patients with diabetes mellitus: an optical coherence tomography angiography study. Sci Rep. 2019;9(1):15814. doi:10.1038/s41598-019-52354-8
78. Vujosevic S, Muraca A, Gatti V, et al. Peripapillary microvascular and neural changes in diabetes mellitus: an OCT-angiography study. Invest Ophthalmol Vis Sci. 2018;59(12):5074–5081. doi:10.1167/iovs.18-24891
79. Schmidt-Erfurth U, Sadeghipour A, Gerendas BS, Waldstein SM, Bogunović H. Artificial intelligence in retina. Prog Retin Eye Res. 2018;67:1–29. doi:10.1016/j.preteyeres.2018.07.004
80. Sandhu HS, Eladawi N, Elmogy M, et al. Automated diabetic retinopathy detection using optical coherence tomography angiography: a pilot study. Br J Ophthalmol. 2018;102:1564–1569. doi:10.1136/bjophthalmol-2017-311489
 © 2021 The Author(s). This work is published and licensed by Dove Medical Press Limited. The
full terms of this license are available at https://www.dovepress.com/terms
and incorporate the Creative Commons Attribution
- Non Commercial (unported, 3.0) License.
By accessing the work you hereby accept the Terms. Non-commercial uses of the work are permitted
without any further permission from Dove Medical Press Limited, provided the work is properly
attributed. For permission for commercial use of this work, please see paragraphs 4.2 and 5 of our Terms.
© 2021 The Author(s). This work is published and licensed by Dove Medical Press Limited. The
full terms of this license are available at https://www.dovepress.com/terms
and incorporate the Creative Commons Attribution
- Non Commercial (unported, 3.0) License.
By accessing the work you hereby accept the Terms. Non-commercial uses of the work are permitted
without any further permission from Dove Medical Press Limited, provided the work is properly
attributed. For permission for commercial use of this work, please see paragraphs 4.2 and 5 of our Terms.