Back to Journals » Clinical Ophthalmology » Volume 12
Macular microstructure and visual acuity after macula-off retinal detachment repair by 23-gauge vitrectomy plus silicone endotamponade
Authors Saber EE, Bayoumy ASM, Elmohamady MN ![]() , Faramawi HM
, Faramawi HM
Received 27 July 2018
Accepted for publication 21 August 2018
Published 12 October 2018 Volume 2018:12 Pages 2005—2013
DOI https://doi.org/10.2147/OPTH.S181595
Checked for plagiarism Yes
Review by Single anonymous peer review
Peer reviewer comments 2
Editor who approved publication: Dr Scott Fraser
Essam Elmatbouly Saber, Ahmed Sherin Mostafa Bayoumy, Mohamed Nagy Elmohamady, Hussam Mustafa Faramawi
Department of Opthalmology, Faculty of Medicine, Benha University, Qaliopia, Egypt
Objectives: To study the macular microstructural changes and their relationship to visual acuity (VA) following primary vitrectomy and silicone tamponade for retinal detachment.
Patients and methods: A total of 40 cases with macula-off rhegmatogenous retinal detachment underwent 23-gauge vitrectomy with silicone oil tamponade. Cases with open globe injury and other ocular pathology were excluded. Optical coherence tomography (OCT) imaging of the macula was done about 3 and 6 months postoperatively. OCT macular microstructural changes were recorded and correlated to VA.
Results: A total of 36 eyes were evaluated by statistical analysis. The best-corrected VA (BCVA) improved in 35 patients (97.2%) and remained unchanged in one patient (2.8%). Patients were divided into two groups based on 6-month postoperative BCVA: group I with 6-month postoperative BCVA of <1 LogMAR and group II with 6-month postoperative BCVA of ≥1 LogMAR. No disruption of retinal microstructure occurred in 70% of cases in group I. Mild disruption was found in 30% of group I and 25% of group II, whereas severe disruption was found in 75% of group II cases. Epiretinal membrane formed early in three eyes in group II and late in two eyes in group I.
Conclusion: Macular microstructural changes detected by OCT is directly correlated to visual outcomes of retinal detachment repair.
Keywords: retinal detachment, vitrectomy, silicone oil, OCT, ellipsoid zone, ERM
Introduction
Retinal detachment initiates extensive remodeling of both neurons and glia, where both molecular and morphological changes can be identified in retinal cells. The outer neural retinal layers are mainly affected, where all rod and cone outer segments are significantly shorter and distorted with disoriented discs by 24–72 hours following detachment.1 The retinal photoreceptors follow a pattern of apoptosis evidenced by a significant number of apoptotic cells localized to the outer nuclear layer of the retina.2 Cell death in the photoreceptor cell layer is likely to be a significant factor in visual recovery after reattachment, particularly in detachments of more than a few days duration.3 Nonetheless, clinical experience is that once the macula is detached, vision does not return to what it was before detachment even following anatomical surgical success. This indicates that some changes persist.4
The advancement in optical coherence tomography (OCT) in recent years has allowed retinal images with a higher level of resolution. Spectral-domain OCT (SD-OCT) provided unprecedented details of retinal microstructural changes associated with various retinal conditions, such as macular hole, diabetic macular edema, and age-related macular degeneration. The integrity of the photoreceptor layer has gained much interest because of its close correlation with visual function.5
Thus, the aim of this work was to study the structure–function relationship following primary vitrectomy for rhegmatogenous retinal detachment (RRD) by correlating postoperative findings on SD-OCT and postoperative best-corrected visual acuity (BCVA).
Patients and methods
This prospective, interventional, nonrandomized case series was approved by the research ethics committee of Benha University Hospitals, and all procedures were done in accordance with the Declaration of Helsinki. Forty eyes of 40 patients with RRD (macula-off) were included. We excluded eyes with open globe injury, preexisting macular pathology, RRD with proliferative vitreoretinopathy (PVR) ≥ C2, recurrent RD following a previously failed retinal reattachment surgery, significant postoperative media opacities interfering with the OCT imaging, uveitis, glaucoma or retinal vascular occlusive diseases, pathological optic nerve changes, and patients with a history of ocular surgery other than cataract surgery.
Surgery
A written informed consent was obtained from every patient. All patients underwent primary 23-gauge pars plana vitrectomy (PPV), with silicon oil tamponade, and phacoemulsification and intraocular lens implantation done in phakic cases >50 years and in cases with cataractous lens. All surgeries were done by the same surgeon (MNE).
Imaging
OCT was done at 1–3 months after surgery and at 6 months postoperatively before silicone removal using Topcon 3D OCT-2000 FA, Japan “version 8.30.” In all patients, the standard macular thickness map scan protocol was used and monitored with an infrared-sensitive video camera. Scan quality was assessed during scanning to maximize the quality of the scans and minimize problems, such as decentration and focus. Poor scans were repeated until best scans were obtained. 5-crossline scans of the macula, centered on the fovea, were acquired, and the status of the ellipsoid zone (EZ) and external limiting membrane (ELM) was judged in the images as disrupted or complete. The outer nuclear layer thickness (ONLT) was taken as the distance between the internal limiting membrane (ILM) and the ELM at the fovea as described. The fovea was identified on the line by the point of deepest excavation of the foveal contour and was measured with the computerized caliper function while keeping the caliper perpendicular to the ELM. This measurement process was repeated three times and an average was calculated. All scans were done by the same operator (HMF).
Statistical analysis
Data management and statistical analysis were done using SPSS vs 25. Numerical data were summarized as mean and SDs or medians and ranges. Categorical data were summarized as numbers and percentages. OCT findings and other categorical variables were compared using a chi-squared test or Fisher’s exact test if appropriate. Numerical variables were compared using Mann–Whitney U-test. Average thickness, center thickness, total volume, and ONLT were compared in operated and fellow eyes using the Wilcoxon signed-rank test. Correlations were done between 6-month postoperative BCVA in LogMAR and the ONLT and the presence of inner segment/outer segment and ELM disruption using Spearman correlation. r is the correlation coefficient. Also, correlations were made between average thickness, center thickness and total volume, and 6-month postoperative BCVA in LogMAR. It ranged from −1 to +1, with −1 indicating strong negative correlation, +1 indicating strong positive correlation, and 0 indicating no correlation. All P-values were two sided. A P-value <0.05 was considered significant.
Compliance with ethics
All procedures were done according to the Declaration of Helsinki. The study was approved by Benha University’s research ethical committee. Written informed consent in Arabic was obtained from all subjects.
Results
Forty eyes of 40 patients were included in this study. Two eyes were excluded due to intraoperative finding of macular hole RD, and two eyes were lost during follow-up. Consequently, 36 eyes were evaluated by statistical analysis. The patients’ age ranged from 14 to 72 years with a mean age value of 49±15. The study included 24 male (66.7%) and 12 female (33.3%) patients. Regarding the underlying risk factor for RRD, 19 patients had a history of trauma (52.8%), eight with previous cataract surgery and no history of trauma (22.2%), and nine with myopia and no history of trauma (25%). All our cases had macula-off RD and so preoperative visual acuity (VA) was hand motion in all cases. The duration of macula-off RD ranged from 5 to 34 days before surgery.
All patients achieved complete postoperative reattachment with 100% single operation success rate. The mean 6-month postoperative BCVA (LogMAR) was 0.97±0.5 and the median was 0.8 in a range of 0.3–2. The BCVA improved in 35 patients (97.2%) and remained unchanged in one patient (2.8%). The greatest visual outcome achieved was LogMAR of 0.3, which occurred in six patients (16.7%).
For statistical analysis, the patients were divided into two groups based on 6-month postoperative BCVA (Table 1):
 | Table 1 Age, gender, and duration of RD in groups I and II |
- Group I with 6-month postoperative BCVA of <1 LogMAR.
- Group II with 6-month postoperative BCVA of ≥1 LogMAR.
There was no statistically significant difference between the two groups for age and gender. But, there was a statistically significant difference between the two groups in the duration of RD (Table 1).
OCT was performed at <3 months postoperative and ≥6 months postoperative with the following findings (Tables 2 and 3):
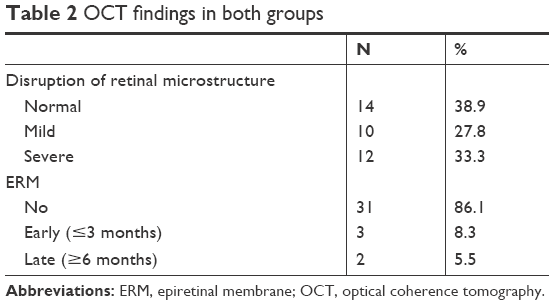 | Table 2 OCT findings in both groups |
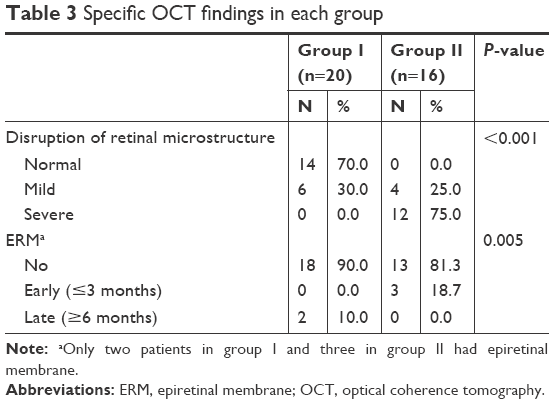 | Table 3 Specific OCT findings in each group |
The degree of disruption to retinal microstructures at 6 months postoperative was graded as:
- Normal: No disruption in the EZ or the ELM (Figure 1).
- Mild disruption: Disruption of the EZ with normal ELM (Figure 2).
- Severe disruption: Combined disruption of the EZ and ELM (Figure 3).
 | Figure 1 No disruption in the EZ or the ELM. |
 | Figure 2 Disruption of EZ with normal ELM. |
 | Figure 3 Combined disruption of the EZ and ELM. |
The development of epiretinal membrane was classified into:
- Early epiretinal membrane: Developed at ≤3 months (Figure 4).
- Late epiretinal membrane: Developed at ≥6 months (Figure 5).
 | Figure 4 Early ERM ≤3 months with CME. |
 | Figure 5 Late ERM >6 months with CME. |
There was statistically significant difference between group I and group II regarding postoperative OCT findings. As shown in Table 1, the degree of disruption of the retinal microstructure was mild to normal in 100% in group I compared with 25% in group II (P<0.001). Also, the presence of early epiretinal membrane was 100% in group II compared with 0% in group I (P=0.005).
The degree of recovery of retinal thickness was compared between the operated and the fellow eyes. Cases with epiretinal membrane were excluded. We compared each eye with regard to the macular thickness profile, including central thickness, average thickness, and total volume together with the manual measurement of the ONLT (distance between the ELM and ILM) in both groups (Tables 4 and 5).
 | Table 4 OCT parameters of cases with no ERM and with mild-to-moderate disruption |
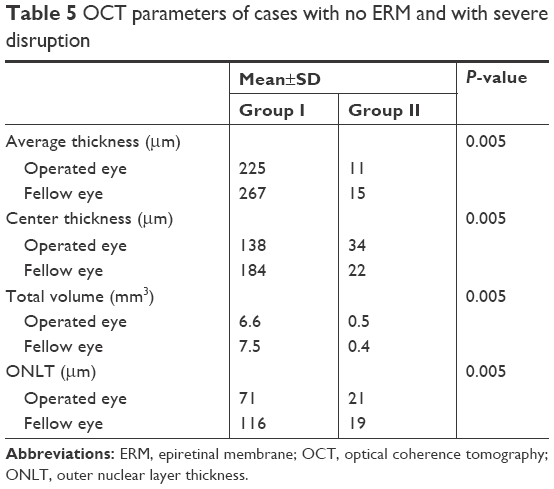 | Table 5 OCT parameters of cases with no ERM and with severe disruption |
Both tables showed statically significant retinal thinning in both groups in all parameters between the operated eye and the fellow eye. By comparing the difference between the operated eyes only from each group, the difference also was statistically significant (Table 6).
 | Table 6 Comparison of macular thickness and ONLT between operated eyes with no ERM from groups I and II |
The 6-month postoperative LogMAR BCVA was found to be significantly correlated with the degree retinal microstructure disruption (r=0.847, P<0.001) (Figure 6). Also, the 6-month postoperative LogMAR BCVA was found to be significantly negatively correlated with the ONLT (r=−0.586, P=0.002) (Figure 7).
 | Figure 6 Correlation between 6-month postoperative LogMAR BCVA and severity of disruption. |
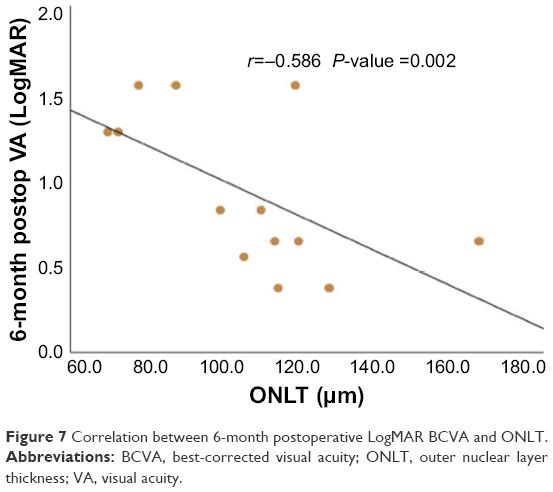 | Figure 7 Correlation between 6-month postoperative LogMAR BCVA and ONLT. |
The 6-month postoperative LogMAR BCVA was found to be significantly negatively correlated with central macular thickness (r=−0.516, P=0.007), average thickness (r=−0.739, P<0.001), and total volume (r=−0.587, P=0.002) (Figures 8–10).
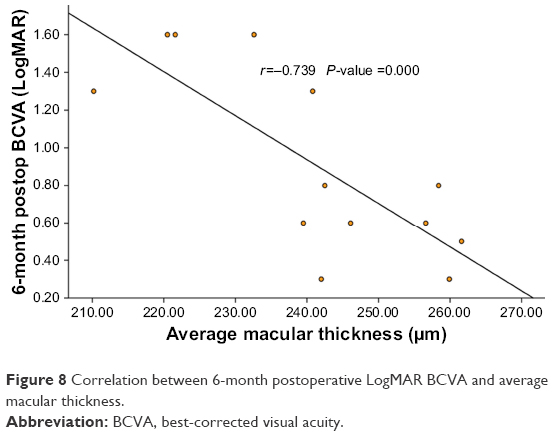 | Figure 8 Correlation between 6-month postoperative LogMAR BCVA and average macular thickness. |
 | Figure 9 Correlation between 6-month postoperative LogMAR BCVA and central macular thickness. |
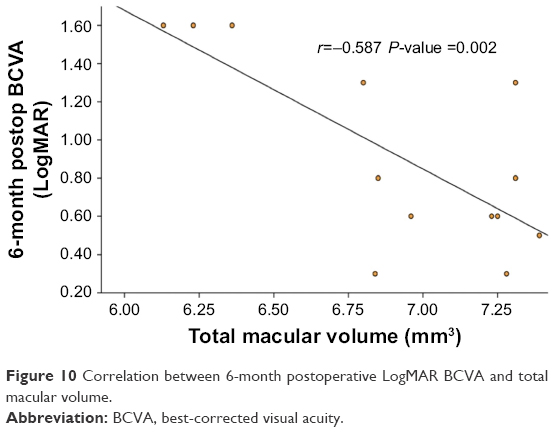 | Figure 10 Correlation between 6-month postoperative LogMAR BCVA and total macular volume. |
Discussion
During the last two decades, there was a significant trend toward more frequently employing primary PPV for the management of primary RRD.6 The percentage of scleral buckle (SB) procedures decreased from 40.5% in 2009 to 2.7% in 2014, whereas PPV increased from 38% in 2009 to >90% in 2014 without any statistically significant difference in visual outcome or the intra- or postoperative complications.7 The anatomical success rates were as high as 95% but was comparable with those achieved with other conventional therapies with most of the studies stating nonstatistically significant difference in the primary reattachment rates between different modalities.8–11
Our results showed complete postoperative reattachment in all patients with 100% single operation success rate and a mean BCVA of 0.97±0.5 LogMAR 6 months following the surgery. Incomplete VA recovery after anatomically successful repair has been attributed to several factors. Our results were lower than those reported by Bezar et al where BCVA after 6 months in macula-off primary RRD was 0.2±0.3 LogMAR.10 However, their study included only cases with pseudophakic RD and used only gas tamponade unlike our study where silicone oil (SO) was used as endotamponade in all cases. Our mean BCVA was comparable with the results obtained by Abdussalam et al when postoperative BCVA was 0.77±0.36 LogMAR in macula-off RD, all cases were macula-off RD, and SO was only used as endotamponade as in this work.12 This explanation may be supported by the results obtained by Christensen and la Cour who evaluated visual loss after using intraocular SO during PPV for RRD. They found that postoperative BCVA was significantly worse in silicone eyes (>6/24) compared with gas eyes (>6/7.5), P=0.005. Three of nine (33%) silicone eyes had final BCVA <6/60 and 67% had final BCVA <6/12. No gas eyes had final BCVA <6/9.13
We found 6-month post-BCVA LogMAR of 0.3 in six patients (16.7%), which was lower than that reported by Wong et al, with 28% achieving BCVA of ≥0.3. His study also included cases with combined PPV and SB. This difference may be due to high percentage of traumatic RD in our study as we had >50% of our cases with traumatic RD.
The formation of postoperative epiretinal membrane (ERM) was reported as a factor that can affect visual outcome after surgery for RRD. The incidence of ERM formation ranges between 6% and 14%, and is variable among different studies as it depends on the surgical technique used. In our study, ERM developed in five out of 36 cases with an incidence of 13.9%. In our study, ERM formed early before 3 months in three patients and late after 6 months in two patients. The correlation between the presence of an ERM and the VA was not consistent in previous studies. Wakabayashi et al14 and Theodossiadis et al15 demonstrated that ERM formation was not a critical factor affecting visual impairment and in cases of ERM formation, the condition of the EZ and ELM was the main factor that predicted final BCVA. On the other hand, Karacorlu et al16 found a significant correlation between ERM formation and postoperative VA; they had only 16.7% of patients with EZ disruption and concluded that just the presence of secondary ERM is the main factor, which influenced postoperative VA. In our study, cases with early development of ERM (≤3 months) had worse BCVA results than those with late development of ERM (≥6 months). This can be explained by the fact that ERM in the early postoperative period may represent a spectrum of PVR which is associated with massive and long-lasting cellular proliferation, including Müller cell gliosis. The hypertrophied and proliferating glial cells fill the spaces left by dying neurons and degenerated axons after RRD and generate the so-called glial scars. Such rigid glial scars may constitute a mechanical obstacle for regenerative axon growth and hence affect the visual outcome in the early postoperative period.17
Even in cases with regular foveal contour postoperatively, the visual outcome was still poor in some patients. The correlation between the disruption of the retinal microstructures, namely the disruption of EZ, ELM and ONL thickness was found to be significantly correlated with the 6-month postoperative BCVA. A positive correlation was found between the degree of severity and 6-month postoperative LogMAR BCVA (r=0.847, P-value <0.001). Wakabayashi et al used similar categorization for the OCT lesions where they divided the postoperative findings in the photoreceptor layer into three subgroups: preserved EZ and ELM, disrupted EZ with intact ELM, and disruptions in both of them. There was a statistically significant difference in postoperative VA among the three groups (r=0.805, P=<0.001). Similar results were also obtained by Abdussalam AM et al12 However, Karacorlu et al had a lower rate of disrupted EZ and/or ELM than the other studies (22.7% vs 40%–82% in most of studies) and found no significant correlation between the status of EZ and postoperative VA in contrast to other studies.16
The ONLT also showed significant correlation with 6-month postoperative LogMAR BCVA (r=−0.586, P=0.002). In our study, the mean thickness of the ONLT was 110±23 compared with 129±19 in the fellow eye in group I and 71±21 compared with 116±19 in the fellow eye in group II. Our measurements were comparable with the results obtained by Dooley et al where the mean ONLT was 103.3±28.9 in the operated eye compared with 119.5±26.8 in the fellow eye.18 Similar findings were obtained by Gharbiya et al,19 where the mean ONLT in the macula-off RD patients was 105±25.2. The correlation between the ONLT and BCVA was also demonstrated by Han and Lee20 (P≤0.001 by univariate regression analysis and P=0.044 by multiple linear regression) and Dooley et al18 where ONLT in the affected eye was significantly and inversely correlated with the final LogMAR BCVA (Pearson’s correlation: r=− 0.65, P=0.006), and Gharbiya et al,19 where the ONLT was strongly correlated with postoperative BCVA (r=0.61, P≤0.001).
Regarding the correlation between the macular thickness profile and postoperative BCVA, our study results showed significant negative correlation between macular thickness profile and LogMAR BCVA in all parameters, including center thickness (r=−0.516, P=0.007), average thickness (r=−0.739, P<0.001), and total volume (r=−0.587, P=0.002). Our results showed similar finding by Sato et al,21 where a significant correlation between the macular thickness and BCVA was found at every time point after vitrectomy for macula-off RRD (r=−0.466, P=0.022). Similar results were also obtained by Kobayashi et al22 and dell’Omo et al.23 On the other hand, Wakabayashi et al failed to demonstrate similar findings and correlation between the foveal thickness and VA outcome.14
In conclusion, macular microstructural changes detected by OCT is directly correlated to visual outcomes of retinal detachment repair.
Data sharing statement
All data are available from the corresponding author upon request.
Acknowledgment
This study is funded by the authors only.
Disclosure
The authors report no conflicts of interest in this work.
References
Lewis GP, Sethi CS, Linberg KA, Charteris DG, Fisher SK. Experimental retinal reattachment: a new perspective. Mol Neurobiol. 2003;28(2):159–176. | ||
Arroyo JG, Yang L, Bula D, Chen DF. Photoreceptor apoptosis in human retinal detachment. Am J Ophthalmol. 2005;139(4):605–610. | ||
Wickham L, Lewis GP, Charteris DG, Fisher SK. Cellular effects of detachment and reattachment on the neural retina and the retinal pigment epithelium. In Ryan SJ (editor-in-chief): Retina, ed 5, Philadelphia, Elsevier, 2013:605p–617p. | ||
Ghazi NG, Green WR. Pathology and pathogenesis of retinal detachment. Eye. 2002;16(4):411–421. | ||
Wong IY, Iu LP, Koizumi H, Lai WW. The inner segment/outer segment junction: what have we learnt so far? Curr Opin Ophthalmol. 2012;23(3):210–218. | ||
Ho JD, Liou SW, Tsai CY, Tsai RJ, Lin HC. Trends and outcomes of treatment for primary rhegmatogenous retinal detachment: a 9-year nationwide population-based study. Eye. 2009;23(3):669–675. | ||
Eibenberger K, Georgopoulos M, Rezar-Dreindl S, Schmidt-Erfurth U, Sacu S. Development of surgical management in primary rhegmatogenous retinal detachment treatment from 2009 to 2015. Curr Eye Res. 2018;43(4):517–525. | ||
Arya AV, Emerson JW, Engelbert M, Hagedorn CL, Adelman RA. Surgical management of pseudophakic retinal detachments: a meta-analysis. Ophthalmology. 2006;113(10):1724–1733. | ||
Soni C, Hainsworth DP, Almony A. Surgical management of rhegmatogenous retinal detachment: a meta-analysis of randomized controlled trials. Ophthalmology. 2013;120(7):1440–1447. | ||
Rezar S, Sacu S, Blum R, Eibenberger K, Schmidt-Erfurth U, Georgopoulos M. Macula-on versus macula-off pseudophakic rhegmatogenous retinal detachment following primary 23-gauge vitrectomy plus endotamponade. Curr Eye Res. 2016;41(4):543–550. | ||
Wong CW, Yeo IY, Loh BK, et al. Scleral buckling versus vitrectomy in the management of macula-off primary rhegmatogenous retinal detachment: a comparison of visual outcomes. Retina. 2015;35(12):2552–2557. | ||
Abdussalam Abdullatif AM, Abdelhakim M, Mortada HA, El-Saied HM. Why poor vision despite an attached retina following primary vitrectomy in Egyptian patients? Semin Ophthalmol. 2018;33(2):253–259. | ||
Christensen UC, La Cour M. Visual loss after use of intraocular silicone oil associated with thinning of inner retinal layers. Acta Ophthalmol. 2012;90(8):733–737. | ||
Wakabayashi T, Oshima Y, Fujimoto H, et al. Foveal microstructure and visual acuity after retinal detachment repair: imaging analysis by Fourier-domain optical coherence tomography. Ophthalmology. 2009;116(3):519–528. | ||
Theodossiadis PG, Theodossiadis GP, Charonis A, Emfietzoglou I, Grigoropoulos VG, Liarakos VS. The photoreceptor layer as a prognostic factor for visual acuity in the secondary epiretinal membrane after retinal detachment surgery: imaging analysis by spectral-domain optical coherence tomography. Am J Ophthalmol. 2011;151(6):973–980. | ||
Karacorlu M, Sayman Muslubas I, Hocaoglu M, Arf S, Ersoz MG. Correlation between morphological changes and functional outcomes of recent-onset macula-off rhegmatogenous retinal detachment: prognostic factors in rhegmatogenous retinal detachment. Int Ophthalmol. 2018;38(3):1275–1283. | ||
Wiedemann P, Yandiev Y, Hui Y-N, Wang Y. Pathogenesis of proliferative vitreoretinopathy. In Ryan SJ (editor-in-chief): Retina, ed 5, Philadelphia, Elsevier, 2013:1640p–1646p. | ||
Dooley I, Treacy M, O’Rourke M, Khaild I, Kilmartin D. Serial spectral domain ocular coherence tomography measurement of outer nuclear layer thickness in rhegmatogenous retinal detachment repair. Curr Eye Res. 2015;40(10):1073–1076. | ||
Gharbiya M, Grandinetti F, Scavella V, et al. Correlation between spectral-domain optical coherence tomography findings and visual outcome after primary rhegmatogenous retinal detachment repair. Retina. 2012;32(1):43–53. | ||
Han KJ, Lee YH. Optical coherence tomography automated layer segmentation of macula after retinal detachment repair. PLoS ONE. 2018;13(5):e0197058. | ||
Sato T, Wakabayashi T, Shiraki N, Sakaguchi H. Retinal thickness in parafoveal subfields and visual acuity after vitrectomy for macula-off rhegmatogenous retinal detachment repair. Graefes Arch Clin Exp Ophthalmol. 2017;255(9):1737–1742. | ||
Kobayashi M, Iwase T, Yamamoto K, et al. Association between photoreceptor regeneration and visual acuity following surgery for rhegmatogenous retinal detachment. Invest Ophthalmol Vis Sci. 2016;57(3):889–898. | ||
dell’Omo R, Viggiano D, Giorgio D, et al. Restoration of foveal thickness and architecture after macula-off retinal detachment repair. Invest Ophthalmol Vis Sci. 2015;56(2):1040–1050. |
 © 2018 The Author(s). This work is published and licensed by Dove Medical Press Limited. The
full terms of this license are available at https://www.dovepress.com/terms
and incorporate the Creative Commons Attribution
- Non Commercial (unported, 3.0) License.
By accessing the work you hereby accept the Terms. Non-commercial uses of the work are permitted
without any further permission from Dove Medical Press Limited, provided the work is properly
attributed. For permission for commercial use of this work, please see paragraphs 4.2 and 5 of our Terms.
© 2018 The Author(s). This work is published and licensed by Dove Medical Press Limited. The
full terms of this license are available at https://www.dovepress.com/terms
and incorporate the Creative Commons Attribution
- Non Commercial (unported, 3.0) License.
By accessing the work you hereby accept the Terms. Non-commercial uses of the work are permitted
without any further permission from Dove Medical Press Limited, provided the work is properly
attributed. For permission for commercial use of this work, please see paragraphs 4.2 and 5 of our Terms.