Back to Journals » International Journal of Nanomedicine » Volume 11
Lysine-functionalized nanodiamonds as gene carriers: development of stable colloidal dispersion for in vitro cellular uptake studies and siRNA delivery application
Authors Alwani S, Kaur R, Michel D, Chitanda J, Verrall R, Karunakaran C, Badea I ![]()
Received 11 July 2015
Accepted for publication 12 September 2015
Published 19 February 2016 Volume 2016:11 Pages 687—702
DOI https://doi.org/10.2147/IJN.S92218
Checked for plagiarism Yes
Review by Single anonymous peer review
Peer reviewer comments 4
Editor who approved publication: Dr Thomas Webster
Saniya Alwani,1 Randeep Kaur,1 Deborah Michel,1 Jackson M Chitanda,2 Ronald E Verrall,3 Chithra Karunakaran,4 Ildiko Badea1
1Drug Design and Discovery Research Group, College of Pharmacy and Nutrition, 2Department of Chemical & Biological Engineering, 3Department of Chemistry, University of Saskatchewan, 4Canadian Light Source, Saskatoon, SK, Canada
Purpose: Nanodiamonds (NDs) are emerging as an attractive tool for gene therapeutics. To reach their full potential for biological application, NDs should maintain their colloidal stability in biological milieu. This study describes the behavior of lysine-functionalized ND (lys-ND) in various dispersion media, with an aim to limit aggregation and improve the colloidal stability of ND-gene complexes called diamoplexes. Furthermore, cellular and macromolecular interactions of lys-NDs are also analyzed in vitro to establish the understanding of ND-mediated gene transfer in cells.
Methods: lys-NDs were synthesized earlier through covalent conjugation of lysine amino acid to carboxylated NDs surface generated through re-oxidation in strong oxidizing acids. In this study, dispersions of lys-NDs were prepared in various media, and the degree of sedimentation was monitored for 72 hours. Particle size distributions and zeta potential measurements were performed for a period of 25 days to characterize the physicochemical stability of lys-NDs in the medium. The interaction profile of lys-NDs with fetal bovine serum showed formation of a protein corona, which was evaluated by size and charge distribution measurements. Uptake of lys-NDs in cervical cancer cells was analyzed by scanning transmission X-ray microscopy, flow cytometry, and confocal microscopy. Cellular uptake of diamoplexes (complex of lys-NDs with small interfering RNA) was also analyzed using flow cytometry.
Results: Aqueous dispersion of lys-NDs showed minimum sedimentation and remained stable over a period of 25 days. Size distributions showed good stability, remaining under 100 nm throughout the testing period. A positive zeta potential of >+20 mV indicated a preservation of surface charges. Size distribution and zeta potential changed for lys-NDs after incubation with blood serum, suggesting an interaction with biomolecules, mainly proteins, and a possible formation of a protein corona. Cellular internalization of lys-NDs was confirmed by various techniques such as confocal microscopy, soft X-ray spectroscopy, and flow cytometry.
Conclusion: This study establishes that dispersion of lys-NDs in aqueous medium maintains long-term stability and also provides evidence that lysine functionalization enables NDs to interact effectively with the biological system to be used for RNAi therapeutics.
Keywords: colloidal stability, particle size, zeta potential, protein corona, diamoplex, microscopy, flow cytometry
Introduction
Diamond nanoparticles (NPs), also called nanodiamonds (NDs), exhibit unique thermal, mechanical, and optoelectronic properties. In recent years, much attention has been focused toward utilizing NDs for biomedical applications. The key feature that makes their utilization so attractive in therapeutics is their innate biocompatible nature at cellular1,2 and organ levels.3 NDs are the most biocompatible member of the carbon nano family1 and show no structural damage, such as fragmentation of the genetic materials,4 and thus can act as efficient gene carriers. Despite several favorable characteristics, the major challenge associated with utilizing NDs for biological applications is the high degree of aggregation, which leads to the formation of extremely tight structures of 100–200 nm in size.5 Unlike other carbon nanomaterials, NDs possess a functionalized surface as a result of their synthesis method. The functional groups present on detonation NDs can facilitate aggregation through van der Waals interactions or hydrogen bonding between adjacent ND crystals.6–8 However, the major cause of aggregation is the graphitic soot formed around the NDs as a result of the detonation process that creates core aggregates.5 These aggregates give rise to several complications in terms of formulation, colloidal stability, and cellular uptake. Several physical methods, such as microbead-, sugar-, or salt-assisted stirred media milling, have been employed to limit aggregation and to produce stable, well-dispersed ND formulations.9,10
To control aggregation and ensure long-term stability of ND dispersions, chemical modification of the surface can be utilized.11–13 Rational functionalization of ND surfaces with different moieties to serve multiple purposes is a relatively new approach. For example, functional groups can be grafted to simultaneously counter aggregation and facilitate binding with small chemical molecules or biomolecules with a purpose to serve as drug, protein, and gene carriers.11,14,15 Utilizing NDs and other carbon nanomaterials for gene delivery is of high interest nowadays due to the advantages of DNA- or siRNA-based therapeutics targeted toward malignant forms of cancer and viral infections like HIV.16–18 In order to synthesize ND-based gene carriers, the aim is to generate a cationic surface, which can electrostatically interact with anionic genetic materials.19,20 Such examples are noncovalent functionalization with polymers like polyethylenimine21 and covalent conjugation of derived organic moieties like triethylammonium groups.22 Introducing protonable biomolecules, including amino acids, peptides, and proteins, on the ND surface is a novel approach for functionalization. Its first application was centered on a physical adsorption, such as coating the ND surface with poly-L-lysine, a polypeptide frequently used as carrier for genetic materials.23 The coating occurs through noncovalent adsorption of chemicals on the NP surface through electrostatic interactions and van der Waals forces. It is easy to achieve but may lead to desorption and competitive displacement of active moieties in complex biological environment, thus compromising the long-term stability of the system.24 To overcome this deficiency, covalent conjugation could permanently immobilize the molecules of interest on the surface and create a controlled and relatively stable functionalized system.25 We demonstrated for the first time that covalent immobilization of basic amino acids, mainly lysine, directly on the ND surface can form diamoplexes with DNA and siRNA and can be used for gene delivery purposes.14 Lysine functionalization imparts a primary amine-rich cationic surface that is capable of binding anionic genetic material and proteins. This concept is modeled on the natural DNA wrapping in the eukaryotic cells by histone proteins, rich in lysine and arginine amino acids forming salt bridges.26 Positive charges on the surface can also aid in cellular uptake through electrostatic interaction with the acidic residues on the mammalian cell membrane. Surface functionalization of NDs with lysine amino acid conjugates is evident through various complimentary techniques reported in our previous publication.14
Previously, we reported that lysine functionalization induced homogeneity of the surface limiting aggregation of NDs in aqueous environment for a short period of time.14 In this study, we had expanded the stability assessment of lysine-functionalized NDs (lys-NDs) in biologically relevant media to an extended time period of 25 days. Moreover, the interactions of lys-NDs with serum proteins were also investigated.
Interaction of NPs with physiological proteins is an extensive area of research, since their random adsorption on NP surfaces can alter formulation properties and carrier stability profiles.27–29 A protein adsorption layer (protein corona) can rapidly evolve as a result of NP interacting with biological fluids and is a critical issue as it can affect the fate of NPs.30–33 Several studies have shown that formation of a protein corona hinders cellular uptake of the NP-gene complexes, leading to diminished biological activity.32,34 However, recently, it has been observed that serum can serve as a dispersant for carbon nanomaterials, without compromising the cellular uptake.35 For example, serum albumin can facilitate cellular uptake of carbon nanotubes in white blood cells.36 Therefore, understanding the effect of a protein corona on cellular uptake of lys-NDs is a prerequisite for their therapeutic evaluation.
Lastly, cellular uptake of lys-NDs and the diamoplexes was also investigated in the study. NDs, like many other carbon nanomaterials, commonly follow an energy-dependent clathrin-mediated endocytosis pathway for internalization in mammalian cells.37,38 However, the pathway and extent for ND uptake may vary depending on the particle size and surface coatings.39 Cellular uptake of lys-NDs and the siRNA-conjugated diamoplexes was assessed by a variety of techniques, including confocal microscopy, scanning transmission X-ray microscopy (STXM), and flow cytometry.
Methodology
Materials
Pharmaceutical-grade (ND98) carboxylic acid–functionalized NDs with an average particle size of 5 nm were purchased from Dynalene Inc. (Whitehall, PA, USA). lys-NDs were synthesized in-house following the procedure previously described.14 Carboxylated red fluorescent NDs (COOH-FNDs) were obtained from Adamas Nanotechnologies (Raleigh, NC, USA). Tosoh Corporation (Grove City, OH, USA) graciously provided yttria-stabilized zirconia (YTZ®) grinding media (0.05 mm). Methylcellulose USP (4,000 mPa·s) was obtained from Medisca (Richmond, BC, USA). A total of 0.5% methylcellulose gel was prepared in deionized distilled water obtained from a Milli-Q Integral Water Purification System, EMD Millipore (Billerica, MA, USA). HyClone® HyPure Molecular Biology Grade Water, HyClone™ 1× phosphate-buffered saline (PBS), and HyClone™ Dulbecco’s Modified Eagle’s Medium (DMEM)/High; glucose with L-glutamine; and sodium pyruvate were obtained from Thermo Fisher Scientific (Waltham, MA, USA). Fetal bovine serum (FBS) was acquired from Thermo Fisher Scientific. Human cervical cancer (HeLa) cells were obtained from American Type Culture Collection (Manassas, VA, USA). Trypsin and antibiotics were obtained from Sigma-Aldrich Co. (St Louis, MO, USA). Anti-GFP siRNA was purchased from Ambion (Burlington, ON, Canada). FITC- conjugated control siRNA was purchased from Santa Cruz Biotechnology Inc. (Dallas, TX, USA). Cell culture flasks and plates, centrifuge tubes, and cell strainer tubes were purchased from Falcon BD (Mississauga, ON, Canada).
Preparation of primary ND dispersions
Primary dispersions of lys-NDs were prepared in purified deionized water, PBS, 0.5% methylcellulose gel, and serum-free DMEM separately. Primary dispersion of COOH-FNDs was prepared in purified deionized water. All dispersions were prepared at a concentration of 2 mg/mL. YTZ grinding media was added in all dispersions at a ratio of 1:1. All primary dispersions were subjected to ultrasonication for 4 hours at a frequency of 25 kHz without heating. The ultrasonicated dispersions were then centrifuged at 5,200× g for 5 minutes to sediment the YTZ grinding media and the aggregated ND particulates. The resulting dispersions were used in the subsequent experiments.
Selection of the most compatible dispersion medium
In order to select the best medium to disperse lys-NDs for subsequent physicochemical analysis and cellular experiments, primary dispersions of lys-NDs in purified deionized water, PBS, 0.5% methylcellulose solution, and serum-free DMEM were allowed to stand for 72 hours at room temperature without any additional ultrasonication and centrifugation. Images were obtained at 24 hours and 72 hours to compare the degree of sedimentation for lys-NDs in different media.
Particle size and zeta potential measurements
Particle size distribution and zeta potential measurements were performed over a period of 25 days by using Malvern Zetasizer Nano ZS instrument (Malvern Instruments, Malvern, UK). Values for water properties used for measurement were as follows: refractive index =1.330, dielectric constant =78.5, and viscosity at 25°C =0.8872 cP. Solvent properties were changed for DMEM as hydrodynamic viscosity η =3 cP, refractive index =1.345,82 and dielectric constant =80.
Particle size was measured as a function of the light scattered by individual diamond particles at an angle of θ=173°, which allowed the calculation of translational diffusion coefficients “D” of particles by applying the CONTIN algorithm. The hydrodynamic radius RH of lys-NDs was then calculated using the Stokes–Einstein equation (RH = kT/6πηD), where k = Boltzmann constant, T is the temperature (298 K), and η is the viscosity of water at 25°C. All size distributions were derived from six measurements with ten individual scans. Particle size distributions for all time points were plotted as mean volume% to compare the degree of aggregation that occurred over the period of analysis. Polydispersity indices were also calculated by cumulant fitting. Zeta potential measurements were based on Laser Doppler electrophoresis, and values reported are an average of six measurements with 100 individual scans.
Interaction of lys-NDs with serum proteins
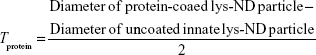
Aqueous dispersion of lys-NDs at a concentration of 2 mg/500 μL concentration was prepared as mentioned above. After ultrasonication and centrifugation, 500 μL of FBS dispersion was added and allowed to stand at room temperature for 45 minutes to allow the formation of protein adsorption layer around the ND particles. The dispersion of lys-ND/FBS was then lyophilized for 3 days to obtain complete desiccation. The powder obtained was then dispersed in purified water by gentle shaking at a final concentration of 2 mg/mL. Aggregation of the dispersion was monitored visually at 24 hours and 72 hours. Changes in particle size and electrokinetic charge distribution resulting from interaction of lys-NDs with FBS were analyzed similarly as above over a period of 3 days. Zeta potentials were recorded as a function of time to monitor the formation and stipulate the stability of the protein corona. The average particle diameter obtained from volume weighted size distributions was used to calculate the approximate thickness of the protein adsorption layer (Tprotein) by Equation 1:
|
|
Since the lys-ND/FBS system shows polydispersity index (0.265), the Z-average calculated by the instrument’s cumulants technique might cause an overestimation of average particle diameter, even in the presence of minimum core aggregates. In order to minimize the erroneous estimation of Tprotein, average particle diameter was calculated before and after protein adsorption using the mean volume% obtained by size distribution data.
Cell culture
Frozen HeLa cells were grown in DMEM (containing L-glutamine and sodium pyruvate) supplemented with 10% (v/v) FBS and 1% (v/v) antibiotic. The cells were incubated at 37°C and 5% CO2 and allowed to grow up to 90% confluency. When the cells were confluent, they were sub-passaged to allow the growth of healthy population. The sub-passaged cells were then seeded in well plates for subsequent cellular experiments. No ethics statement was required from the University of Saskatchewan Biomedical Research Ethics Board for the use of this cell line.
Scanning transmission X-ray microscopy
Cell samples used to obtain STXM were prepared on silicon nitride (Si3Ni4) windows. HeLa cells were seeded and treated with lys-NDs at an amount equalizing 40:1 diamoplex ratio, that is, 41.5 μg/well. The treated cells were resuspended in 2.5 mL of serum-supplemented media and added to the Si3Ni4 windows in a six-well plate. The cells were incubated for 24 hours at 37°C and 5% CO2 again to allow cellular attachment to the Si3Ni4 windows (size 1×1 mm, thickness 100 nm). The membranes were mounted on the STXM sample holder and imaged using STXM at the Soft X-ray Spectromicroscopy beam line of the Canadian Light Source (CLS; University of Saskatchewan, Saskatoon, SK, Canada). Both control and lys-ND treated cells were adjusted to the same optical density and scanned at X-ray energies of 280–300 eV of carbon K-edge, and absorbance spectra from different identifiable regions on the sample were collected. Changes in the absorbance spectra obtained from the cells as a result of ND uptake were recorded.
Flow cytometry for lys-NDs
HeLa cells were plated on a six-well plate at a density of 2×10⁵ cells/well and incubated at 37°C and 5% CO2 to allow attachment. Thereafter, the cells were treated with lys-NDs at a concentration of 25 μg/mL, 100 μg/mL, and 250 μg/mL. Untreated cells were used as controls. The treatments were terminated after 20 hours followed by washing with 1× PBS three times for 5 minutes each. The cells were then harvested using trypsin and 0.25% ethylenediaminetetraacetic acid (EDTA) and centrifuged at 95× g and 4°C for 5 minutes to obtain cell pellets. The individual cell pellets were resuspended in 500 μL of 1× PBS, transferred into 5 mL flow cytometer tubes, and the amounts of ND particles taken up by the cells were analyzed using BD FACS Calibur™ (BD Biosciences, San Jose, CA, USA). The laser beam (488 nm) illuminates cells in the sample stream. It is then scattered by the cells at narrow angles to the axis of the laser beam called FS and at approximately a 90° angle to the axis of the laser beam called side scattering (SS). The intensities of FS and SS are proportional to the size and intracellular complexity, respectively.
Laser scanning confocal microscopy
To evaluate whether lys-NDs can be detected in the cells based upon their intrinsic fluorescence, laser scanning confocal microscopy was performed. HeLa cells seeded at the density of 40,000 cells per well were allowed to adhere to coverslip placed in 12-well plate for 24 hours. The cell media were replaced with 1 mL of lys-NDs dispersion prepared at a concentration of 50 μg/mL. After 6 hours, FBS was added to the media of the cells at a final concentration of 10% (w/v). The cells were incubated for a total of 24 hours and then washed three times with PBS (5 minutes each). Slides of the live cells were prepared and imaged with a Leica TCS SP5 laser scanning confocal microscope (Leica Microsystems, Wetzlar, Germany; Western College of Veterinary Medicine, University of Saskatchewan, Saskatoon, Canada) using a 63× oil immersion objective. The sample excitation was carried out with a 476 nm argon laser source, and the emission was collected from 492 nm to 677 nm. A total of 44 z-sections of cells were imaged, each with a step size of 0.38 μm.
Flow cytometry for lys-ND/siRNA diamoplexes
Flow cytometry was used again to evaluate the cellular association of lys-NDs as diamoplexes by complexing them with FITC-labeled control siRNA. HeLa cells were seeded and plated as above. FITC-labeled siRNA was complexed with lys-NDs dispersed in aqueous and DMEM at different weight ratios of siRNA to lys-NDs ranging from 1:20 to 1:50 by incubating the dispersion with siRNA for 30 minutes at room temperature. The attached cells were then treated with lys-ND/siRNA diamoplexes diluted in serum-supplemented or serum-free DMEM. The final concentration of siRNA in each well was 75 pmoles. Untreated cells and lys-NDs-treated cells were used as controls. The treatments were terminated after 24 hours followed by washing, harvesting, and resuspending as described above. FITC fluorescence was measured using BD FACS Calibur™. Fluorescence from FITC siRNA was recorded using FL1-H band pass filter (530/30 BP) by plotting log of fluorescence intensity versus number of events. Healthy cell population was gated, and a total of 10,000 events were recorded in the gated region per sample. The data was analyzed using BD CellQuest™ Pro software (version 6.0). Relative fluorescence shift (from negative to positive) for diamoplex-treated cells were compared with the autofluorescence of the untreated cells and fluorescence from lys-NDs-treated cells through the marker (M1). This marker was applied to quantify the positive shifts resulting from the treatments.
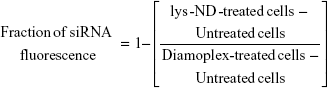
Fraction of FITC siRNA fluorescence was calculated using %fluorescence shifts as follows:
|
|
Flow cytometry was also used to analyze cellular association of COOH-FNDs as diamoplexes with FITC siRNA. Fluorescence from COOH-FNDs was recorded using FL3-H long pass filter (670 LP), while fluorescence from FITC-labeled siRNA was recorded using FL1-H BP filter.
Statistical analysis
Flow cytometry results for cellular association of lys-NDs and COOH-FNDs in aqueous medium were expressed as the mean of n=3± SD. One-way ANOVA and Tukey’s post hoc multiple comparisons were used for analysis when samples were normally distributed and had homogenous variance. Kruskal Wallis ANOVA and Mann–Whitney U-test for post hoc comparison were used for analysis when samples were not normally distributed or had nonhomogenous variance. The significant differences were considered at P≤0.05 level of significance (α).
Results and discussion
Dispersion stability of lysine NDs in formulations
The choice of a dispersion medium is critical in attempting to define optimum physicochemical characteristics of and biological responses to the NPs. Therefore, a series of biologically relevant media was evaluated for preparing lys-NDs dispersions. The dispersions in PBS showed extensive sedimentation within 3 days (Figure 1A). lys-NDs in 0.5% methylcellulose gel aggregated slightly, observed by visual monitoring for 3 days (Figure 1B), whereas aqueous dispersion of lys-NDs showed minimum sedimentation over a period of 25 days (Figure 1C). PBS promotes ND aggregation due to its high ionic strength, which disturbs the charge distribution on the ND surface. This ultimately causes destabilization, which is mediated through random van der Waals interactions.40,41 Methylcellulose is an amphiphilic molecule, which is commonly employed in stabilizing hydrophobic carbon nanomaterials, especially uncharged carbon nanotubes.42 However, in the case of cationic NPs, it can reduce the positive charge density of the surface by masking the functional groups through adsorption.43 This phenomenon can ultimately lead to flocculation and reduce colloidal stability of the lys-NDs. It could also hamper the binding efficacy with genetic materials and hinder the formation of diamoplexes.
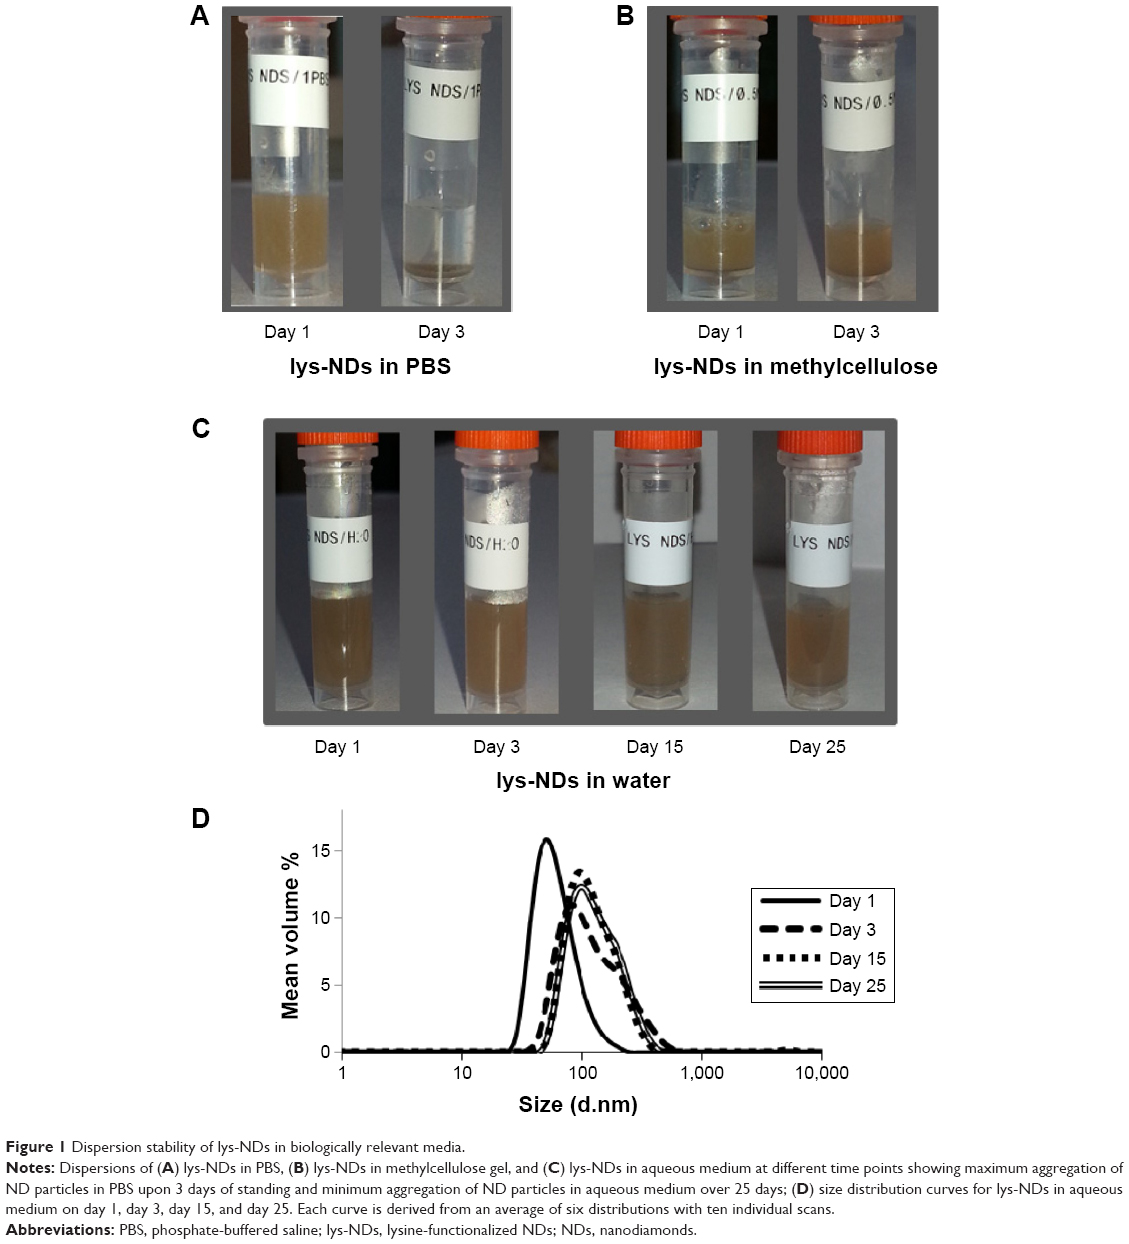 | Figure 1 Dispersion stability of lys-NDs in biologically relevant media. |
lys-NDs remained well dispersed in water showing minimum sedimentation over 25 days; thus, the stability of aqueous ND dispersion was further analyzed using particle size distribution and zeta potential measurements. The distributions remained relatively monomodal (Figure 1D) throughout the period of analysis, and hence, average particle sizes were calculated. The average particle size of the fresh ND dispersion (day 1) was 51±16 nm (polydispersity index =0.142; Figure 1D) with 89% of the particles in the optimal size range of 33–91 nm (Table S1). Subsequently, the size increased slightly from 79±10 nm on day 3 to 91±13 nm and 91±12 nm by days 15 and 25, respectively. The zeta potential remained relatively stable being +26.3±0.3 mV on day 1, +21.2±0.4 mV on day 3, +31.3±0.6 mV on day 15, and +29.6±0.4 mV on day 25 (Table 1). The stability is due to the fact that the aqueous medium does not compromise the positive charges on lys-NDs; thus, electrostatic repulsion between homogenous adjacent surfaces is maintained and the formation of core aggregates is hindered.
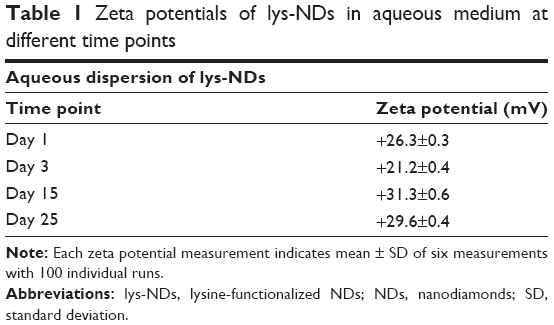 | Table 1 Zeta potentials of lys-NDs in aqueous medium at different time points |
Interaction of lys-NDs with biological growth medium
In addition to the inherent properties of NPs, physicochemical changes mediated through the biological growth medium can also modulate the transfection efficiency.44,45 Therefore, we investigated the behavior of NPs in biologically relevant media used for in vitro transfection (mainly, cell culture medium and protein-rich serum). Stability analysis of lys-NDs was performed in both serum-free and supplemented DMEM to understand this behavior.
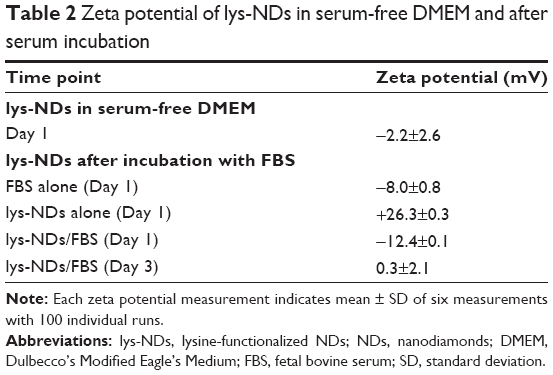
lys-NDs in serum-free DMEM exhibited poor dispersibility and showed visible sedimentation within 24 hours after sonication (Figure 2A). Particle size distribution also revealed a high degree of aggregation with the majority of ND particles having a diameter of 500±10 nm (Figure 2B) (Table S2). A zeta potential of −2.2±2.6 mV (Table 2) indicated that the positively charged surface of lys-NDs was also compromised. Since the systems were highly aggregated within 24 hours, analyses at further time points were not performed. We postulate that lys-NDs become unstable in DMEM due to high ionic strength of the growth medium, which promotes the flocculation of the colloidal system.46–48 Macromolecules and electrolytes in growth media show random electrostatic interactions with the functional groups on the ND surface, thus concealing the positive charges of primary amines responsible for repulsion of individual particles, similar to the effect of PBS. Ultimately, interparticle interaction is enhanced resulting in increased level of aggregation and particle sedimentation, due to the screening effect of counter ions.47
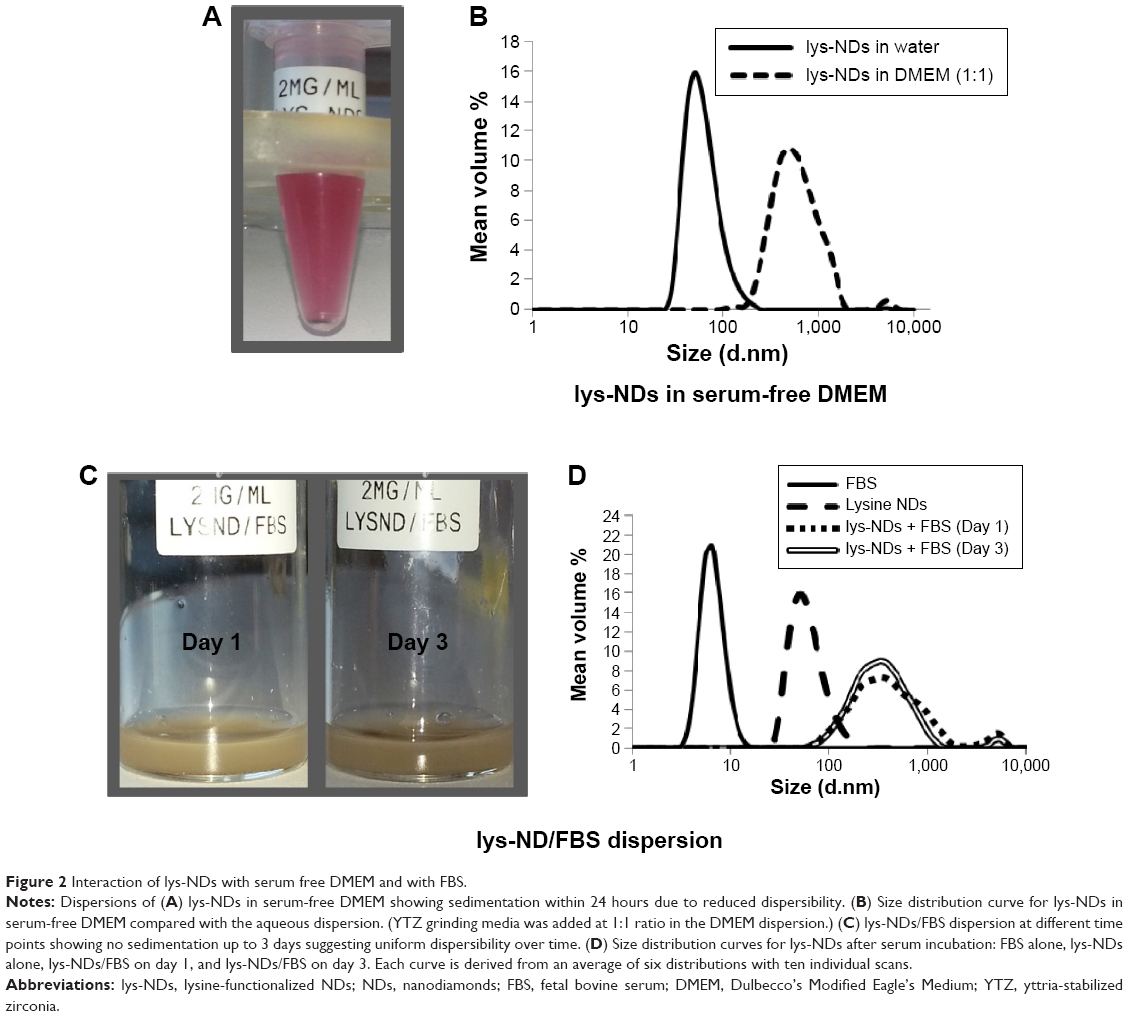 | Figure 2 Interaction of lys-NDs with serum free DMEM and with FBS. |
 | Table 2 Zeta potential of lys-NDs in serum-free DMEM and after serum incubation |
Interaction of lys-NDs with serum proteins was also investigated in FBS to assess the formation of a protein adsorption layer on ND. The lys-ND–protein interaction was analyzed by observing the change in particle size and zeta potential as a function of incubation time with FBS. Upon visual inspection, the lys-NDs showed no visible sedimentation up to 3 days (Figure 2C), indicating good dispersibility. However, lys-NDs exhibited an approximately fivefold increase in diameter immediately after protein adsorption with size distributions ranging from 150 nm to 500 nm (Figure 2D) (Table S2) compared with lys-NDs in water (range =33–91 nm) or the serum alone (range =4–11 nm; Figure 2D), which remained fairly constant for 3 days. The disappearance of the lys-ND and serum peaks indicates dynamic association of serum proteins with cationic ND surface. In nanoparticulate systems, an increase in diameter after protein adsorption can vary greatly depending upon the size of adsorbing proteins49,50 and the surface-to-volume ratio of the particles,51 as observed for systems reported herein. Adsorption of the serum proteins was confirmed by the change in zeta potential of the ND system from +26.3 mV to −12.4 mV (Table 2), suggesting the formation of an anionic protein corona. Due to positively charged surface of lys-NDs, there is an increased possibility for adsorption of proteins with low iso-electric points (<5.5) such as albumin.51 Protein adsorption is a two-edged process. It cannot only change the biological identity of NPs affecting its cellular uptake and distribution32 but can also be beneficial for limiting NP-mediated cellular toxicity and conferring target specificity.51 The ability of lys-NDs to adsorb proteins, which is the main focus of the present study, can be utilized in the future for improving the cellular uptake and targeting by allowing the formation of a selective protein corona, like apolipoproteins, which have been employed to enhance cellular uptake of NPs.51,52 To measure the extent of protein adsorption, the Tprotein was calculated. This calculation was based on the assumption that formation of a protein corona around NDs resembles a classical ligand binding model and thus follows the law of mass action.53 Accordingly, the affinity of protein for NDs can be defined by the dissociation constant (KD), corresponding to the concentration at which half of the NDs are saturated with proteins at equilibrium.53 Tprotein with FBS was 157 nm immediately after incubation of lys-NDs with serum, which correlates with multiple layers of proteins and other biomolecules on the ND surface. A negligible decrease in the thickness of the adsorption layer to 155 nm and significant increase in zeta potential toward positive value of 0.3±2.1 mV (Table 2) in 3 days indicate the occurrence of a continuous adsorption and desorption of proteins (Vroman effect).54 These results suggest that the identities of adsorbed proteins may change over time, but the total amount remains roughly constant. Neutral zeta potential after 3 days can also be the result of electrostatic interactions between protein-coated and bare lys-ND particles resulting in the formation of coagulated masses with reduced electrophoretic mobility.55 While the particle size increased significantly in the presence of serum, the lack of sedimentation in the 3 days of the testing period renders these dispersions pharmaceutically acceptable.
Cellular internalization of lys-NDs
Cellular uptake of lys-NDs was studied by using three complimentary techniques providing a combination of spectroscopic, microscopic, and light scattering principles. Soft X-rays offered microscopic imaging with detailed spectral sensitivity, by allowing microspectroscopy to record the cellular spectra from identified spots on the image. Further evidence of ND internalization in the cells was obtained using flow cytometry, which utilized light scattering patterns to differentiate the cells before and after ND uptake. Finally, laser scanning confocal microscopy was used to confirm the presence of lys-NDs in the cells by utilizing their innate fluorescence property.
Scanning transmission X-ray microscopy
In order to identify NDs in a biological environment, a unique spectrum, different from cellular macromolecules (mainly proteins and lipids), is sought. Soft X-ray spectroscopy of the cells incubated with lys-NDs was carried out by STXM. This technique provides many advantages over conventional techniques used for characterizing NPs and investigating their cellular interaction. It allows high-resolution imaging that enables evaluation of interactions on the level of individual particles.56–58 Most importantly, it can be applied to fully hydrated biological materials, which allows functional analysis of molecular mechanisms in a living cell under native biological conditions.59 Soft X-rays also provide spatial resolution of 25–30 nm60 and spectral resolution on the order of 100 meV61,62 that can differentiate between classes of biomolecules and can identify NPs as therapeutic carriers in cells and tissues.57 The spectrum of lys-NDs (red; Figure 3A) recorded as a reference shows identifiable peaks at 288.2 eV, 292.5 eV, and 297.5 eV, indicated by arrows, which are absent in the spectrum of intracellular proteins (green; Figure 3A) obtained from the untreated cells. For detailed evaluation, untreated cells and lys-ND-treated cells were scanned separately through STXM at wide range of photon energies. Spectra from the identifiable regions in the cells were recorded (Figure 3B and E). In untreated cells (Figure 3C), the green spectrum showed absorption at peaks 285 eV and 288.2 eV and hence was assigned to proteins.62 The red spectrum also indicated absorption peaks at the same X-ray energies but with relatively lower intensities and therefore was assigned to proteins from the cellular growth media (DMEM) surrounding the cell. The blue spectrum can be assigned to nucleus- and near-nucleus-derived mixture of macromolecules.
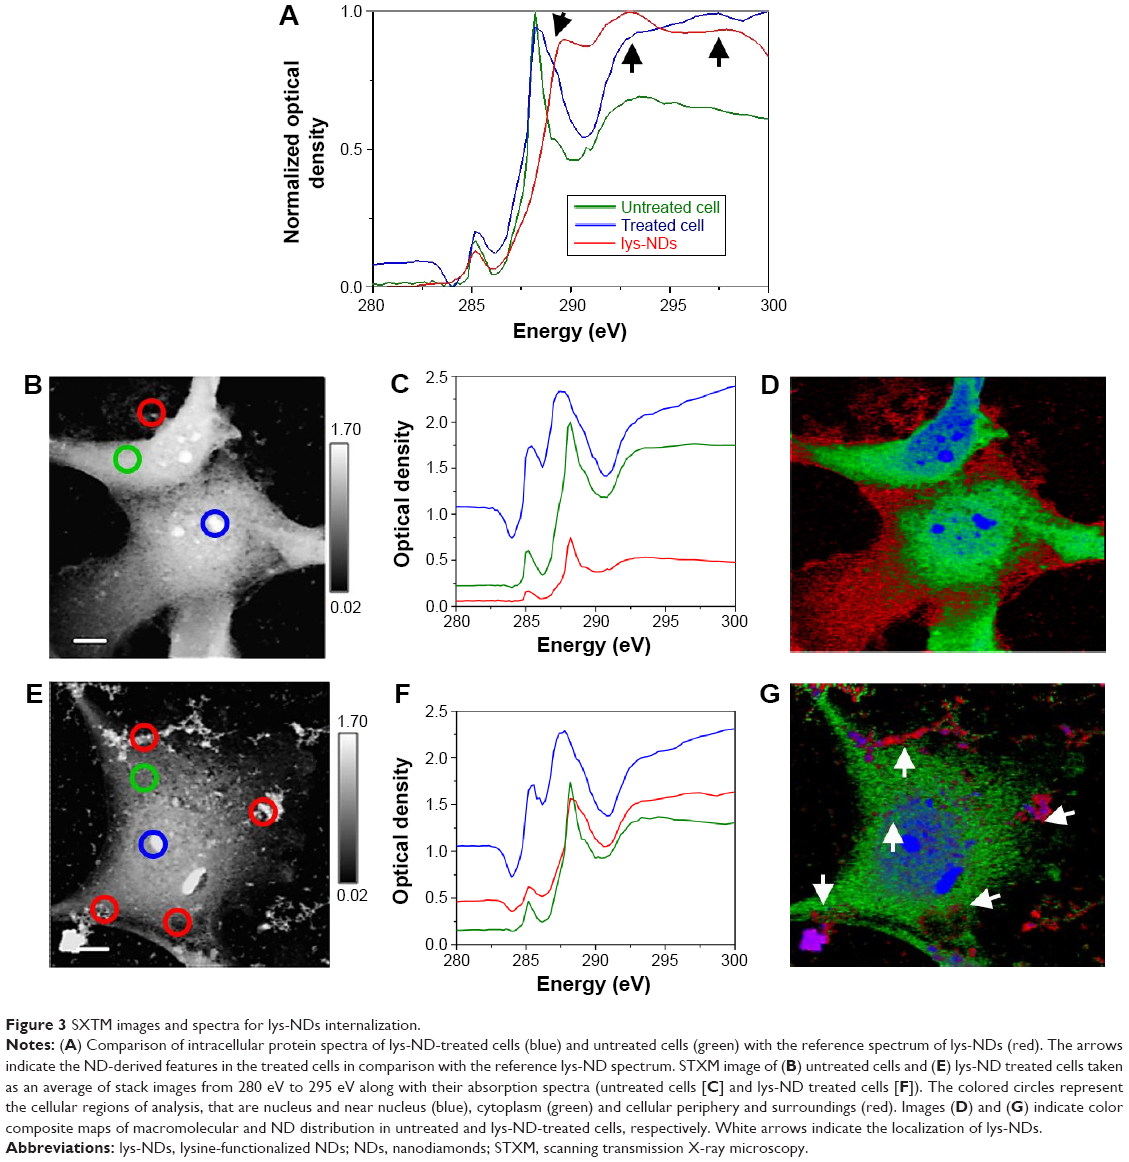 | Figure 3 SXTM images and spectra for lys-NDs internalization. |
The lys-ND-treated cells (Figure 3F), scanned at the same X-ray energy, also indicate absorption spectra of nonprotein macromolecules (blue) and intracellular (green) and growth-medium-derived proteins (red). However, the red spectrum exhibits weak features of absorption at 288.2 eV, 292.5 eV, and 297.5 eV corresponding to the specific lys-ND signals as indicated by black arrows separately in Figure 3A. Clear lys-ND signals are masked and appeared weak due to the interference of the overlapped intracellular and growth-medium-derived proteins on lys-ND surface. Unlike for untreated cells (Figure 3D), color composite image of lys-ND-treated cells indicate localization of NDs (red) overlapped with proteins mostly around cellular edges and cytoplasm, with some being in close proximity to the nucleus (Figure 3G), indicated by arrows. While these 2D images in STXM are evidence of the cellular uptake of the lys-NDs, future work is planned to use the high-resolution capability of STXM (30 nm) combined with 3D imaging for a more precise localization of the lys-ND particles within the cells.
Flow cytometry
Flow cytometry was used to assess the molecular and morphological changes in the cells when treated with lys-NDs. Changes in forward scattering (FS) and side scattering patterns were recorded to evidence the internalization of lys-NDs in cells. Side scattering, that is, the light scattering measured at 90° angle, increases with an increase in granularity and internal complexity of the cell; thus, the uptake of NPs can be detected by monitoring this scattering intensity.63 A dose-dependent increase was observed in side scattering resulting after administration of lys-NDs to the cells (Figure 4). The untreated cells exhibit the least side scattering (Figure 4A) and showed a tightly condensed population (Figure S1A). However, after treatment with lys-ND, the cell populations became increasingly dispersed (Figure S1B–D) and exhibited an increase in side scattering with concentration ranging from 25 μg/mL to 250 μg/mL (Figure 4A). This dose-dependent increase in side scattering can be correlated with an increase in the internal complexity and light scattering moieties inside the cells.63 NDs are efficient light scattering moieties, since they possess high refractive index (n=2.42) owing to their diamond core.64,65 Due to the high refractive index, the elastically scattered light from a ND particle is estimated to be 300-fold brighter than a same-sized cell organelle.65 In addition to increased light scattering, there can be an increased activation of lysosomes for trapping the internalized ND particles,66 which also contributes toward side scattering.67
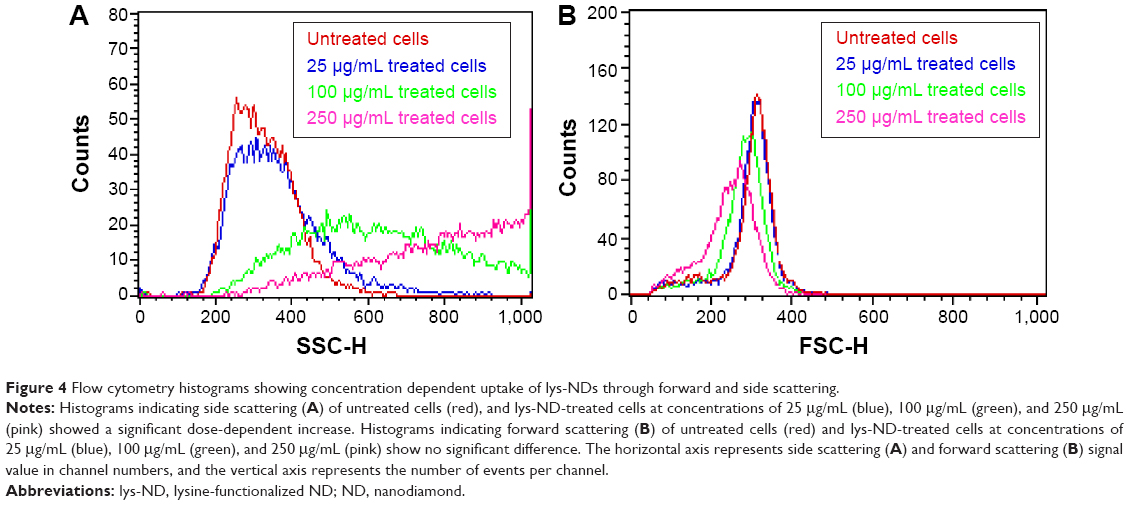 | Figure 4 Flow cytometry histograms showing concentration dependent uptake of lys-NDs through forward and side scattering. |
While there is a change in the side scattering, the FS (indicative of the size of the cell) remained unchanged before and after the treatment (Figure 4B), suggesting that the NDs are internalized into the cells and not adhered to the surface. FS of light based on refraction is directly proportional to the cell size and surface area; thus, a larger surface area is associated with more FS.68 We inferred that if NPs are adhered to the surface of the cell, it would increase the overall surface area and can contribute toward the refraction of light. However, the cells treated with all concentrations of NDs show similar refraction patterns to the untreated cells (Figure 4B). There were no significant positive shifts in FS, which indicate absence of surface-adhered ND particles. Although this finding cannot be attributed to an absolute absence of surface adhesion, it indicates that there is no significant surface localization of NDs. The combination of the above two parameters corresponds to a dose-dependent cellular uptake of lys-NDs.
Laser scanning confocal microscopy
To further confirm the cellular uptake of lys-NDs, laser scanning confocal microscopy was carried out. The fluorescence (Figure 5A), brightfield (Figure 5B), and overlay of brightfield and fluorescence (Figure 5C) images of the top, middle, and bottom z-positions (corresponding to the 44th, 22nd, and first section, respectively) of a lys-ND-treated cell are shown. An overlay of brightfield and fluorescence images of the middle slice of lys-ND-treated live cells revealed internalization of a few ND particles, as marked by the red circle (Figure 5C, middle). These particles appear to be localized near the nucleus of the cell. However, the fluorescence of these particles in the middle z-section was not distinctly identified due to the interference originating from cellular autofluorescence. Upon longer exposure time, the autofluorescence of the cells was quenched, and the fluorescence (Figure 6A) and brightfield images (Figure 6B) of four consecutive slices when overlaid revealed more distinct ND fluorescence emission (Figure 6C).
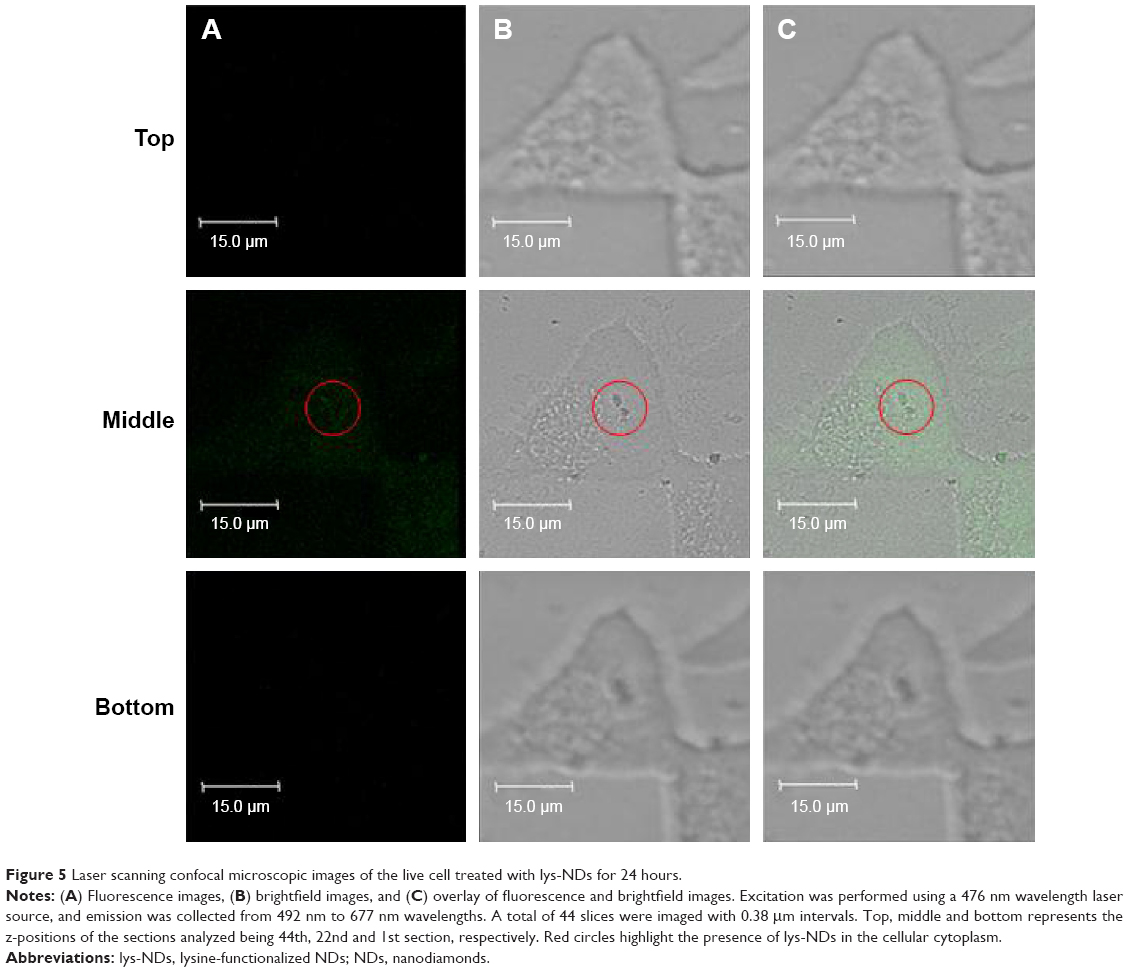 | Figure 5 Laser scanning confocal microscopic images of the live cell treated with lys-NDs for 24 hours. |
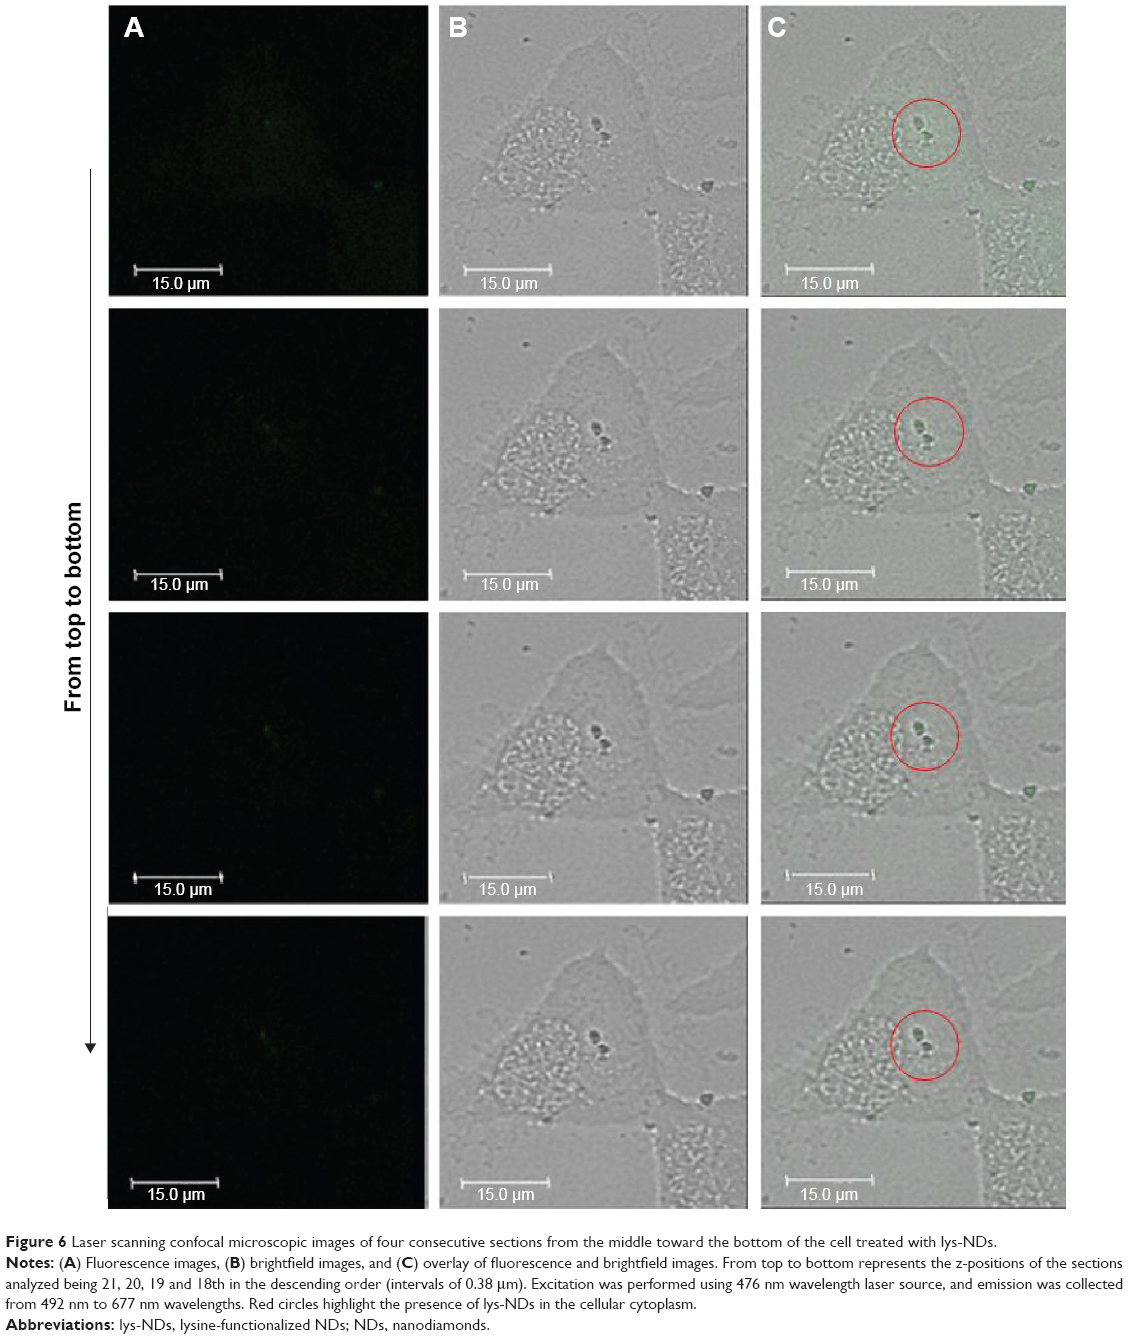 | Figure 6 Laser scanning confocal microscopic images of four consecutive sections from the middle toward the bottom of the cell treated with lys-NDs. |
Cellular internalization of lys-NDs as diamoplexes
Previously, we reported that lys-NDs can bind to siRNA.14 This fact was implemented to enhance the investigation of lys-NDs suitability for gene delivery as described here. Although detonation NDs show a slight innate fluorescence as observed during the confocal microscopy, this fluorescence is not sufficiently intense for detection during flow cytometry. Therefore, lys-NDs were complexed with fluorescein isothiocyanate (FITC)-labeled siRNA to provide an intense fluorescence for probing these diamoplexes inside the cells. After treating the cells with these diamoplexes, the presence of FITC fluorescence from siRNA was correlated with cellular association of lys-NDs/siRNA diamoplexes.
Cells treated with diamoplexes prepared from lys-NDs dispersed in serum-free DMEM showed no positive shift for FITC fluorescence (Figure S2), which is attributed to the poor binding of lys-NDs with siRNA secondary to their unstable charge distribution in DMEM. Cells treated with diamoplexes prepared from aqueous dispersion of lys-NDs showed a statistically significant positive shift in FITC fluorescence of 14%±2.1% compared with the untreated cells (5%±0.2%; Figure 7; Figure S3). The positive fluorescence shift indicates successful internalization of the labeled siRNA. Addition of serum to the formulation enhanced the FITC fluorescence shift to 20%±2.3% (Figure 7; Figure S4). This increase in fluorescence is an indicative that protein corona facilitates the cellular uptake of diamoplexes.
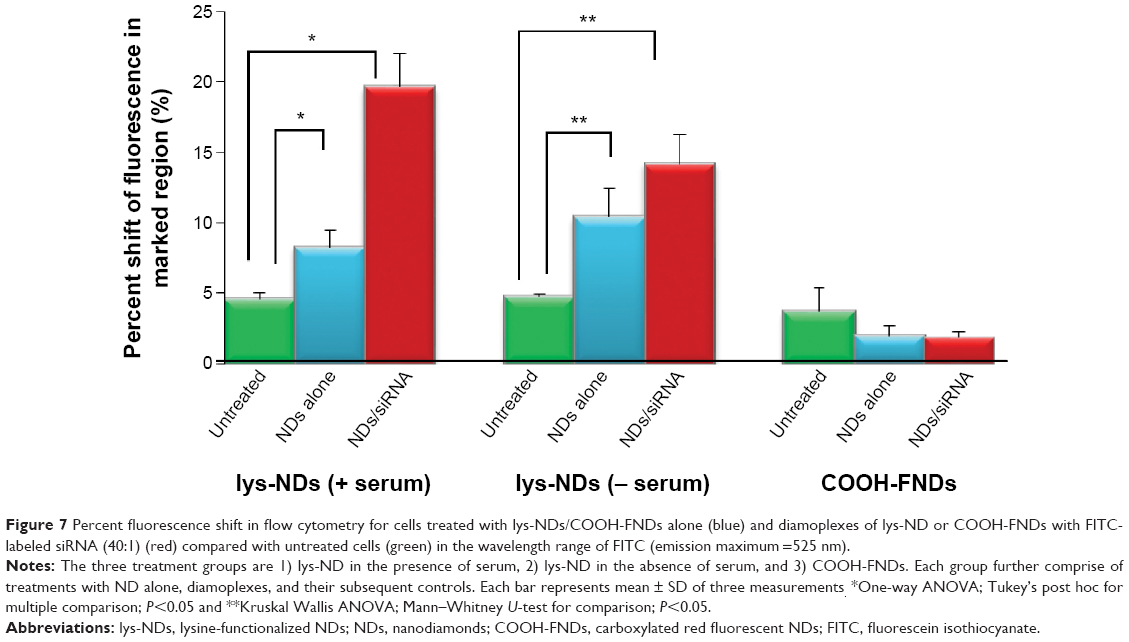 | Figure 7 Percent fluorescence shift in flow cytometry for cells treated with lys-NDs/COOH-FNDs alone (blue) and diamoplexes of lys-ND or COOH-FNDs with FITC-labeled siRNA (40:1) (red) compared with untreated cells (green) in the wavelength range of FITC (emission maximum =525 nm). |
In order to confirm that primary amine-rich cationic surfaces created through functionalization of NDs facilitates electrostatic binding with negatively charged siRNA, diamoplexes were also prepared with COOH-FNDs. Here, the NDs used were additionally treated to induce brighter fluorescence capable of detection in flow cytometry. The cells treated with these diamoplexes showed no significant positive shift for FITC fluorescence (Figure 7; Figure S5) revealing that the COOH-FNDs are unable to carry nucleic acids inside the cells due to the negative surface charge. However, interestingly, they show cellular internalization independent of siRNA carriage, as observed through the positive shift obtained for the treated cells in the wavelength region exclusive to the fluorescence of NDs (550–800 nm; Figures S6 and S7).
The efficacy of each siRNA delivery method was quantitatively analyzed by comparing the fraction of fluorescence shift caused exclusively due to siRNA independent of the weak interference from ND fluorescence. The fraction of FITC fluorescence is considered directly proportional to the amount of labeled siRNA delivered to the cells. Only 0.15 fraction of siRNA fluorescence was observed when the cells were treated with 75 pmoles of naked siRNA. The fraction of siRNA fluorescence increased significantly to 2.7 folds (0.4±0.01; Figure 8) when the same amount of siRNA was delivered in conjugation with lys-NDs at a ratio of 40:1. This illustrates the ability of the lys-NDs to perform intracellular delivery of nucleic acids.
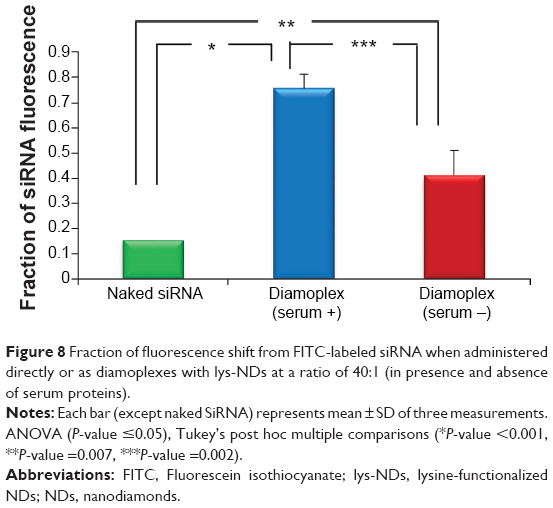 | Figure 8 Fraction of fluorescence shift from FITC-labeled siRNA when administered directly or as diamoplexes with lys-NDs at a ratio of 40:1 (in presence and absence of serum proteins). |
Moreover, the fraction of siRNA fluorescence was 1.8 times (0.7±0.05) greater in the presence of serum (Figure 8) compared with the serum-free environment, which might indicate that proteins can protect the integrity of diamoplexes and facilitate their cellular uptake.
Despite previous evidences indicating an inhibitory effect of serum on cellular uptake of NP-gene complexes,69,70 we observed that serum proteins can cause increased cellular uptake of diamoplexes. Protein adsorption on NP surface can alter the particle size and the overall surface charge of the system. Therefore, the serum-induced increase in cellular uptake of diamoplexes can be attributed to multiple factors. lys-NDs have a cationic surface due to the presence of primary amines, which may result in favorable interaction with the negatively charged albumin, the main component of the serum. This interaction could impede the electrostatic interaction between lys-NDs in the diamoplexes and the phospholipids of the cell membrane. Therefore, the change in surface charge does not explain the increase in cellular uptake.
It was also determined that the size of the diamoplexes increased significantly due to protein adsorption. The adsorbed proteins increased the hydrodynamic radius of the NPs. There are previous studies indicating that protein adsorption increases the overall cellular uptake of hard NPs like polystyrene.71 It is speculated that the serum-induced increase in the particle size of diamoplexes can switch the most prominent clathrin-mediated endocytosis of NDs to claveoli-mediated endocytosis,72 which is responsible for the uptake of complexes sized ~500 nm or above.73,74 Additionally, albumin, the main component of FBS, can also facilitate cellular uptake of diamoplexes.75,76 Upon incorporation, it can act as a ligand that binds to the albumin-binding protein on the claveolar plasma membrane to induce more affinity for claveoli or lipid raft-mediated endocytosis of diamoplexes.77–79 Moreover, the bioreactivity of the surface due to the adsorption of physiologically active proteins like albumin on the surface can also serve to facilitate specific receptor-mediated endocytosis. Unfolding of the adsorbed proteins resulting in a specific conformation can induce differential binding to target receptors on the cell surface.80,81 Although the optimum size for cellular uptake is defined to be 20–40 nm,77 the altered endocytic pathway might facilitate cellular association of larger-sized protein-coated diamoplexes by altered pathways, thus increasing the intracellular amount of FITC-labeled siRNA. Detailed mechanistic analysis will be conducted to evidence this altered cellular uptake behavior of diamoplexes.
Conclusion
In this study, we demonstrated that aqueous dispersion of lys-NDs exhibits excellent dispersibility and preserved their physicochemical properties for at least 25 days. Unlike in aqueous medium, the stability of lys-NDs is significantly compromised in physiological growth media, which in turn diminishes their siRNA binding capacity and cellular uptake. lys-NDs interact with serum to form a protein shell around the core. This protein corona stabilizes ND/siRNA complexes and facilitates the process of cellular uptake. The increased cellular uptake in the presence of serum proteins is a promising finding, rendering the lys-ND diamoplexes amenable for parenteral administration for gene therapy. Successful cellular uptake of lys-NDs, alone, and as stable complexes with siRNA encourages further investigations to evaluate their transfection efficiency and biocompatibility as gene carriers for RNAi therapeutics.
Acknowledgments
The authors acknowledge the Natural Sciences and Engineering Research Council of Canada (NSERC) and the University of Saskatchewan for funding this project. Saniya Alwani would also like to thank the College of Pharmacy and Nutrition, the College of Graduate Studies and Research at the University of Saskatchewan for supporting her graduate studies. The authors thank Tosoh Corporation, USA, for the kind donation of the YTZ grinding media used in these studies. The scanning transmission X-ray microscopy data described in this paper were collected at the Soft X-ray Spectromicroscopy beamline of the Canadian Light Source (CLS), which is supported by NSERC, the National Research Council Canada (NRC), the Canadian Institutes of Health Research (CIHR), the Province of Saskatchewan, Western Economic Diversification Canada, and the University of Saskatchewan.
Disclosure
The authors report no conflicts of interest in this work.
References
Schrand AM, Dai L, Schlager JJ, Hussain SM, Osawa E. Differential biocompatibility of carbon nanotubes and nanodiamonds. Diam Relat Mater. 2007;16(12):2118–2123. | ||
Liu KK, Cheng CL, Chang CC, Chao JI. Biocompatible and detectable carboxylated nanodiamond on human cell. Nanotechnology. 2007;18(32):325102. | ||
Yuan Y, Wang X, Liu GJH, et al. Pulmonary toxicity and translocation of nanodiamonds in mice. Diam Relat Mater. 2010;19(4):291–299. | ||
Huang H, Pierstorff E, Osawa E, Ho D. Active nanodiamond hydrogels for chemotherapeutic delivery. Nano Lett. 2007;7(11):3305–3314. | ||
Kruger A, Kataoka F, Ozawa M, et al. Unusually tight aggregation in detonation nanodiamonds: identification and disintegration. Carbon N Y. 2005;43(8):1722–1730. | ||
El-Say KM. Nanodiamond as a drug delivery system: applications and prospective. J App Pharm Sci. 2011;01(06):29–39. | ||
Ho D. Nanodiamonds: Applications in Biology and Nanoscale Medicine. 2010 ed. Berlin: Springer; 2010. | ||
Shenderova O, Zhirnov V, Brenner D. Carbon nanostructures. CRC Cr Rev Sol State. 2002;27:227–356. | ||
Eidelmana ED, Siklitskya VI, Sharonovaa LV, et al. A stable suspension of single ultrananocrystalline diamond particles. Diam Relat Mater. 2005;14(11–12):1765–1769. | ||
Pentecost A, Gour S, Mochalin V, Knoke I, Gogotsi Y. Deaggregation of nanodiamond powders using salt and sugar assisted milling. ACS Apl Mater Ins. 2010;2(11):3289–3294. | ||
Liu Y, Gu Z, Margrave JL, Khabashesku VN. Functionalization of nanoscale diamond powder: fluoro-, alkyl-, amino-, and amino acid-nanodiamond derivatives. Chem Mater. 2004;16(20):3924–3930. | ||
Xu K, Xue Q. A new method for deaggregation of nanodiamonds from explosive detonation: graphitization – oxidation method. J Phys C Solid State. 2004;46(4):649–650. | ||
Gaebel T, Bradac C, Chen JPH, Rabeau JR. Size reduction of nanodiamonds via air oxidation. Diam Relat Mater. 2012;2:28–32. | ||
Kaur R, Chitanda JM, Michel D, et al. Lysine functionalized nano diamonds: synthesis, physiochemical characterization and nucleic acid binding studies. Int J Nanomed. 2012;7:3851–3866. | ||
Chow E, Zhang X, Chen M, et al. Nanodiamond therapeutic delivery agents mediate enhanced chemoresistant tumor treatment. Sci Transl Med. 2011;3(73):73ra21. | ||
Pati LS, Rhodes D, Burgess D. DNA-based therapeutics and DNA delivery systems: a comprehensive review. AAPS J. 2005;7(1):E61–E77. | ||
Castanotto D, Rossi JJ. The promises and pitfalls of RNA-interference-based therapeutics. Nature. 2009;457(7228):426–433. | ||
Opalinska J, Gewirtz A. Nucleic-acid therapeutics: basic principles and recent applications. Nat Rev Drug Discov. 2002;1(7):503–514. | ||
Zhang P, Yang J, Li W, et al. Cationic polymer brush grafted-nanodiamond via atom transfer radical polymerization for enhanced gene delivery and bioimaging. J Mater Chem. 2011;21:7755–7764. | ||
Alhaddad A, Adam M, Botsoa J, et al. Nanodiamond as a vector for siRNA delivery to Ewing sarcoma cells. Small. 2011;7(21):3087–3095. | ||
Zhang X, Chen M, Lam R, Xu X, Osawa E, Ho D. Polymer-functionalized nanodiamond platforms as vehicles for gene delivery. ACS Nano. 2009;3(9):2609–2616. | ||
Martín R, Alvaro M, Herance J, García H. Fenton-treated functionalized diamond nanoparticles as gene delivery system. ACS Nano. 2010;4(1):65–74. | ||
Kong X, Lora Huang LC, Vivian Liau SC, Han CC, Chang HC. Polylysine-coated diamond nanocrystals for MALDI-TOF mass analysis of DNA oligonucleotides. Anal Chem. 2005;77(13):4273–4277. | ||
Li J, Chin K. Chapter 10: methods to nanoparticle conjugation to monoclonal antibodies. In: Pathak Y, Benita S, editors. Antibody-Mediated Drug Delivery Systems: Concepts, Technology, and Applications. New York City, NY: John Wiley & Sons; 2012:192–193. | ||
Krueger A, Stegk J, Liang Y, Lu L, Jarre G. Biotinylated nanodiamond: simple and efficient functionalization of detonation diamond. Langmuir. 2008;24(8):4200–4204. | ||
Taverna S, Li H, Ruthenburg A, Allis C, Patel D. How chromatin-binding modules interpret histone modifications: lessons from professional pocket pickers. Nat Struc Mol Biology. 2007;14(11):1025–1040. | ||
Cedervall T, Lynch I, Foy M, et al. Detailed identification of plasma proteins adsorbed on copolymer nanoparticles. Angew Chem Int Ed Engl. 2007;46(30):5754–5756. | ||
Izak-Nau E, Voetz M, Eiden S, Duschl A, Puntes V. Altered characteristics of silica nanoparticles in bovine and human serum: the importance of nanomaterial characterization prior to its toxicological evaluation. Part Fibre Toxicol. 2013;10(1):56. | ||
Lundqvist M, Stigler J, Cedervall T, et al. The evolution of the protein corona around nanoparticles: a test study. ACS Nano. 2011;5(9):7503–7509. | ||
Monopoli M, Walczyk D, Campbell A, et al. Physical-chemical aspects of protein corona: relevance to in vitro and in vivo biological impacts of nanoparticles. J Am Chem Soc. 2011;133(8):2525–2534. | ||
Yan Y, Gause K, Kamphuis M, et al. Differential roles of the protein corona in the cellular uptake of nanoporous polymer particles by monocyte and macrophage cell lines. ACS Nano. 2013;7(12):10960–10970. | ||
Lesniak A, Fenaroli F, Monopoli M, Åberg C, Dawson K, Salvati A. Effects of the presence or absence of a protein corona on silica nanoparticle uptake and impact on cells. ACS Nano. 2012;6(7):5845–5857. | ||
Gunawan C, Lim M, Marquisb CP, Amal R. Nanoparticle–protein corona complexes govern the biological fates and functions of nanoparticles. J Mater Chem B. 2014;2:2060–2083. | ||
Treuel L, Brandholt S, Maffre P, Wiegele S, Shang L, Nienhaus G. Impact of protein modification on the protein corona on nanoparticles and nanoparticle-cell interactions. ACS Nano. 2014;8(1):503–513. | ||
Holt B, Dahl K, Islam M. Quantification of uptake and localization of bovine serum albumin-stabilized single-wall carbon nanotubes in different human cell types. Small. 2011;7(16):2348–2355. | ||
Lu N, Li J, Tian R, Peng Y. Binding of human serum albumin to single-walled carbon nanotubes activated neutrophils to increase production of hypochlorous acid, the oxidant capable of degrading nanotubes. Chem Res Toxicol. 2014;27(6):1070–1077. | ||
Vaijayanthimala V, Tzeng YK, Chang HC, Li CL. The biocompatibility of fluorescent nanodiamonds and their mechanism of cellular uptake. Nanotechnology. 2009;20(42):425103. | ||
Faklaris O, Joshi V, Irinopoulou T, et al. Photoluminescent diamond nanoparticles for cell labelling: study of the uptake mechanism in mammalian cells. ACS Nano. 2009;3(12):3955–3962. | ||
Alhaddad A, Durieu C, Dantelle G, et al. Influence of the internalization pathway on the efficacy of siRNA delivery by cationic fluorescent nanodiamonds in the Ewing sarcoma cell model. PLoS One. 2012;7(12):e52207. | ||
Du S, Kendall K, Toloueinia P, Mehrabadi Y, Gupta G, Newton J. Aggregation and adhesion of gold nanoparticles. J Nanopart Res. 2012;14:758. | ||
Neugart F, Zappe A, Jelezko F, et al. Dynamics of diamond nanoparticles in solution and cells. Nano Lett. 2007;7(12):3588–3591. | ||
Xin X, Xu G, Li H. Dispersion and property manipulation of carbon nanotubes by self-assemibles of amphiphilic molecules. Physical and Chemical Properties of Carbon Nanotubes. Suzuki S, editor. Croatia: INTECH; 2013:255–273. | ||
Carmona-Ribeiro AM, Vieira DB. Cationic nanoparticles for delivery of amphotericin B: preparation, characterization and activity in vitro. J Nanobiotechnology. 2008;6:6. | ||
Cherng J, van de Wetering P, Talsma H, Crommelin D, Hennink W. Effect of size and serum proteins on transfection efficiency of poly ((2-dimethylamino)ethyl methacrylate)-plasmid nanoparticles. Pharm Res. 1996;13(7):1038–1042. | ||
Audouy S, Molema G, de Leij L, Hoekstra D. Serum as a modulator of lipoplex-mediated gene transfection: dependence of amphiphile, cell type and complex stability. J Gene Med. 2000;2(6):465–476. | ||
Alkilany AM, Murphy CJ. Toxicity and cellular uptake of gold nano particles: What we have learned so far? J Nanopart Res. 2010;12(7):2313–2333. | ||
Vesaratchanon S, Nikolov A, Wasan D. Sedimentation in nano-colloidal dispersions: effects of collective interactions and particle charge. Adv Colloid Interfac. 2007;134–135:268–278. | ||
Allouni Z, Cimpan M, Høl P, Skodvin T, Gjerdet N. Agglomeration and sedimentation of TiO2 nanoparticles in cell culture medium. Colloid Surface B. 2009;68(1):83–87. | ||
Dobrovolskaia M, Patri A, Zheng J, et al. Interaction of colloidal gold nanoparticles with human blood: effects on particle size and analysis of plasma protein binding profiles. Nanomedicine. 2009;5(2):106–117. | ||
Lacerda S, Park J, Meuse C, et al. Interaction of gold nanoparticles with common human blood proteins. ACS Nano. 2010;4(1):365–379. | ||
Aggarwal P, Hall J, McLeland C, Dobrovolskaia M, McNeil S. Nanoparticle interaction with plasma proteins as it relates to particle biodistribution, biocompatibility and therapeutic efficacy. Adv Drug Deliver Rev. 2009;61(6):428–437. | ||
Akinc A, Querbes W, De S, et al. Targeted delivery of RNAi therapeutics with endogenous and exogenous ligand-based mechanisms. Mol Ther. 2010;10(7):1357–1364. | ||
Pino PD, Pelaz B, Zhang Q, Maffre P, Nienhausbc GU, Parak WJ. Protein corona formation around nanoparticles – from the past to the future. Mater Horiz. 2014;1:301. | ||
Rahman M, Laurent S, Tawil N, Yahia LH, Mahmoudi M. Nanoparticle and protein corona. Protein-Nanoparticle Interactions. Vol. 15. Berlin: Springer; 2013:21–44. | ||
Honary S, Foruhe Z. Effect of zeta potential on the properties of nano-drug delivery systems – a review (part 2). Trop J Pharm Res. 2013;12(2):265–273. | ||
Ade H, Stoll H. Near-edge X-ray absorption fine-structure microscopy of organic and magnetic materials. Nat Mater. 2009;8:281–290. | ||
Graf C, Meinke M, Gao Q, et al. Qualitative detection of single submicron and nanoparticles in human skin by scanning transmission x-ray microscopy. J Biomed Opt. 2009;14(2):021015. | ||
Goode A, Hine N, Chen S, et al. Mapping functional groups on oxidised multi-walled carbon nanotubes at the nanometre scale. Chem Commun. 2014;50(51):6744–6747. | ||
Behrens S, Kappler A, Obst M. Linking environmental processes to the in situ functioning of microorganisms by high-resolution secondary ion mass spectrometry (NanoSIMS) and scanning transmission X-ray microscopy (STXM). Environ Microbiol. 2012;14(11):2851–2869. | ||
Hitchcock A, Dynes J, Johansson G, Wang J, Botton G. Comparison of NEXAFS microscopy and TEM-EELS for studies of soft matter. Micron. 2008;39(6):741–748. | ||
Koprinarov I, Hitchcock AP. X-ray spectromicroscopy of polymers: an introduction for the non-specialist. Hamilton, ON: Unicorn Mcmaster; 2000. Available from: http://unicorn.mcmaster.ca/stxm-intro/polystxmintro-all.pdf. Accessed October 20, 2015. | ||
Lawrence J, Swerhone G, Leppard G, et al. Scanning transmission X-ray, laser scanning, and transmission electron microscopy mapping of the exopolymeric matrix of microbial biofilms. Appl Environ Microb. 2003;69(9):5543–5554. | ||
Suzuki H, Toyooka T, Ibuki Y. Simple and easy method to evaluate uptake potential of nanoparticles in mammalian cells using a flow cytometric light scatter analysis. Envir Sci Tech. 2007;41(8):3018–3024. | ||
Smith BR, Niebert M, Plakhotnik T, Zvyagin AV. Transfection and imaging of diamond nanocrystals as scattering optical labels. J Lumin. 2007;127(1):260–263. | ||
Hui YY, Cheng CL, Chang HC. Nanodiamonds for optical bioimaging. J Phys D Appl Phys. 2010;43:374021. | ||
Halamoda Kenzaoui B, Chapuis Bernasconi C, Guney-Ayra S, Juillerat-Jeanneret L. Induction of oxidative stress, lysosome activation and autophagy by nanoparticles in human brain-derived endothelial cells. Biochem J. 2012;441(3):813–821. | ||
Marina O, Sanders C, Mourant J. Correlating light scattering with internal cellular structures. Biomed Opt Express. 2012;3(2):296–312. | ||
BD Biosciences. Flow Cytometry Web-Based Training. Available from: m.bdbiosciences.com/us/support/s/itf_launch. Accessed October 30, 2015. | ||
Zuhorn I, Visser W, Bakowsky U, Engberts J, Hoekstra D. Interference of serum with lipoplex-cell interaction: modulation of intracellular processing. Biochim Biophys Acta. 2002;1560(1–2):25–36. | ||
Tandia B, Vandenbranden M, Wattiez R, Lakhdar Z, Ruysschaert J, Elouahabi A. Identification of human plasma proteins that bind to cationic lipid/DNA complex and analysis of their effects on transfection efficiency: implications for intravenous gene transfer. Mol Ther. 2003;8(2):264–273. | ||
Lesniak A, Campbell A, Monopoli M, Lynch I, Salvati A, Dawson K. Serum heat inactivation affects protein corona composition and nanoparticle uptake. Biomaterials. 2010;31(36):9511–9518. | ||
Rejman J, Conese M, Hoekstra D. Gene transfer by means of lipo- and polyplexes: role of clathrin and caveolae-mediated endocytosis. J Lipos Res. 2006;16(3):237–247. | ||
Rejman J, Oberle V, Zuhorn I, Hoekstra D. Size-dependent internalization of particles via the pathways of clathrin- and caveolae-mediated endocytosis. Biochem J. 2004;377(pt 1):159–169. | ||
dos Santos T, Varela J, Lynch I, Salvati A, Dawson K. Effects of transport inhibitors on the cellular uptake of carboxylated polystyrene nanoparticles in different cell lines. PLoS One. 2011;6(9):e24438. | ||
Kummitha CM, Malamas AS, Lu ZR. Albumin pre-coating enhances intracellular siRNA delivery of multifunctional amphiphile/siRNA nanoparticles. Int J Nanomed. 2012;7:5205–5214. | ||
Piao L, Li H, Teng L, et al. Human serum albumin-coated lipid nanoparticles for delivery of siRNA to breast cancer. Nanomedicine. 2013;9(1):122–129. | ||
Wang Z, Tiruppathi C, Minshall R, Malik A. Size and dynamics of caveolae studied using nanoparticles in living endothelial cells. ACS Nano. 2009;3(12):4110–4116. | ||
Pelkmans L, Helenius A. Endocytosis via caveolae. Traffic. 2002;3(5):311–320. | ||
Caracciolo G, Callipo L, De Sanctis S, Cavaliere C, Pozzi D, Laganà A. Surface adsorption of protein corona controls the cell internalization mechanism of DC-Chol-DOPE/DNA lipoplexes in serum. Biochim Biophys Acta. 2010;1798(3):536–543. | ||
Saptarshi SR, Duschl A, Lopata AL. Interaction of nanoparticles with proteins: relation to bio-reactivity of the nanoparticle. J Nanobiotechnology. 2013;11:26. | ||
Dutta D, Sundaram S, Teeguarden J, et al. Adsorbed proteins influence the biological activity and molecular targeting of nanomaterials. Toxicol Sci. 2007;100(1):303–315. | ||
Kim E, Ehrmann K, Uhlhorn S, Borja D, Arrieta-Quintero E, Parel J. Semiautomated analysis of optical coherence tomography crystalline lens images under simulated accommodation. J Biomed Opt. 2011;16(5):056003. |
 © 2016 The Author(s). This work is published and licensed by Dove Medical Press Limited. The
full terms of this license are available at https://www.dovepress.com/terms
and incorporate the Creative Commons Attribution
- Non Commercial (unported, 3.0) License.
By accessing the work you hereby accept the Terms. Non-commercial uses of the work are permitted
without any further permission from Dove Medical Press Limited, provided the work is properly
attributed. For permission for commercial use of this work, please see paragraphs 4.2 and 5 of our Terms.
© 2016 The Author(s). This work is published and licensed by Dove Medical Press Limited. The
full terms of this license are available at https://www.dovepress.com/terms
and incorporate the Creative Commons Attribution
- Non Commercial (unported, 3.0) License.
By accessing the work you hereby accept the Terms. Non-commercial uses of the work are permitted
without any further permission from Dove Medical Press Limited, provided the work is properly
attributed. For permission for commercial use of this work, please see paragraphs 4.2 and 5 of our Terms.