Back to Journals » Journal of Asthma and Allergy » Volume 10
Lung sound analysis helps localize airway inflammation in patients with bronchial asthma
Authors Shimoda T ![]() , Obase Y
, Obase Y ![]() , Nagasaka Y, Nakano H, Ishimatsu A, Kishikawa R, Iwanaga T
, Nagasaka Y, Nakano H, Ishimatsu A, Kishikawa R, Iwanaga T
Received 27 October 2016
Accepted for publication 25 January 2017
Published 27 March 2017 Volume 2017:10 Pages 99—108
DOI https://doi.org/10.2147/JAA.S125938
Checked for plagiarism Yes
Review by Single anonymous peer review
Peer reviewer comments 3
Editor who approved publication: Dr Amrita Dosanjh
Terufumi Shimoda,1 Yasushi Obase,2 Yukio Nagasaka,3 Hiroshi Nakano,1 Akiko Ishimatsu,1 Reiko Kishikawa,1 Tomoaki Iwanaga1
1Clinical Research Center, Fukuoka National Hospital, Fukuoka, 2Second Department of Internal Medicine, School of Medicine, Nagasaki University, Nagasaki, 3Kyoto Respiratory Center, Otowa Hospital, Kyoto, Japan
Purpose: Airway inflammation can be detected by lung sound analysis (LSA) at a single point in the posterior lower lung field. We performed LSA at 7 points to examine whether the technique could identify the location of airway inflammation in patients with asthma.
Patients and methods: Breath sounds were recorded at 7 points on the body surface of 22 asthmatic subjects. Inspiration sound pressure level (ISPL), expiration sound pressure level (ESPL), and the expiration-to-inspiration sound pressure ratio (E/I) were calculated in 6 frequency bands. The data were analyzed for potential correlation with spirometry, airway hyperresponsiveness (PC20), and fractional exhaled nitric oxide (FeNO).
Results: The E/I data in the frequency range of 100–400 Hz (E/I low frequency [LF], E/I mid frequency [MF]) were better correlated with the spirometry, PC20, and FeNO values than were the ISPL or ESPL data. The left anterior chest and left posterior lower recording positions were associated with the best correlations (forced expiratory volume in 1 second/forced vital capacity: r=–0.55 and r=–0.58; logPC20: r=–0.46 and r=–0.45; and FeNO: r=0.42 and r=0.46, respectively). The majority of asthmatic subjects with FeNO ≥70 ppb exhibited high E/I MF levels in all lung fields (excluding the trachea) and V50%pred <80%, suggesting inflammation throughout the airway. Asthmatic subjects with FeNO <70 ppb showed high or low E/I MF levels depending on the recording position, indicating uneven airway inflammation.
Conclusion: E/I LF and E/I MF are more useful LSA parameters for evaluating airway inflammation in bronchial asthma; 7-point lung sound recordings could be used to identify sites of local airway inflammation.
Keywords: airway obstruction, expiration sound pressure level, inspiration sound pressure level, expiration-to-inspiration sound pressure ratio, 7-point analysis
Introduction
Previous studies on lung sound analysis (LSA) in patients with bronchial asthma have mostly analyzed abnormal sounds and audible rales and have reported on the mechanism of lung sound generation. LSA studies on bronchial asthma have generally reported sound amplification in a high-frequency range >400 Hz and the elevation of the median frequency F50 and/or F75, but these reports are mostly based on the analysis of rales, including wheezing.1–3
When rales are heard in asthma patients, it is reasonable to speculate that airway inflammation and narrowing are present. However, given that asthma is a chronic inflammatory disease of the airway, inflammation exists in the airway even under stable conditions with no attacks. There have been reports that breath sound frequency components were correlated with the extent of airway obstruction as assessed by an airway hyperresponsiveness test, even in the absence of wheezing.4,5 Other studies have reported that inspiration sound pressure at 700 Hz increased with the severity of bronchial asthma in children without wheezing, demonstrating a significant correlation of the sound pressure at 700 Hz with the forced expiratory volume in 1 second/forced vital capacity (FEV1.0/FVC) ratio and the maximal expiratory flow rate at 50% of the vital capacity (FEF50%predicted).6 However, little information is available on the correlation between airway inflammation and lung sounds in bronchial asthma patients.
We have previously reported that in asthma patients who are in an attack-free period and exhibit normal sounds based on conventional stethoscope auscultation, airway inflammation can be detected by LSA at a single point in the posterior lower lung field.7,8
However, existing evidence indicates that airway inflammation and sites of narrowing are found as an uneven mixture of normal and abnormal tissues rather than uniform lesions throughout the lung fields.9,10
In this study, we performed LSA at 7 points in the trachea and in the anterior and posterior chest regions in asthmatic subjects who were in an attack-free, stable condition and had normal stethoscopic findings. The aim of this work was to determine whether LSA can be used for the local diagnosis of abnormal sites (with airway inflammation) vs normal sites (without airway inflammation).
Patients and methods
Subjects
This study included 20 healthy volunteers and 22 subjects with mild persistent bronchial asthma. Lung sound data from the 20 healthy volunteers presented in this article were previously published.11 All asthmatic subjects who first visited our hospital from September 2011 to November 2014 included in this study fulfilled the Global Initiative for Asthma criteria.10 All included asthmatic subjects had a history of asthmatic symptoms, including recurrent cough, wheezing, or dyspnea, and had positive airway hyperresponsiveness, ie, a provocative concentration of acetylcholine (Ach) causing a 20% decrease in FEV1.0 (PC20) of <8000 μg/mL. Airway reversibility (ie, reversible with at least 12% and 200 mL improvements in FEV1.0 after bronchodilator therapy) was confirmed in 16 of the asthmatic subjects but not in the remaining 6, who exhibited normal lung function during their first visit to our hospital; these asthmatic subjects were diagnosed with bronchial asthma based on their medical history and PC20-positive results. Cases complicated with chronic pulmonary obstructive disease (COPD) and asthmatic subjects with cardiopulmonary disease affecting pulmonary function were excluded. All asthmatic subjects retained normal diffusion capacity, and no asthmatic subjects had previously used inhaled or oral corticosteroids. Antiasthma drugs, including bronchodilators, were discontinued for at least 24 hours prior to this examination. Wheezing was not heard during auscultation in any patient.
The ethics committee of Fukuoka National Hospital approved the study protocol (protocol number 23-14), and all participants received verbal and written study information before providing their informed consent.
Lung sound measurements
Breath sounds were recorded using a custom-made recording system for lung sounds in a quiet room in the hospital. The recording system comprised 7 air-coupled microphones (ECM-PC60; Sony, Tokyo, Japan), amplifiers, a pneumotachograph (SP-310; Fukuda Sangyo, Chiba, Japan), an analog-to-digital converter, and a personal computer. Microphones were attached to 7 sites on the chest wall (2 cm above the top of the episternum, bilaterally at the anterior second intercostal space on the midclavicular line, bilaterally on the back between the fifth vertebra and scapulas, and 3 cm above the lung base at the midscapular line) with a rubber-made attachment and double-sided adhesive tape (gain: 40 dB for lung sound channels, 16 dB for tracheal sound channel) (Figure 1A). The breath sounds acquired by the 7 microphones were amplified and subsequently digitized with a 16-bit resolution at a sampling frequency of 12.5 kHz per channel. The recording system was calibrated using a reference sound pressure (94 dB [0 dB =20 µPa], 1 kHz). Airflow in the mouth was measured using the pneumotachograph and was digitized simultaneously (Figure 1B).
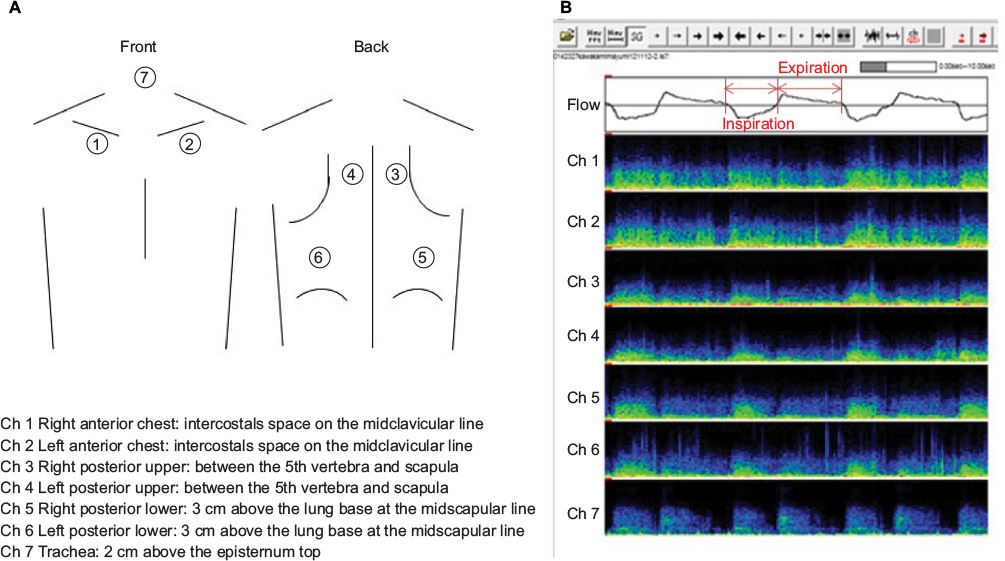 | Figure 1 (A) Seven lung sound recording positions; (B) lung sound analysis sonograms. Notes: The upper panel represents an airflow curve. The portions below and above the horizontal central line represent the inhalation and exhalation air flows, respectively. The vertical axis represents frequency (in hertz), and the horizontal axis represents time (in seconds). The colors indicate different sound pressure levels (in decibels [dBSPL]). Abbreviation: Ch, channel. |
The measurements were performed while the subject was in an upright seated position. The subjects were instructed to breathe deeply through the mouth piece of the pneumotachograph for 30 seconds. The breathing maneuver was not strictly defined; therefore, it varied according to the subject. A nose clip was used to prevent nasal breathing.
LSA procedure
The recorded sound and airflow signals were analyzed using a custom-made computer program. The program visualized the 7 lung sound channels as a spectrogram and airflow curve, simultaneously. The program scanned all the airflow data to determine the inspiratory and expiratory phases (Figure 1B). Thereafter, the program scanned the lung sound data sequentially with a Hanning window of 2048 points (0.164 ms) with 50% overlap and then calculated the power spectra using a fast Fourier transform. The program yielded 6 octave band sound pressure levels (50–100, 100–200, 200–400, 400–800, 800–1600, 1600–3200 Hz) as representative variables to characterize the lung sound spectra for each segment. Thereafter, data from noise-contaminated breaths were excluded by visually inspecting the sound spectrograms. The octave band sound pressure levels were averaged for the inspiratory (ISPL) and expiratory phases (ESPL). The ratio of ESPL to ISPL was calculated and expressed as a linear unit (E/I). The investigator who analyzed the data was blinded to the related information.
Other examinations
Measurements of the flow–volume curves, the fractional exhaled nitric oxide concentration (FeNO), the bronchial hyperresponsiveness to Ach, and the induced sputum were performed in accordance with previously described procedures.7
Statistical analysis
The Wilcoxon/Kruskal–Wallis test was performed to compare the 3 groups of E/I values among the asthmatic subjects (stratified by V50%pred of ≤80% vs >80%) and healthy volunteers for each recording point and each frequency band. For all significant differences, the Steel–Dwass test was performed for all pairwise comparisons. Next, Spearman’s rank test was performed on the data from asthmatic subjects for correlating E/I, ISPL, and ESPL values with spirometry, logPC20, and FeNO data in each frequency band. A receiver operating characteristic (ROC) analysis was performed between healthy and asthmatic subjects to establish the cutoff value at each recording point.
Results
Patient characteristics
The patient population had a mean age of 39.5 years and consisted of 7 males and 15 females. The FEV1.0%pred was 94.8±13.6 (mean ± standard deviation). The patient population was significantly different from the healthy population in terms of the age and sex ratio (Table 1).
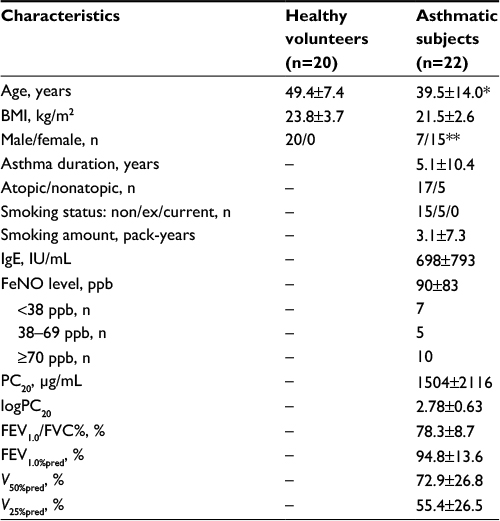 | Table 1 Patient characteristics Notes: The values are presented as number or mean ± standard deviation; **p<0.001, *p<0.01. “Atopic” is defined as a patient having ≥1 allergen or an IgE-RAST score ≥2. Abbreviations: BMI, body mass index; FeNO, fractional exhaled nitric oxide concentration; FEV1.0, forced expiratory volume in 1 second; FVC, forced vital capacity; IgE, immunoglobulin E; PC20, a provocative concentration of acetylcholine causing a 20% decrease in FEV1; %pred, % predicted; RAST, radioallergosorbent testing; V50, V25. |
Comparison of E/I in each frequency band between asthmatic and healthy subjects
Figure 2 depicts the median E/I in each frequency band from the trachea (channel [Ch]7), anterior chest (Ch2), posterior upper (Ch4), and posterior lower (Ch6) recordings, respectively, in asthmatic subjects with V50%pred <80%, those with V50%pred ≥80%, and healthy volunteers. The E/I plots based on the anterior chest, posterior upper and lower (Ch1–Ch6) recordings exhibited a negative peak centered at 100–400 Hz, as well as significantly higher E/I levels in the lower frequency bands up to 400 Hz, for asthmatic subjects with V50%pred <80% compared with the healthy volunteers (p<0.05). A significant difference in E/I was observed in the bronchial asthma patients with V50%pred <80% vs ≥80% in the data obtained from the left and right anterior chest points (Ch1 and Ch2) and the left posterior upper and lower points (Ch4 and Ch6) in the frequency bands of 100–200 Hz and 200–400 Hz; asthmatic subjects with V50%pred <80% had significantly higher E/I values than did those with V50%pred ≥80% (p<0.05) (Table 2). In contrast, the E/I plots based on the tracheal (Ch7) recordings showed a positive peak in the frequency band of 400–800 Hz (Figure 2). The E/I values monitored by tracheal recordings in asthmatic subjects with V50%pred <80% were significantly higher than those in the healthy volunteers in the bands of 50–100 Hz and 100–200 Hz (p<0.05) but not in other frequency bands (Table 2).
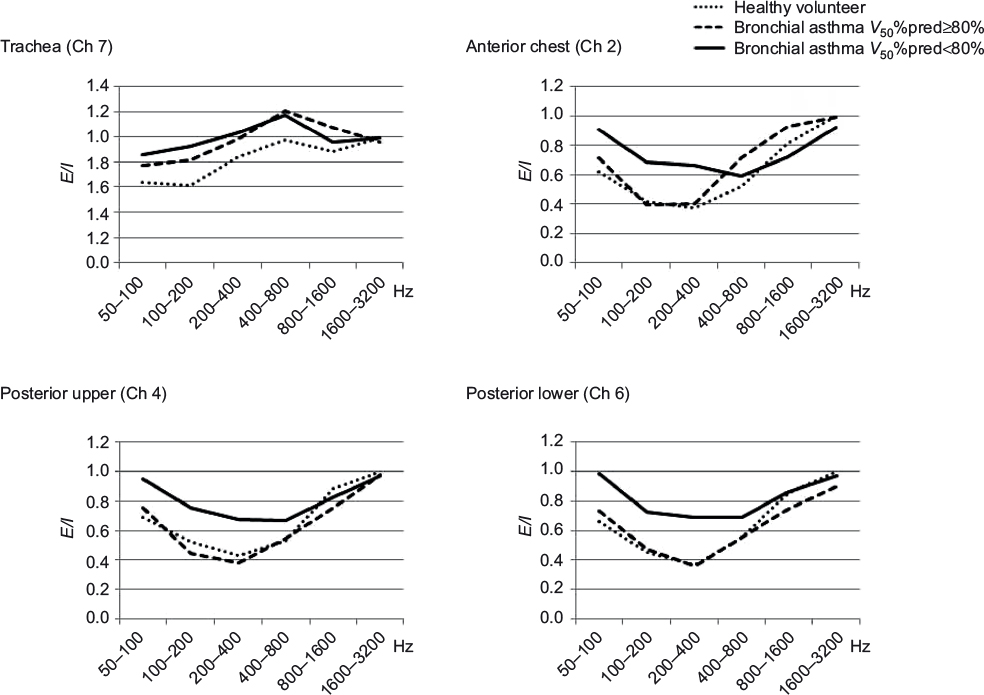 | Figure 2 E/I values in each frequency band in asthmatic subjects and healthy volunteers. Notes: The vertical axis represents E/I values, and the horizontal axis denotes frequency bands (in hertz). The medians of E/I in individual frequency bands are plotted separately for patients with V50%pred <80%, asthmatic subjects with V50%pred ≥80%, and healthy volunteers. Abbreviations: E/I, expiration-to-inspiration sound pressure ratio; %pred, %predicted; Ch, channel. |
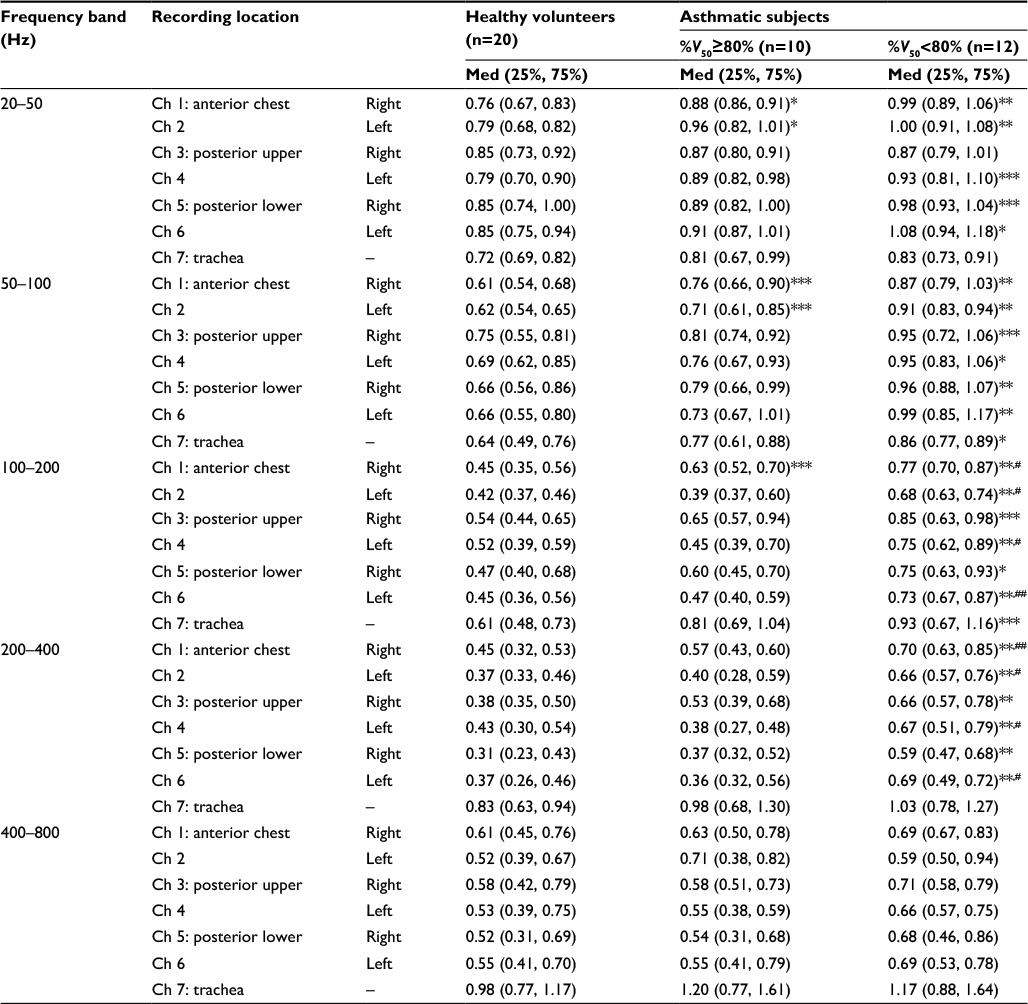 | Table 2 Comparison of E/I values in each frequency band between asthmatic subjects and healthy volunteers Notes: p-values vs healthy volunteers: ***p<0.001, **p<0.01, *p<0.05; p-values vs %V50≥80% asthmatic subjects: #p<0.05, ##p<0.01. Ch 1, right anterior chest; Ch 2, left anterior chest; Ch 3, right posterior upper; Ch 4, left posterior upper; Ch 5, right posterior lower; Ch 6, left posterior lower; Ch 7, trachea. Abbreviations: Ch, channel; Med, median; E/I, expiration-to-inspiration sound pressure ratio. |
Recording position-specific correlation of E/I, ESPL, and ISPL data with spirometry, PC20, and FeNO data in each frequency band in asthmatic subjects
The E/I values monitored at 5 recording positions, excluding the trachea (Ch7) and right posterior upper (Ch3) points, were more strongly correlated with the spirometry, logPC20, and FeNO data than were the ESPL or ISPL values. The strongest correlations of E/I with spirometry, logPC20, and FeNO were observed in the frequency bands of 100–200 Hz (low frequency [LF]) and 200–400 Hz (mid frequency [MF]). The E/I from the tracheal recording did not show a significant correlation with spirometry, logPC20, or FeNO. In contrast, the E/I from the left anterior chest (Ch2) and left posterior lower (Ch6) recordings exhibited a significant negative correlation with FEV1.0/FVC, V50%pred, V25%pred, and logPC20, as well as a significant positive correlation with FeNO. The E/I from the left posterior upper (Ch4) recording demonstrated a significant negative correlation with FEV1.0/FVC, V50%pred, and V25%pred and a significant positive correlation with FeNO. The E/I from the right anterior chest (Ch1) and right posterior lower (Ch5) recordings showed a significant negative correlation with FEV1.0/FVC, V50%pred, and V25%pred (Table 3).
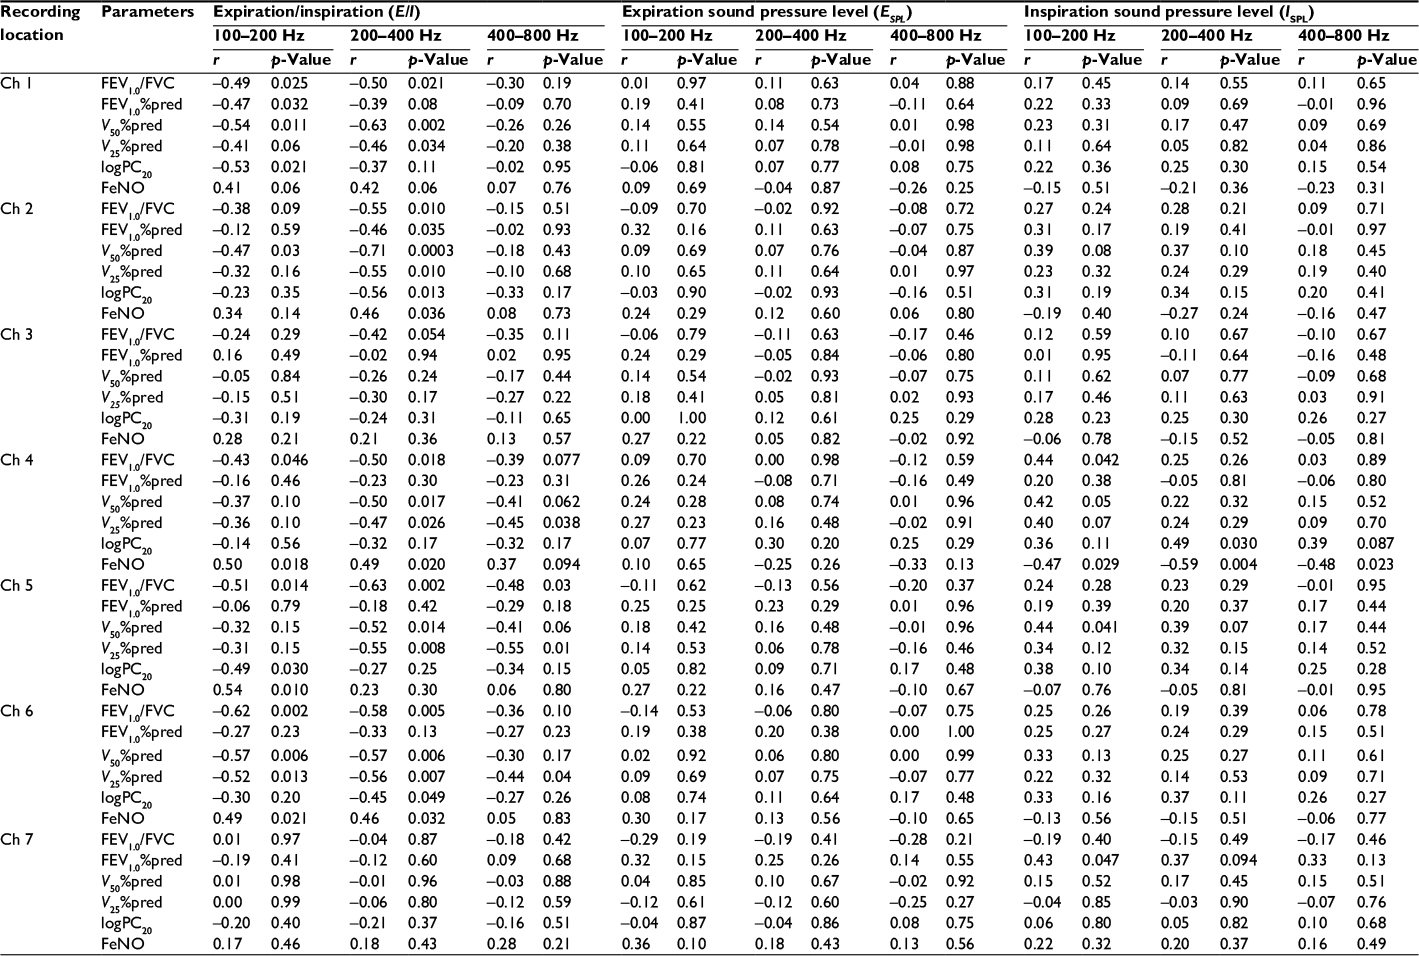 | Table 3 Correlation of E/I, ESPL, and ISPL values with spirometry, PC20, and FeNO data in each frequency band (n=22) Notes: Ch 1, right anterior chest; Ch 2, left anterior chest; Ch 3, right posterior upper; Ch 4, left posterior upper; Ch 5, right posterior lower; Ch 6, left posterior lower; Ch 7, trachea. Abbreviations: %pred, %predicted; E/I, expiration-to-inspiration sound pressure ratio; ESPL, expiration sound pressure level; ISPL, inspiration sound pressure level; PC20, provocative concentration of acetylcholine causing a 20% decrease in FEV1.0; FeNO, fractional exhaled nitric oxide concentration; FEV1.0, forced expiratory volume in 1 second; FVC, forced vital capacity. |
Establishment of E/I MF cutoff (ROC analysis)
The ROC analysis of the E/I MF from each recording point in the healthy and bronchial asthma patient populations confirmed good sensitivity and specificity, with a cutoff of 0.5–0.51 for the anterior chest (Ch1 and Ch2) and dorsal upper (Ch3 and Ch4) recordings. Good sensitivity and specificity were also confirmed, with a cutoff of 0.40 and 0.47 for the right posterior lower (Ch5) and left posterior lower (Ch6) recordings, respectively (Table 4).
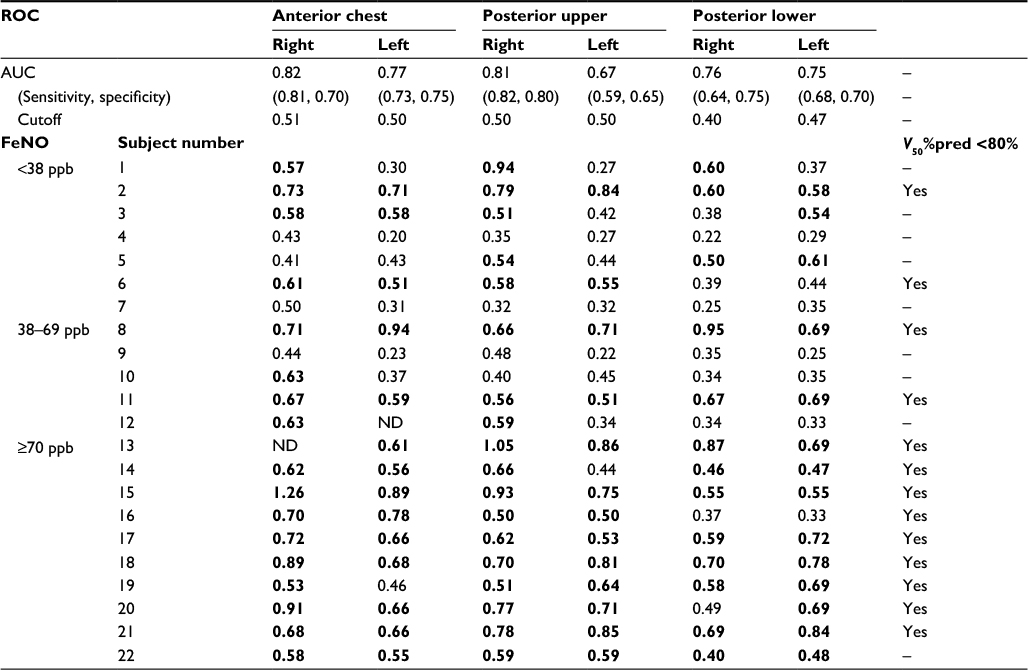 | Table 4 Differences in E/I MF among recording points in asthmatic subjects Note: Bold values are greater than the cutoff value. Abbreviations: %pred, %predicted; ROC, receiver operating characteristic; AUC, area under the curve; E/I, expiration-to-inspiration sound pressure ratio; MF, mid frequency; FeNO, fractional exhaled nitric oxide concentration; ND, not done. |
Relationship of E/I MF with FeNO and V50%pred values by recording position in asthmatic subjects
Table 4 summarizes the E/I MF data according to recording point for individual asthmatic subjects; values equal to and greater than the cutoff, as established by ROC, are shown in bold. Most asthmatic subjects with FeNO ≥70 ppb had higher E/I MF values at all recording points as well as V50%pred <80%. Asthmatic subjects with FeNO <70 ppb and V50%pred <80% had higher E/I MF values for most recording points. Asthmatic subjects with FeNO 38–69 ppb or those with FeNO <38 ppb and V50%pred ≥80% were divided into groups with lower vs higher E/I MF values according to the recording position.
Discussion
We examined asthmatic subjects using a device that can monitor lung sounds simultaneously at 7 points and analyzed the data for differences according to recording point. The results demonstrated that E/I LF and E/I MF data were better suited as indicators of airway inflammation in bronchial asthma, with the lower anterior chest (Ch2) or left posterior lower (Ch6) points being the favorable sites for recording breath sounds. The results also indicated that by recording lung sounds at 7 points, inflammation sites could be localized within the airway.
Airway narrowing in asthma is thought to be caused by an increase in airway smooth muscle tone and, to some extent, by airway wall thickening. Spirometry and airway resistance measurements are influenced primarily by larger airways because the bulk of airway resistance is located there. Small airways contribute little to these measurements because of the low velocity of air passing through them. This suggests that lung sounds are not generated in small airways but mainly in larger airways, ie, those from the trachea up to the nineth division of bronchioles.12,13 The intensity of lung sound pressure during breathing is influenced by respiratory flow volume and pulmonary filtering.14–18 To minimize interindividual differences in the respiratory flow volume, we adopted the expiration-to-inspiration sound pressure ratio (E/I) as a measure. In this study, we examined the ESPL and ISPL values in individuals with and without bronchial asthma by partitioning the lung sound data into 6 frequency bands. This approach revealed the highest sound pressure levels in the frequency range from 50 to 100 Hz and a decreasing trend in the sound pressure level with increasing frequency. This decreasing pattern varied with recording position; the anterior chest, posterior upper, and posterior lower recordings demonstrated a linear, decreasing trend with increasing frequency, while the tracheal recording yielded a steep decline (from 400 up to 1600 Hz) followed by a plateau (data not shown). In contrast, when E/I was plotted on the vertical axis against frequency (in hertz) on the horizontal axis, the plots based on the anterior chest and posterior upper and lower recordings exhibited a negative peak centered at the 100–200 Hz and 200–400 Hz bands (Figure 2). Asthmatic subjects with more airway narrowing showed significantly higher E/I values in the 100–200 Hz and 200–400 Hz bands than did those with less severe airflow limitations or healthy volunteers. In the frequency range <100 Hz, asthmatic subjects with more airway narrowing had significantly higher E/I values than did healthy volunteers, but no correlation was noted with other parameters, such as respiratory function (data not shown). These results can likely be attributed to muscle- and heart-associated noises, which are more pronounced in the frequency range <100 Hz.19
We have previously used an analysis of single-point recordings in the lung base to show that E/I MF is best suited for evaluating airway inflammation in bronchial asthma.7,8 In this analysis with multiple-point recordings, we demonstrate that the E/I values in the frequency bands of 100–200 Hz and 200–400 Hz (E/I LF and E/I MF, respectively) were strongly correlated with airway narrowing, hyperresponsiveness, and inflammation when the lung sounds were recorded at the anterior chest and posterior upper and lower points. We did not find a significant correlation of the E/I data obtained at the right posterior upper (Ch3) point with airway narrowing, hyperresponsiveness, or inflammation, and it is unknown whether this is due to recording position or to incidental events. The heart is located on the left lung side, the left bronchial tubes are narrower than the right bronchial tubes, and the left lung sounds are said to be stronger than the right lung sounds.20–22 Our finding of better correlations in the left lung field than in the right lung field may be attributed to lower noise levels and stronger lung sounds. However, the tracheal (Ch7) recordings resulted in E/I–frequency plots that were different from those generated from the other recordings; the data from the trachea did not correlate with any asthma-indicating factor, such as respiratory function, PC20, or FeNO. The results of this study confirmed that analyzing E/I values calculated based on tracheal recordings could not adequately support the diagnosis of bronchial asthma. Therefore, recordings in lung fields other than the tracheal and right posterior regions may be recommended for diagnosing bronchial asthma using E/I data.
Bronchial asthma is a chronic inflammatory disease that involves the airway and leads to increased airway hyperresponsiveness. Because the location of airway inflammation varies from patient to patient, the location of airway narrowing is also variable and uneven. Wang and Xiong23 reported the presence of left-to-right differences in the vibration energy caused by the respiration of asthmatic subjects. When we summarized the E/I MF data from asthmatic subjects by recording position along with FeNO and V50%pred values (Table 4), in asthmatic subjects, severe airway inflammation with FeNO ≥70 ppb was associated with high E/I MF values at all recording points in the anterior chest, posterior upper, and posterior lower regions. In these asthmatic subjects, these observations suggest that more generalized airway inflammation is present and that peripheral airway narrowing exists even during attack-free periods. Asthmatic subjects with FeNO <38 ppb and V50%pred ≥80% were divided into 2 groups: one with lower E/I MF values at recording positions except the trachea, and the other with higher E/I MF values depending on the recording position. Asthmatic subjects with low E/I MF values are considered to be free of airway inflammation, and those with high E/I MF values are likely to have local eosinophilic or neutrophilic airway inflammation wherein a high E/I is detected. These asthmatic subjects are likely to have airway inflammation unevenly in the bronchial tubes, and the location of airway inflammation may be detected by E/I MF monitoring. Asthmatic subjects with FeNO 38–70 ppb, along with V50%pred ≥80% and low E/I MF values at all recording points, may have an elevated FeNO level due to upper respiratory tract inflammation, such as rhinitis, while maintaining normal respiratory function under stable asthmatic conditions. Asthmatic subjects with low FeNO and V50%pred levels and high E/I MF values are suspected to have neutrophilic airway inflammation.
Further study is required to examine differences by position in a larger sample size. In our analysis, there were significant differences in age and sex between the healthy and bronchial asthmatic populations. Lung sound data from the healthy volunteers presented in this article were previously published11 and did not include immunoglobulin E data. However, these factors may not have had an impact on these results, as previous data from our laboratory suggested that sex and age do not affect the E/I LF or E/I MF values7,8 and the primary outcomes of this study were evidently clarified by the asthmatic subject data.
Conclusion
More useful LSA parameters for the evaluation of airway inflammation in bronchial asthma are E/I LF and E/I MF, and breath sounds should be recorded at the anterior chest or left posterior lower position. E/I LF and E/I MF monitoring with 7-point lung sound recordings may be used to detect not only inflammation of the entire airway but also sites of local airway inflammation or of airway narrowing caused by airway inflammation.
Acknowledgment
We thank Miss M Oda and Miss K Kojima for their technical assistance and for performing the statistical analyses. This study was supported by research funding from the Fukuoka National Hospital, Japan.
Disclosure
The authors report no conflicts of interest in this work.
References
Malmberg LP, Pesu L, Sovijarvi AR. Significant differences in flow standardised breath sound spectra in patients with chronic obstructive pulmonary disease, stable asthma, and healthy lungs. Thorax. 1995;50(1):1285–1291. | ||
Malmberg LP, Kallio K, Haltsonen S, Katila T, Sovijärvi ARA. Classification of lung sounds in patients with asthma, emphysema, fibrosing alveolitis and healthy lungs by using self-organizing maps. Clin Physiol. 1996;16(2):115–129. | ||
Schreur HJW, Vanderschoot J, Zwinderman AH, Dijkman JH, Sterk PJ. The effect of methacholine-induced acute airway narrowing on lung sounds in normal and asthmatic subjects. Eur Respir J. 1995;8(2):257–265. | ||
Anderson K, Aitken S, Carter R, Macleod JES, Moran F. Variation of breath sound and airway caliber induced by histamine challenge. Am Rev Respir Dis. 1990;141(5):1147–1150. | ||
Malmberg LP, Sovijärvi AR, Paajanen E, Piirilä P, Haahtela T, Katila T. Changes in frequency spectra of breath sounds during histamine challenge test in adult asthmatics and healthy control subjects. Chest. 1994;105(1):122–131. | ||
Habukawa C, Murakami K, Endoh M, Yamada M, Horii N, Nagasaka Y. Evaluation of airflow limitation using a new modality of lung sound analysis in asthmatic children. Allergol Int. 2015;64(1):84–89. | ||
Shimoda T, Nagasaka Y, Obase Y, Kishikawa R, Iwanaga T. Prediction of airway inflammation in patients with asymptomatic asthma by using lung sound analysis. J Allergy Clin Immunol Pract. 2014;2(6):727–732. | ||
Shimoda T, Obase Y, Nagasaka Y, Nakano H, Kishikawa R, Iwanaga T. Lung sound analysis and airway inflammation in bronchial asthma. J Allergy Clin Immunol Pract. 2016;4(3):505–511. | ||
Sung A, Naidich D, Belinskaya I, Raoof S. The role of chest radiography and computed tomography in the diagnosis and management of asthma. Curr Opin Pulm Med. 2007;13(1):31–36. | ||
Tgavalekos NT, Tawhai M, Harris RS, et al. Identifying airways responsible for heterogeneous ventilation and mechanical dysfunction in asthma: an image functional modeling approach. J Appl Physiol. 2005;99(6):2388–2397. | ||
Ishimatsu A, Nakano H, Nogami H, Yoshida M, Iwanaga T, Hoshino T. Breath sound intensity during tidal breathing in COPD patients. Intern Med. 2015;54(10):1183–1191. | ||
Banaszak EF, Kory RC, Snider GL. Phonopneumography. Am Rev Respir Dis. 1973;107(3):449–455. | ||
Forgacs P, Nathoo AR, Richardson HD. Breath sounds. Thorax. 1971;26(3):288–295. | ||
Ploy-Song-Sang Y, Martin RR, Ross WR, Loudon RG, Macklem PT. Breath sounds and regional ventilation. Am Rev Respir Dis. 1977;116(2):187–199. | ||
Ploy-Song-Sang Y, Macklem PT, Ross WR. Distribution of regional ventilation measured by breath sounds. Am Rev Respir Dis. 1978;117(4):657–664. | ||
Kraman SS. The relationship between airflow and lung sound amplitude in normal subjects. Chest. 1984;86(2):225–229. | ||
Yosef M, Langer R, Lev S, Glickman YA. Effect of airflow rate on vibration response imaging in normal lungs. Open Respir Med J. 2009;3(1):116–122. | ||
Shykoff BE, Ploysongsang Y, Chang HK. Airflow and normal lung sounds. Am Rev Respir Dis. 1988;137(4):872–876. | ||
Kraman SS. Does the vesicular lung sound come only from the lungs? Am Rev Respir Dis. 1983;128(4):622–626. | ||
Kompis M, Pasterkamp H, Oh Y, Wodicka G. Distribution of inspiratory and expiratory respiratory sound intensity on the surface of the human thorax engineering in medicine and biology society. Poster presented at: Proceedings of the 19th Annual International Conference of the IEEE; Oct 30–Nov 2; 1997; Chicago, IL. | ||
Jones A, Jones RD, Kwong K, Burns Y. Effect of positioning on recorded lung sound intensities in subjects without pulmonary dysfunction. Phys Ther. 1999;79(7):682–690. | ||
Kraman SS. Lung sounds: relative sites of origin and comparative amplitudes in normal subjects. Lung. 1983;161(1):57–64. | ||
Wang Z, Xiong YX. Lung sound patterns help to distinguish congestive heart failure, chronic obstructive pulmonary disease, and asthma exacerbations. Acad Emerg Med. 2012;19(1):79–84. |
 © 2017 The Author(s). This work is published and licensed by Dove Medical Press Limited. The
full terms of this license are available at https://www.dovepress.com/terms
and incorporate the Creative Commons Attribution
- Non Commercial (unported, 3.0) License.
By accessing the work you hereby accept the Terms. Non-commercial uses of the work are permitted
without any further permission from Dove Medical Press Limited, provided the work is properly
attributed. For permission for commercial use of this work, please see paragraphs 4.2 and 5 of our Terms.
© 2017 The Author(s). This work is published and licensed by Dove Medical Press Limited. The
full terms of this license are available at https://www.dovepress.com/terms
and incorporate the Creative Commons Attribution
- Non Commercial (unported, 3.0) License.
By accessing the work you hereby accept the Terms. Non-commercial uses of the work are permitted
without any further permission from Dove Medical Press Limited, provided the work is properly
attributed. For permission for commercial use of this work, please see paragraphs 4.2 and 5 of our Terms.