Back to Journals » Clinical Ophthalmology » Volume 12
Low vision, visual impairments and metropolitan urban planning: example of a topographic enhancement, need and monitoring in an Italian city
Authors Nuzzi R ![]() , Bottacchi E, Monteu F
, Bottacchi E, Monteu F
Received 13 May 2018
Accepted for publication 18 July 2018
Published 17 October 2018 Volume 2018:12 Pages 2107—2119
DOI https://doi.org/10.2147/OPTH.S174006
Checked for plagiarism Yes
Review by Single anonymous peer review
Peer reviewer comments 2
Editor who approved publication: Dr Scott Fraser
Raffaele Nuzzi, Eleonora Bottacchi, Francesca Monteu
Eye Clinic, University of Turin, Molinette Hospital, Turin, Italy
Significance: The purpose of the study was to analyze all the steps needed to manage partially sighted or blind persons.
Purpose: The aim of the first research was to collect and analyze data and opinions regarding the mobility of visually disabled people in Turin. The aim of the second research was to assess issues, daily needs and expectations regarding the urban reclassification plan for Via Nizza (Turin).
Materials and methods: In the first study, we proposed a survey, partially structured and partially unstructured, of 100 patients enrolled in the Visual Rehabilitation Center of the Ophthalmic Hospital of Turin. In the second study, we collected data from a survey of eleven patients enrolled in the Turin section of the Italian Confederation of Blind.
Results: It was observed that the visually disabled population was not necessarily elderly (46% of the population was less than 60 years of age); it was observed that the visually disabled people were active frequently. Environmental aids considered more useful were sound traffic lights (30%) and gradient signaling (29%); the first was not widespread in urban areas and was the aid most requested by the patients enrolled (49%); 48% of enrolled patients did not use tactile maps. As regards the reclassification of the urban plan of the area in Turin, important needs and expectations were highlighted.
Conclusion: As regards urban planning in Turin as well as in other Italian cities, many changes in public facilities are to be done to ensure an increasing independence and safety of visually impaired people.
Keywords: visually disabled people, blindness, public facilities, environmental aids, sound traffic lights, gradient signaling
Introduction
The steady increase in life expectancy and improvements in the quality of life over the last several years in developed countries has caused an increase in the frequency of chronic diseases, including those associated with vision. Therefore, an increasing number of people need to address the difficulties related to low vision/visual impairment or blindness. The social awareness of this problem has certainly increased in the last several years, but there is still a long way to go incompletely understanding this problem. In Italy, until 1942, visually impaired people were considered mentally incapacitated and, therefore, disenfranchised from the Civil Code. In spite of a significant delay, the 262/42 legislation abolished this law.1
In 2017, the WHO estimated that there were 253 million visually impaired people, of which, 217 million had low vision and 36 million were blind.2
It is important to note that international banks such as “The World Bank Group” or “The European Bank for Reconstruction and Development” use data reports about the prevalence of blindness and its causes as an indicator of a country’s socio economic development. Until the mid-80s, epidemiological data on the prevalence and causes of visual impairment in Italy were limited and based on case series and information collected in other countries.1
A study carried out in 2009 by the Italian Ophthalmological Society3 estimated a prevalence of 0.56% for severely low vision among people >40 years, 0.47% for moderate-to-severe low vision, and 0.31% for moderately low vision, totaling to 1.34%.
With respect to blindness, the National Institute of Statistics4 carried out a survey that revealed the percentage of blind people to be 0.62%, corresponding to 362,000 people.
With regard to the Piedmont region, data collected by the National Institute for Social Providence5 in 2012 showed figures of 8,885 blind/disabled people in a total population of 4,457,335 people.
Topographic project
In Turin, the urban renewal project of Nizza Street originated from a previous feasibility study that was planned as part of the National Operative Programme for Metropolitan Areas (PON-Metro).
The basic principle in functional reorganization of an area is redistribution of different environmental spaces across various user categories: 1) the weakest ones; 2) pedestrians and disabled; and 3) bicycle officers and vehicle mobility.
Consequently, there will be an improvement in safety and enhanced architectural development at pedestrian crossings. All the pedestrian crossings will have safety ramps and vibro-tactile traffic lights as requested by the Blind Italian Union (UIC); thus, lighting in public areas will be increased.
Purpose
The purpose of the study was to analyze all the steps needed to assist a visually impaired person.
The aim of the first part of our research was to collect and analyze data and opinions regarding the mobility of visually disabled people in the metropolitan area of Turin. The main objectives were to study the following: 1) clinical characteristics of the patients; 2) mobility of visually disabled persons; 3) determine which environmental aids or signs were more frequently used; and 4) satisfaction of visually disabled people in the metropolitan area of Turin.
For the second part of our research, we aimed to create a rapport with visually disabled people to understand aspects of their daily living, problems, needs, and expectations from the urban renewal project of Nizza street.
As this was an ongoing project, only members of the UIC who were aware of the plan were interviewed. The survey comprised of ten questions and was administered to eleven subjects. The ethics committee of our institution (Ospedale Oftalmico Sperino, Torino) reviewed the study protocol. The protocol did not require any specific formal approval because our study involved only a verbal interview, without any clinical or surgical intervention. Verbal informed consent was obtained from all the participants, and the ethics committee approved the verbal consent process.
Materials and methods
First survey
Data collection for the first survey was done in 2014 after participants gave their verbal consent. Both structured and unstructured questionnaires were administered to the participants.
One hundred subjects were recruited from the Visual Rehabilitation Center of the Ophthalmic Hospital in Turin. The survey was submitted orally via direct or telephonic interview.
The inclusion criteria were as follows: 1) participants must be Turin residents and must independently use public places at least twice a week or reside in neighboring provinces but have the need of independent travel to Turin at least twice a week for employment/personal/academic reasons; 2) those having mild, moderate, or severe visual disability or partial or total blindness certified by the criteria of the law number 138, (Classification and Quantification of Visual Handicap and Ophthalmic Investigations), stipulated the 3rd of April 2001; and 3) those who were at least 18 years old.
The exclusion criteria were as follows: 1) no psychological or psychiatric illnesses, degenerative nervous system diseases, or use of drugs that could compromise cognitive processes or judgment abilities; and 2) less frequent use of public places (less than twice a week) or use of public places only with assistance.
The survey comprised five sections (Table 1).
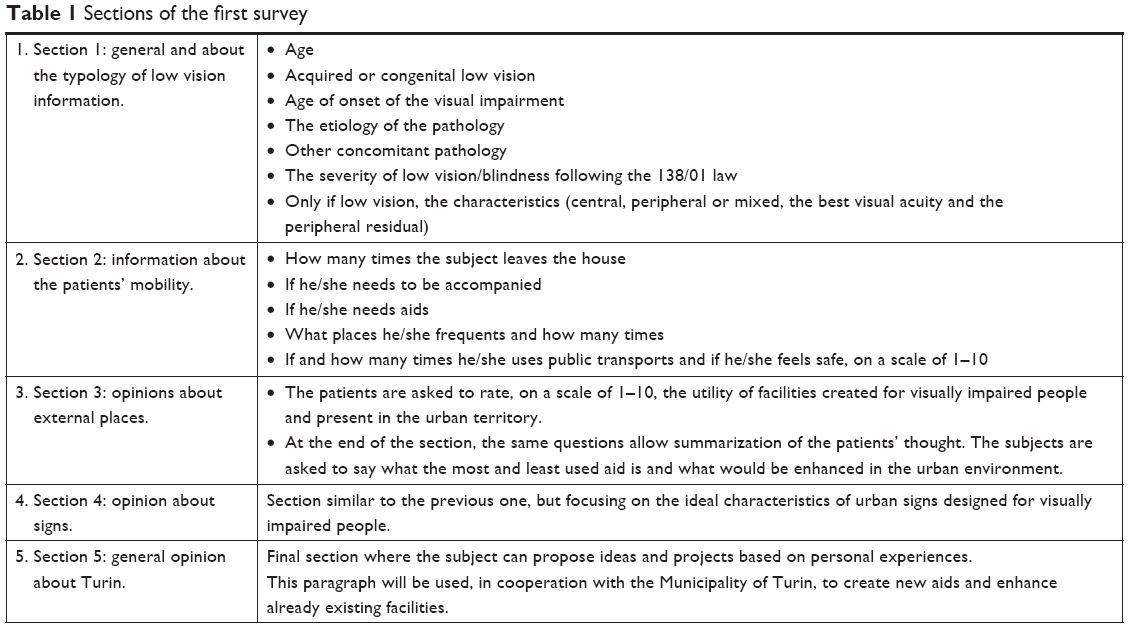 | Table 1 Sections of the first survey |
The study was conducted in accordance with the tenets of the Declaration of Helsinki.
Second survey
With respect to the second part of our research, performed in 2017, data collection was carried out using a partly structured and partly unstructured questionnaire after obtaining verbal consent from participants. The eleven included subjects were recruited from the Turin region of the UIC. The questionnaire was administered directly or indirectly through e-mail or telephonic interview. The questions are listed in Table 2. This section of the research too fulfilled the requirements of the Declaration of Helsinki.
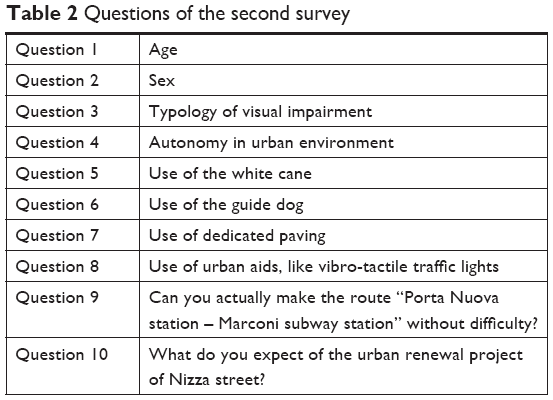 | Table 2 Questions of the second survey |
Results
First survey
General information and typology of visual impairment
The aim of this section was to analyze the population sample and study the clinical characteristics of blind and visually impaired people of Turin. The mean age was 59 years.
The age classification of the patients is reported in Figure 1. The most represented class consisted of people in the range of 70–79 years (24%) and the group with the least number of representatives was 30–39 years old (2%). With respect to visual impairment typology, 74% of the patients had an acquired visual impairment, while 26% had a congenital visual impairment.
 | Figure 1 Age classification. |
The mean number of disease years was 27. In particular, the mean disease duration was 43 years for congenital impairment and 21 years for acquired impairment. The majority (30%) of the (acquired) visually impaired people had 11–29 years of visual impairment (Figure 2). With respect to the causes of the diseasethere was a wide range of visual impairments as generally described in Figure 3 and in detail in Figures 4–9. Figure 10 shows data regarding severity of visual impairment in accordance with the 138/01 law.
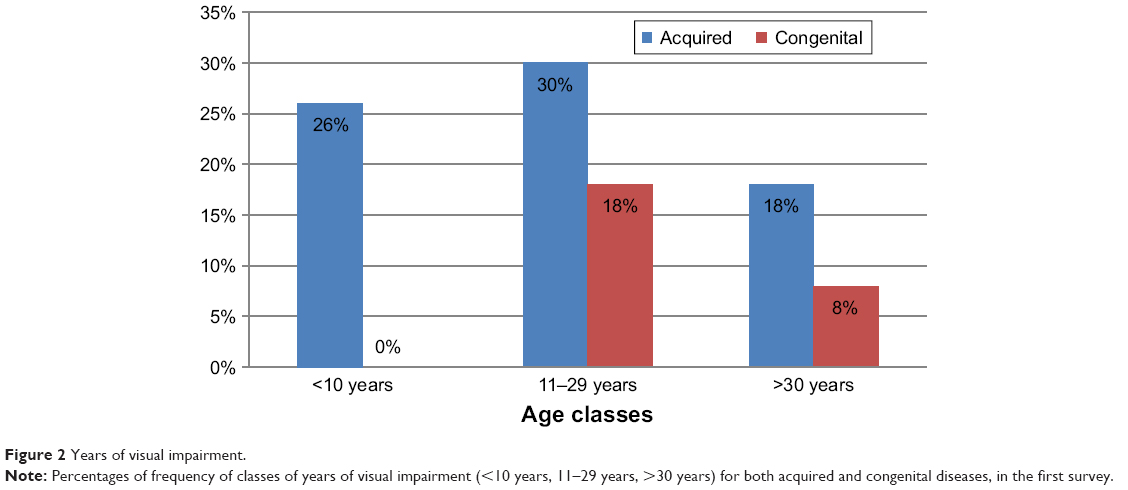 | Figure 2 Years of visual impairment. |
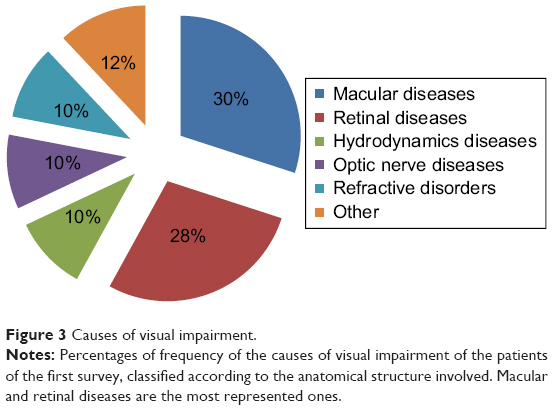 | Figure 3 Causes of visual impairment. |
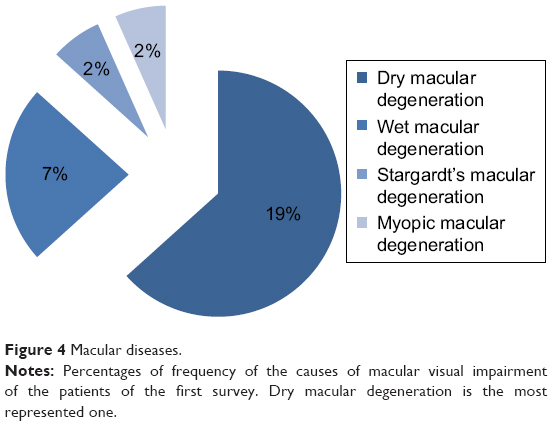 | Figure 4 Macular diseases. |
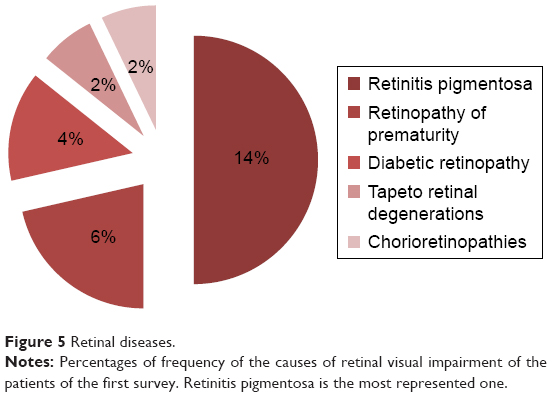 | Figure 5 Retinal diseases. |
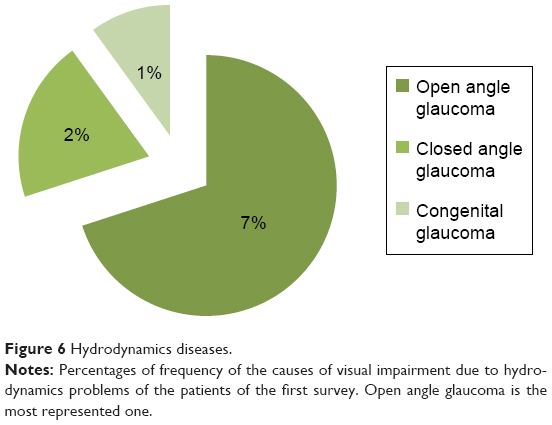 | Figure 6 Hydrodynamics diseases. |
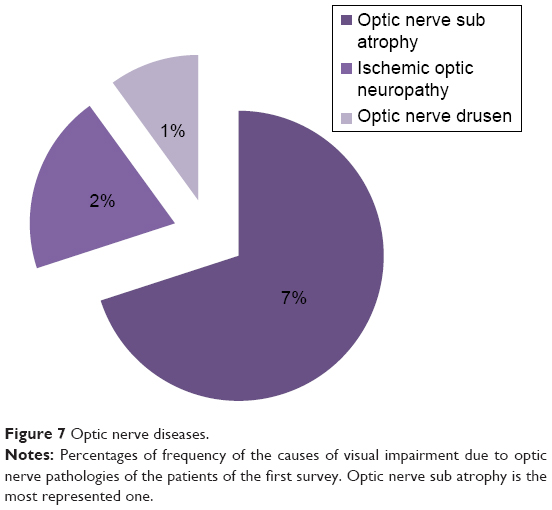 | Figure 7 Optic nerve diseases. |
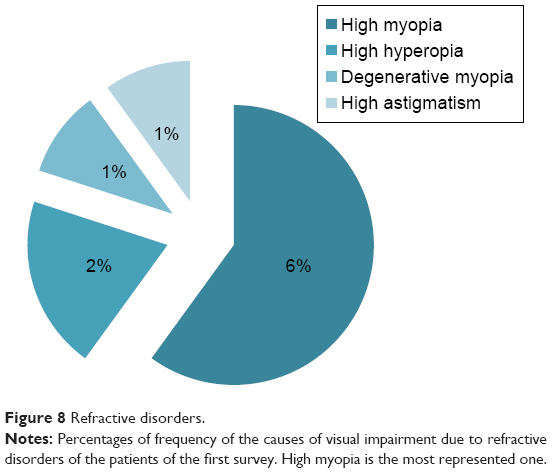 | Figure 8 Refractive disorders. |
 | Figure 9 Other pathologies. |
 | Figure 10 Degree of low vision or blindness. |
With respect to low vision, the most represented category was severe low vision (26%), and similarly for blindness, the most represented category was partial blindness (26%). Of 52 patients, 24 had a mixed typology of low vision (46% of the total low vision population), 20 had a central typology of low vision (39%), and 8 had peripheral typology of low vision (15%).
With respect to comorbid pathologies, 72% of the interviewed subjects did not have other comorbid conditions, while the remaining 28% had other diseases such as hypertension, diabetes, orthopedic conditions, pseudoxanthoma elasticum, and Bardet–Biedl syndrome.
Information about mobility
The aim of this section was to analyze the mobility of the population sample. The weekly average outdoor walking frequency was seven times per week; therefore, these people went out on a daily basis.
Thirty-nine percent of the sample population did not need to be accompanied, while 61% felt safer when accompanied. The latter set of subjects needed to be accompanied during an outdoor walk an average of four times out of ten. Sixty-three percent of the interviewed subjects did not use mobility aids, while 37% used a white cane. Sixty-five percent of the interviewees said they were able to read an information sign, 30% said they could read using Braille, and the remaining 5% were just unable to read the signs. Seventy-six percent of the interviewed participants did not use reading aids, 24% used a portable aid to read while outside, 17% used portable magnifying glasses, and the remaining 7% used telescopic systems.
We asked participants to describe how safe they felt when walking in a known vs unknown environment and rate it on a scale of 1–10. The results showed a mean score of 8.09 for a known place and of 4.75 for an unknown place. As can be seen, there is an important difference of more than three points between the two environments.
With respect to the use of public transportation, 98% of the interviewed participants said they used them at least once a week, while the remaining 2% said they used them less than once a week.
The most used mode of public transportation was the bus, used an average of three times a week, followed by the tram and subway, which were used an average of twice a week, and finally, the train, used an average of once a week.
Finally, as shown in Tables 3 and 4, we reported the monthly and annual averages of public place visits. The most frequented places were stations followed by parks and schools. Furthermore, 37.5% of the interviewed participants had a mobile device with a satellite tracker and could use mobile applications to monitor their positions. They also received information about destinations and the public bus mobility (Bus GTT, Bus Torino, Google maps, Move it, Ariadne gps, Blindsquare).
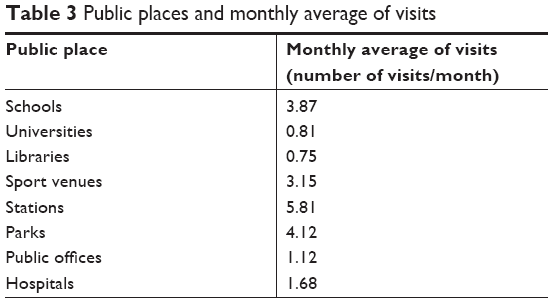 | Table 3 Public places and monthly average of visits |
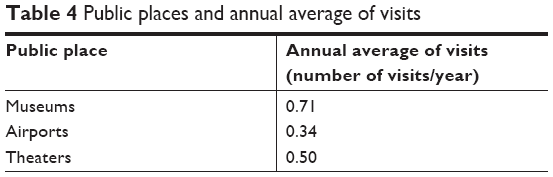 | Table 4 Public places and annual average of visits |
Opinions about environmental AIDS
The patients could express their opinion about the usefulness of each environmental aid (eg, tactile pathway, chromatic contrast, pavement-level boarding signaling, handrail, pedestrian crossing signaling, acoustic traffic light, tactile maps, and electronic information systems) and the frequency of use on a scale of 1–10. Figure 11 shows the overall average score for each aid with its relative maximum or minimum value. The handrail and the acoustic traffic light were considered the most useful aids by the majority of the study participants. Figure 12 shows the most used environmental aids, and Figure 13 shows the least used aids. Figure 14 shows the aids that the participants identified as needing the most improvement in the Turin urban area.
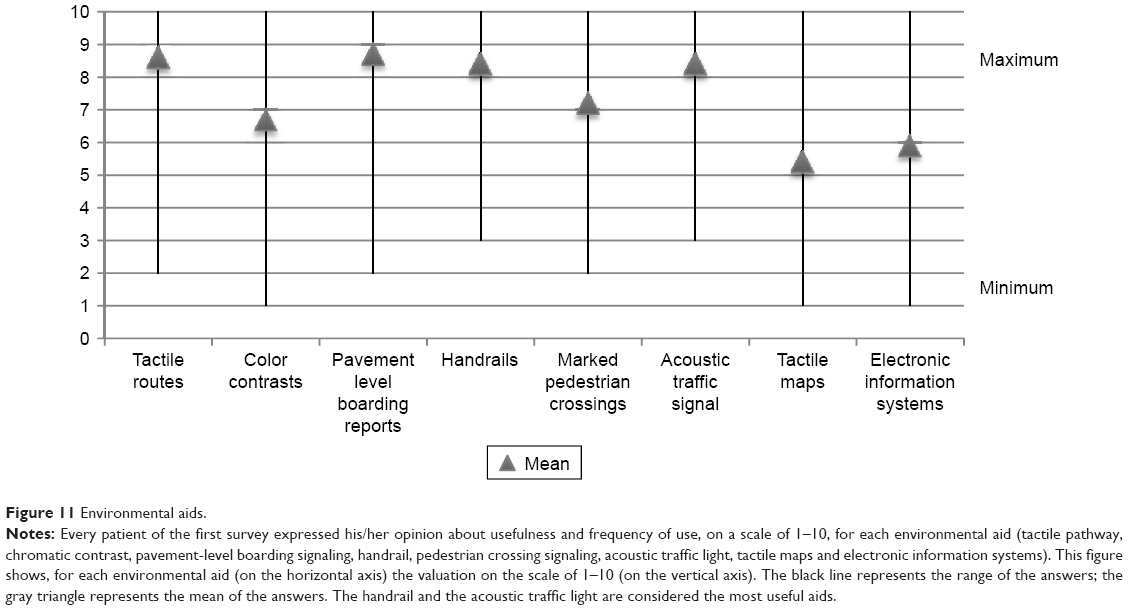 | Figure 11 Environmental aids. |
 | Figure 12 More used environmental aids. |
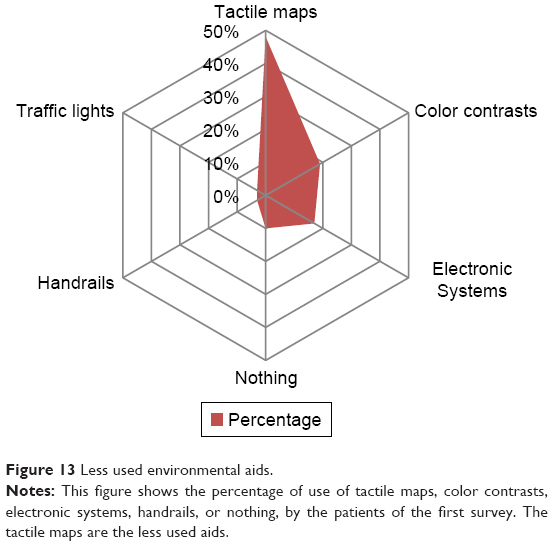 | Figure 13 Less used environmental aids. |
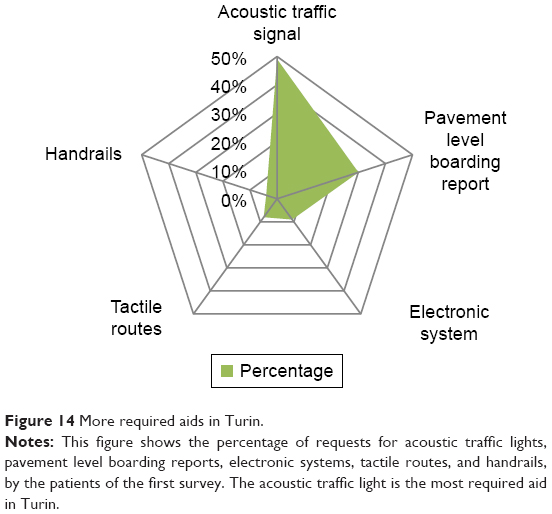 | Figure 14 More required aids in Turin. |
Opinions about signaling
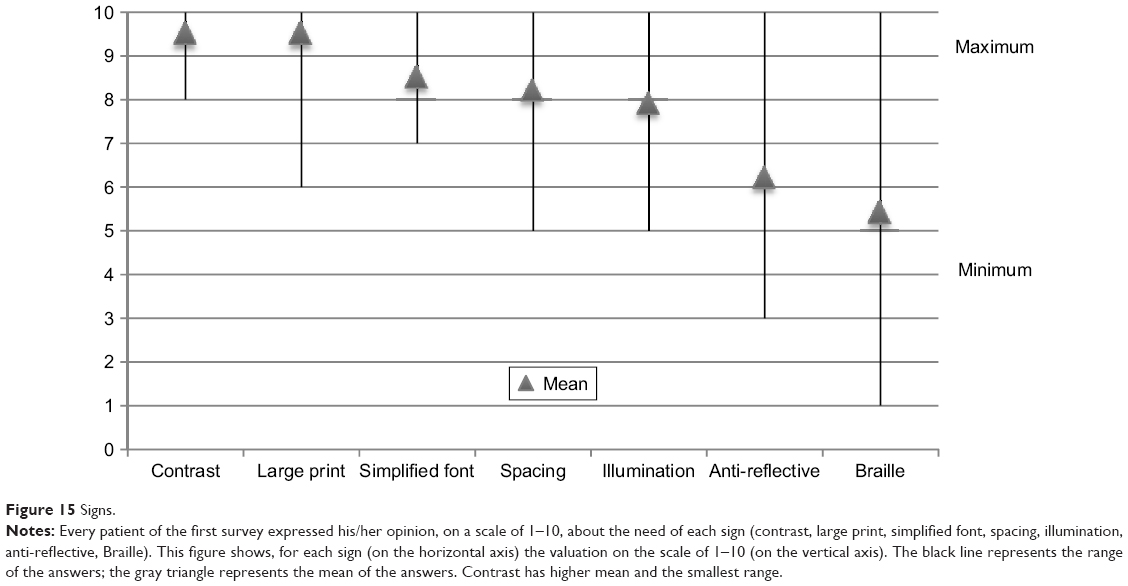
In this section, patients were interviewed about the required signaling on a scale to 1–10 (Figure 15). Figure 16 shows the most frequently used mode of signaling and Figure 17 shows less used signaling methods. Figure 18 shows participants’ most frequently required characteristics.
 | Figure 15 Signs. |
 | Figure 16 More used signs. |
 | Figure 17 Less used signs. |
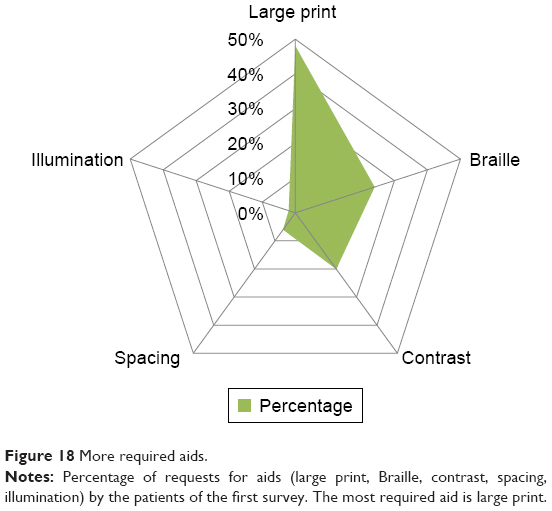 | Figure 18 More required aids. |
Opinions about Turin City and suggestions
In this last section, we asked participants to rate the city of Turin on a scale of 1–10 with respect to aids and signaling intended for visually impaired people. The average was 5.90, which was nearly sufficient (6=sufficiency).
We then asked them open questions with respect to the proposed suggestions. In brief, 27% of the interviewed subjects requested improvements in buses and bus stops (electronic vocal information boards, door signaling, bigger and brighter bus numbers); 12% requested that signaling be positioned lower than at present to enable them to get closer to read it using magnifying glasses; 12% requested acoustic traffic lights, especially in busier places, such as Corso Galileo Ferraris, Corso Regina Margherita, Corso Inghilterra and in squares, such as Piazza XVIII Dicembre; participants requested that the already existing acoustic traffic lights be made more audible given the interference from traffic noise; 11% requested better sidewalk maintenance to eliminate height differences, covering of manholes and repair of missing porphyry sections in addition to adequate signaling of the location of road works in order to avoid too high or irregular steps; and 7% requested greater sensitivity from the public, which could be addressed at informative meetings. Greater sensitivity was also requested in museums and exhibitions; they requested that the paintings be well lit and the display panels show a high contrast between the text and the background; moreover, more offices dedicated to assistance were requested. Seven percent of the interviewed participants asked for improvements with respect to tactile routes; the most frequent requests were to create standardized, non-isolated communicating paths that were also integrated into parks and gardens; 5% required a greater number of pedestrian crossings with tactile pathways and high-contrast signs placed at the beginning and end of the crossing; 4% requested improvements in street lamps, especially those on sidewalks and in underground stations; 4% requested adequate reports about tactile maps, linking them with tactile routes in addition to a greater interconnection between the various environmental aids. A request to increase the non-visual signage was also put forth. A further 3% of the interviewed participants requested less architectural barriers and the application of Plans for the Elimination of Architectural Barriers; 3% requested a voice speaker and numbered electronic signs in public offices and 2% requested the same improvements in the urban periphery.
The Turin subway was considered to be very well structured for visually impaired people; however, 1% of the patients asked for a city map to be displayed at a subway station exit.
Second survey
The results are shown in Table 5. The answer to question 10 is not included as it was an open question.
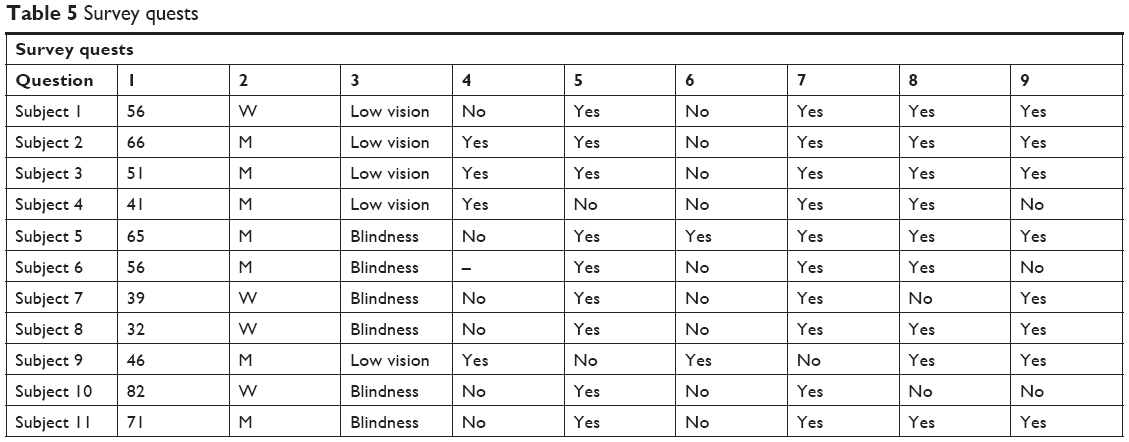 | Table 5 Survey quests |
Questions 1 and 2: demographic data (age and sex)
Forty-six percent of the interviewed participants were aged between 47 and 66 years, 36% were between the ages of 32 and 46 years, and 18% were >67 years old. Men comprised 64% of the total sample population.
Question 3: typology of visual impairment
In the questionnaire results, although showing a good distribution, there was a prevalence of blind subjects (55%), while in the low vision subject group (45%), a majority of subjects suffered from medium-to-severe or severe deficits.
Question 4: autonomy in urban environment
Subjects suffering from blindness or severe low vision (55%) stated that they could not move independently in an environment as large as the city of Turin and preferred to have a companion or take advantage of the taxi service.
On the other hand, subjects affected by low or medium low vision replied that they were able to orient themselves using the residual vision (36%) or using guide dog/white cane (9%).
Questions 5 and 6: use of personal AIDS
The majority of subjects used a white cane as an aid (82%), which was easily transportable and less demanding than a guide dog (18%) that, understandably, requires special and specific attention.
Question 7: use of the dedicated pavement
As can be deduced from the two previous answers, given the wide use of the white cane as an aid, dedicated flooring plays a fundamental role in the urban environment. Owing to this type of flooring, blind or partially sighted people can orient themselves and perceive dangers or turns because of the special texture of the tiles. Ninety-one percent of the interviewed participants claimed using dedicated pavements.
Question 8: use of the vibro-tactile traffic lights
This question was more complex than the previous ones because of the low proportion of such aids in the Turin area. This type of aid is often unknown or confused with sound. Unlike the older traffic lights, vibro-tactile traffic lights are activated by the subject only at the time of use without emission a constant sound that would be annoying for the general user.
In the redevelopment project of Via Nizza, the inclusion of these aids, already used in the parallel street of Via Sacchi, has been planned.
Seventy-three percent of the interviewed participants claimed using them, 18% claimed not using them, while 9% did not know what vibro-tactile traffic lights were.
Question 9: can you make the route from Porta Nuova station to Marconi subway station without difficulty?
Seventy-three percent of the subjects had difficulty using this route. Each subject had a different reason. Subjects 3, 8, and 10 stated that the greatest difficulty for them was the discontinuity of the dedicated paths, which, therefore, caused disorientation and insecurity; for subject 2, the main obstacle on this stretch was the lack of adequate signaling in the intersection with Via Marconi, which will, in fact, be subject to changes in the future project.
For subject 5, the path was riddled with difficulties, while for subjects 1, 7, and 11 the presence of various altimeter levels and the presence of holes or cars parked illegally on the sidewalk corresponded to insurmountable dangers and difficulties.
Question 10: what do you expect of the urban renewal project of Nizza street?
The answers for question 10 are listed in Table 6.
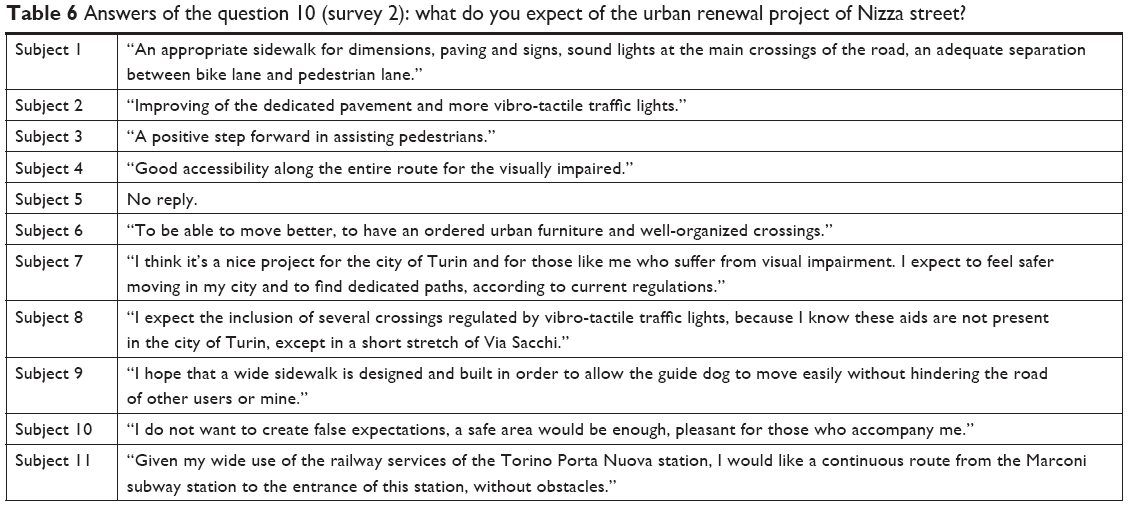 | Table 6 Answers of the question 10 (survey 2): what do you expect of the urban renewal project of Nizza street? |
Discussion
The aim of the first study was to analyze the needs and requests of visually impaired people within a real and concrete context: the city of Turin in 2014.
The questionnaire focused on patient mobility within the city, and we believe, to our best knowledge, it was, therefore, the first to deal with a specific and interdisciplinary topic such as this one. It provided information about the population under examination and confirmed low vision and blindness as a complex phenomenon, not necessarily linked to the elderly population (46% were <60 years). It described the mobility of people in the city with visual impairment as active and numerous (39% were unaccompanied, while the remaining 61% needed accompaniment on an average of four out of ten walks), effectively eliminating the stereotype of the visually impaired elderly person as one who does not leave the house unless he/she is accompanied.
Other data have shown that the environmental aids considered most useful are sound lights (30%) and pavement-level boarding (29%); the former, unfortunately, are not present in the city and were strongly requested for by the interviewees (49%). With respect to the need for signs (contrast, large print, simplified font, spacing, illumination, anti-reflective, Braille), contrast signs received the higher number of requests followed by large-print signs.
Another interesting fact is that 48% of the respondents did not use tactile maps although they are designed not only for the blind who can read Braille but also for visually impaired people, thanks to the high contrast and letters in relief.
With respect to the frequency of sign use, the most frequently used signs were large print and contrast; the less frequently used signs were those in Braille. Unfortunately, this minimal use of Braille signs demonstrates that Braille is largely unknown in this population.
At present, the visual aids and Braille-based public support facility do not seem to fit the requests of the visually impaired people exactly. In fact, tactile maps and Braille are widespread in this metropolitan area although they were not frequently used, while the more requested sound lights are uncommon.
With respect to the signage, 32% of the respondents believed it was essential that the text be large, and 48% requested for large text on city signs. The percentages for some parameters are noticeably high (almost half of the analyzed sample), indicating a real trend and not just data from a descriptive statistical survey.
Consequently, as shown in this study, state interventions could be programmed to improve public signaling, taking into consideration both visually impaired and blind people. Visually impaired people are more numerous and increasing over time, and they could benefit from larger printed public signs.
Public action should be especially implemented in the places most frequented by visually impaired people; therefore, public offices and hospitals, and surprisingly, even stations, schools, parks, and sports venues could implement these measures. The latter are not often planned considering the visually impaired people in the metropolitan area, and important improvements are needed to accommodate this population.
By comparing the first questionnaire (from 2014) with the second, carried out in the year 2017, it has been shown that clinical and population characteristics, needs, and the desires of the blind or visually impaired population of the city of Turin have not changed much over these 3 years. The second study demonstrates that there are many expectations concerning the redevelopment project of Via Nizza, which derives from a widespread feeling of need of urban furniture tailored to the visually impaired population. As documented in literature,6,7 the inclusion of aids for visually impaired people can improve their quality of life regardless of age, sex, social status, and education level.
Moreover, on psychological and inter-individual relationship levels, the visually impaired/blind population will benefit from an improvement in social function and quality of life, thanks to urban development, with a consequent advantage that will favor society in general.
The result will be an increasing need to monitor the quality of life of the visually impaired population, to value urban development projects in local administrations, and value the implementation of aids in all sectors of daily life.8–12
With respect to the improvement of independent mobility of visually impaired people, several key aspects are important and need to be acted upon:13 1) adaptation of the environment; 2) development of effective information tools; and 3) acquisition of skills by subjects with vision problems.
First, the designer must know the sensory and related cognitive processing of the final user, and he/she will have to analyze the presence of natural guides available in an urban context and highlight the critical points to be addressed; after this careful analysis of the environment, it is essential to develop effective information tools.
When designing an urban context for a person with visual disabilities, it is essential13 to avoid situations that may cause falls, especially from a height, prevent a blind person from entering dangerous areas such as contiguous vehicular and pedestrian routes and avoid collisions by coming into contact with any type of obstacle that cannot be detected in time.
Downward gradients
Under current legislation (DPR 503/1996) the downward gradients of sidewalks must not exceed 15 cm, except in proximity to docks as a means of transporting cargo. This situation can be extremely treacherous, and hazard signs must be placed near the edge of the sudden difference in height and for the whole of its length. In the docks, the signal must be placed at a distance of not >30 cm from the edge, must have a minimum width of 60 cm in order to prevent involuntary bypassing, and danger signs must be visible.
As for gradual gradients, including stairs, the legislation requires that at the base of the stairway a strip of attention code that bares the entire front of the staircase with a minimum width of 40 cm and placed 30 cm from the base of the first step be placed. The same signal must be repeated on each subsequent landing if sufficiently wide (at least 180 cm).
Pedestrian crossings
Pedestrian crossings must provide sensory signals, both for blind and visually impaired people, which can be identified by the diversification of the flooring materials, shapes, and colors. For visually impaired people, the greatest difficulties in dealing with a pedestrian crossing are the correct identification of the crossing and maintaining direction. With respect to the former, it is necessary to point out the presence of the crossing with dedicated pavements (LOGES) on the ground; for the latter, it is necessary to create fittings that are not orthogonal to the crossing axis, and if this is impossible, it is essential to create a guide inside the crosswalks.
During the crossing, however, it is essential for visually impaired people to make their presence known to motorists by the use of primary aids (white cane or guide dog).
If the crossings are >12 m, it becomes essential to provide a life-saving island of 1.5 m width, with carefully marked dedicated flooring.
For pedestrian crossings regulated by newly installed traffic lights, there is the obligation to insert acoustic alarms; the green call device must be placed about 1.20 m from the ground.
Street furniture
During the design process, it is essential to pay particular attention to all of the elements (shelves, window sills, curved railings) placed at a height between 95 and 210 cm, given the impossibility of their detection by a white cane and the chance of causing injuries. It must therefore be the responsibility of the designer to provide such elements at higher heights or to place them inside niches.
Doorways
The identification of public building doorways (schools, pharmacies, offices) can represent a serious problem for a person with a sight disability; a blind person must be able to recognize the access way with the aid of tactile and/or acoustic devices. The most obvious example is undoubtedly the use of dedicated flooring, built with different materials to accommodate visually impaired people. It is also possible to signal the entrance using other types of design features such as the placement of drinking fountains or pots near the entrance.
In public buildings, it may be useful to avoid the use of revolving doors that can confuse a blind person, who may prefer sliding doors. In addition, gates at driveways can interrupt the pedestrian path for a stretch and create disorientation; thus, in this case it is necessary to signal the presence of a potentially dangerous situation. Two typical situations can occur in which the sidewalk is or is not coplanar with the roadway.
In the first case, when the blind person cannot identify the boundary between the two places, the signs must be placed 30 cm from the beginning of the driveway, and must have a width between 60 and 90 cm based on the actual situation.
In the second case, warning signs must be placed on the pedestrian path at the beginning of the inclined plane connecting with the driveway; in this case, the width must be 60 cm.
Conclusion
With respect to the planning field in the city of Turin, as in other Italian cities, numerous readjustments have yet to be made in many public facilities to ensure greater independence and safety for the visually impaired population. If compliance with the regulations for accessibility and the correct use of environmental aids and dedicated flooring is the cornerstone of any design, some cities are becoming more proactive in facilitating the daily life of the blind through the advanced use of technology.
An example is the Autonomous Province of Trento by the company Trentino Trasporti, which already offers an advanced set of services in the so-called info-mobility sector; these services include call centers, hourly booklets, QR-code, and the newest development, the iBus Voice, which adds a touch of humanity to technology.
The application, provided for IOS and Android operating systems, is free. When the user, who is blind or visually impaired, is within 50 m of the enabled stops, the application installed on a mobile phone or tablet is activated. There are two navigation systems. One is near the stop and has a proximity sensor and the other has a GPS sensor or Bluetooth application on the phone to help someone obtain information even if he/she is not close to the stop. A voice will offer all of the necessary indications to the user to move in the city without barriers in a simple and safe manner.
Thanks to the invention of a group of Genoese students, Genoa will launch the trademarked “Horus Technology” in early 2019, a device that allows visually impaired and blind people to have a personal electronic assistant that supports them in everyday life and especially in urban movements.
“Horus” is a mini-camera made up of microphones, motion sensors, and a conducting mechanism that brings sound to the ear without headphones and can be installed on any type of eyewear. The device is very light-weight. The prototype weighs 15 g and works with a rechargeable battery that can be kept in the wearer’s pocket.
The user can set the mode he/she needs and set up the listening mode for the signaling of objects and finding pedestrian crossings, traffic lights, streets, and public buildings. In addition, a memory system will allow recognition of known people’s faces or illustrate the characteristics of strangers.
Disclosure
The authors report no conflicts of interest in this work.
References
Zingirian M, Gandolfo E. Ipovisione: nuova frontiera dell’oftalmologia [Low Vision: New Frontier of Ophthalmology]. Roma: Edizioni SOI; 2002. | ||
World Health Organization (WHO). Vision impairment and blindness. Available from: http://www.who.int/mediacentre/factsheets/fs282/en/. Accessed February 2, 2018. | ||
Martinoli C, Delpino E. Manuale di riabilitazione visiva per ciechi e ipovedenti [Manual of Visual Rehabilitation of the Low Vision and Blind Patient]. Milano: Franco Angeli Editori; 2009. Italian. | ||
Cruciani F, Moreno E, Albanese G. Cecità e ipovisione, la situazione in Italia [Blindness and low vision, the situation in Italy]. Oftalmologia Sociale. 2009:4. | ||
Ministero della Salute. INPS Data about blind people in Italy. 2013. Available from: http://www.salute.gov.it/portale/temi/p2_6.jsp?id=2389&area=prevenzioneIpovisione&menu=prevenzione [Updated May 16, 2013]. Accessed February 2, 2018. | ||
do AT, Ilango K, Ramasamy D, Kalidasan S, Balakrishnan V, Chang RT. Effectiveness of low vision services in improving patient quality of life at Aravind Eye Hospital. Indian J Ophthalmol. 2014;62(12):1125–1131. | ||
Stelmack J. Quality of life of low-vision patients and outcomes of low-vision rehabilitation. Optom Vis Sci. 2001;78(5):335–342. | ||
Rosenberg EA, Sperazza LC. The visually impaired patient. Am Fam Physician. 2008;77(10):1431–1436. | ||
Ryan B, Court H, Margrain TH. Measuring low vision service outcomes: Rasch analysis of the seven-item National Eye Institute Visual Function Questionnaire. Optom Vis Sci. 2008;85(2):112–121. | ||
Raasch TW, Leat SJ, Kleinstein RN, Bullimore MA, Cutter GR. Evaluating the value of low-vision services. J Am Optom Assoc. 1997;68(5):287–295. | ||
Stelmack J. Emergence of a rehabilitation medicine model for low vision service delivery, policy, and funding. Optometry. 2005;76(5):318–326. | ||
van Nispen RM, Knol DL, Langelaan M, de Boer MR, Terwee CB, van Rens GH. Applying multilevel item response theory to vision-related quality of life in Dutch visually impaired elderly. Optom Vis Sci. 2007;84(8):710–720. | ||
Felli P, Lauria A, Bacchetti A. [Environmental Communicability and Pavement Signs on Flooring Level]. Pisa: ETS; 2004. |
 © 2018 The Author(s). This work is published and licensed by Dove Medical Press Limited. The
full terms of this license are available at https://www.dovepress.com/terms
and incorporate the Creative Commons Attribution
- Non Commercial (unported, 3.0) License.
By accessing the work you hereby accept the Terms. Non-commercial uses of the work are permitted
without any further permission from Dove Medical Press Limited, provided the work is properly
attributed. For permission for commercial use of this work, please see paragraphs 4.2 and 5 of our Terms.
© 2018 The Author(s). This work is published and licensed by Dove Medical Press Limited. The
full terms of this license are available at https://www.dovepress.com/terms
and incorporate the Creative Commons Attribution
- Non Commercial (unported, 3.0) License.
By accessing the work you hereby accept the Terms. Non-commercial uses of the work are permitted
without any further permission from Dove Medical Press Limited, provided the work is properly
attributed. For permission for commercial use of this work, please see paragraphs 4.2 and 5 of our Terms.