Back to Journals » Clinical Ophthalmology » Volume 11
Long-term structural retinal changes in patients with optic neuritis related to multiple sclerosis
Authors Andersen MR, Roar M, Sejbaek T ![]() , Illes Z, Grauslund J
, Illes Z, Grauslund J ![]()
Received 19 May 2017
Accepted for publication 24 June 2017
Published 17 August 2017 Volume 2017:11 Pages 1519—1525
DOI https://doi.org/10.2147/OPTH.S142206
Checked for plagiarism Yes
Review by Single anonymous peer review
Peer reviewer comments 3
Editor who approved publication: Dr Scott Fraser
Maria Rene Andersen,1 Malte Roar,2,3 Tobias Sejbaek,2,3 Zsolt Illes,2,3 Jakob Grauslund1,3
1Department of Ophthalmology, Odense University Hospital, Odense, Denmark; 2Department of Neurology, Odense University Hospital, Odense, Denmark; 3Department of Clinical Research, University of Southern Denmark, Odense, Denmark
Purpose: To evaluate the long-term structural and functional outcome in patients with multiple sclerosis (MS) with and without a history of optic neuritis (ON).
Methods: This was a cross-sectional study of 82 patients diagnosed with MS between 2000 and 2006 from a tertiary hospital center in Denmark. Patients gave a self-reported history of ON, and functional (visual acuity and color vision) and structural (spectra domain optical coherence tomography) markers of vision were tested.
Results: Median age and MS duration at the time of the clinical examination were 49.9 years (range 30.7–72.6 years) and 13 years (range 9–15 years), respectively. ON was not associated with impairment of visual acuity or color vision. Twenty-three patients had a history of ON in at least one eye. Compared to non-affected patients, these had a lower inferior (109 vs 113 µm, P=0.04) and temporal retinal nerve fiber layer (RNFL) thickness (56 vs 67 µm, P=0.01). In an age- and sex-adjusted logistic regression model, lower inferior and temporal RNFL were associated with a higher risk of ON (odds ratio [OR] 1.56 [95% confidence interval {CI} 1.01–2.41] and OR 1.74 [95% CI 1.10–2.77] per 10 µm decrement in RNFL thickness, respectively). Twenty patients had a history of ON in one eye. Compared to the non-affected eye, this eye had a lower RNFL (109 vs 115 µm, P=0.04) and a higher central retinal thickness/mean RNFL ratio (2.7 vs 2.4, P=0.04).
Conclusion: Although patients with long-term MS and a previous history of ON did not have any functional loss of vision, structural neurodegeneration could be demonstrated in the affected eye.
Keywords: optic neuritis, multiple sclerosis, optical coherence tomography, retinal nerve fiber layer, central retinal thickness
Introduction
Multiple sclerosis (MS) is a chronic inflammatory demyelinating disease of the central nervous system (CNS), which results in axonal degeneration.1 Optic neuritis (ON) is an inflammatory demyelinating disease of the optic nerve and the presenting symptom in 20% of MS patients.2 About 40% of patients will develop ON during the course of MS.2 Recovery after ON is often incomplete with at least one-third of patients having persistent visual symptoms, which may lead to a reduced quality of life.3 ON is characterized by subacute, unilateral visual loss accompanied by pain in the majority of patients but without systemic symptoms.4 The presentation is mostly monophasic and unilateral, but it can also be simultaneously bilateral with recurrent relapses. In such cases, rare demyelinating inflammatory diseases of the CNS should be considered besides MS, such as neuromyelitis optica spectrum disorders (NMODS) caused by antibodies against aquaporin 4, anti-myelin oligodendrocyte glycoprotein (MOG) disease, and chronic relapsing inflammatory ON.5–7
As a part of the CNS, the retina opens a window to evaluate unmyelinated axons and status of neurodegeneration by optical coherence tomography (OCT). Thinning of the peripapillary retinal nerve fiber layer (RNFL) around the optic disc has been demonstrated after ON, and even in the absence of ON, patients with MS may have progressive RNFL loss over time.8
Previous studies have proposed the use of OCT to differentiate MS subtypes, to evaluate disease activity, or to estimate the efficacy of neuroprotective treatment.8–11 However, most OCT data in ON are based on small cohorts,12–14 patients with acute ON,15 or reflect short-term changes.8,11–13,16–18 In addition, some studies are based on low-resolution time domain (TD) OCT.8,18
Long-term data of high-resolution spectral domain (SD) OCT changes in MS are limited, and hence, the aim of this study was to evaluate enduring changes in a clinical cohort of MS patients in eyes with and without ON.
Materials and methods
Study population
This cross-sectional study prospectively enrolled 89 patients from a tertiary hospital center in Denmark (Odense University Hospital), who were diagnosed with MS according to the McDonald criteria between January 1, 2000, and December 31, 2006.19 There were no patients with glaucoma.
The study was performed in accordance with the criteria of the Declaration of Helsinki II and was approved by the local scientific ethics committee (The Regional Committees on Health Research Ethics for Southern Denmark). Written informed consent was obtained from all individual participants included in the study.
Clinical examination
Information of self-reported episodes of ON was collected along with the information of which eye had been affected.
Based on the patients’ own refraction, visual acuity was tested based on an Early Treatment Diabetic Retinopathy Study (ETDRS) standardized testing chart and given as numbers of ETDRS letters. Color vision was tested on both eyes independently by an Ishihara Color Vision test and presented as number of errors. Intraocular eye pressure was measured in each eye using an Icare TA01 tonometer (Icare Finland Oy, Helsinki, Finland).
A Topcon 3D OCT-2000 spectral domain OCT (Topcon, Tokyo, Japan) was used by a trained grader, and the central retinal thickness (CRT) and RNFL thickness were measured. For RNFL, measurements were performed around the optic disc in each quadrant (superior, inferior, temporal, and nasal).
Patients were asked and hospital databases were reviewed for history of ON. In the absence of hospital information, ON was defined as subacute visual loss lasting for more than 24 hours in the presence of absence of pain, deterioration of color vision, and treatment with corticosteroid.
Statistical analyses
Continuous data are presented as median (with range) and categorical as percent. Based on RNFL thickness in all four quadrants, we calculated RNFLmean and subsequently the CRT/RNFLmean ratio.
Intraindividual differences in continuous values between the two eyes were tested with Wilcoxon signed-rank test. In patients with a history of no or bilateral ON, mean values were calculated between right and left eye for visual acuity, Ishihara errors, intraocular pressure, CRT, RNFL, and RNFLmean. Differences between patients with and without a history of self-reported ON were tested with Kruskal–Wallis rank test by ranks. A linear regression model was used to test for the association between OCT features (independent variable) and history of ON (dependent variable) in an unadjusted and an age- and-sex-adjusted model. For regression analysis, we included parameters with P-values <0.1 (RNFLinferior, RNFLtemporal, and RNFLmean) from the univariate model in Table 1. Odds ratio (OR) (with 95% confidence interval [CI]) of a self-reported history of ON was given per 10 μm decrement in RNFL thickness. The P-values <0.05 were considered statistically significant.
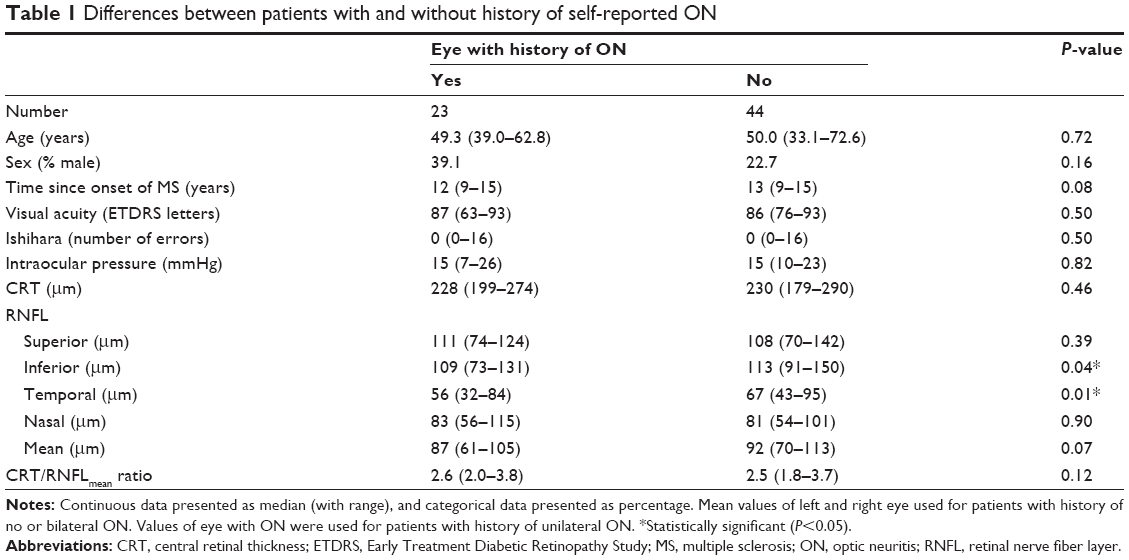 | Table 1 Differences between patients with and without history of self-reported ON |
Stata 14 (StataCorp LP, College Station, TX, USA) was used for statistical analyses.
Results
In 82 patients of 89, both eyes were examined by OCT. Of those with bilateral OCT, median age at the clinical examination and time since onset of ON were 49.9 years (range 30.7–72.6 years) and 13 years (range 9–15 years), respectively. Of the patients, 30.5% were male. Median values of right and left eye were 228 and 232 μm for CRT and 90.6 and 92.4 μm for RNFLmean. CRT/RNFLmean ratio for right and left eye was 2.6 and 2.5, respectively. Sixty-seven of the 82 patients (81.7%) were able to provide information about history and lateralization of ON.
Twenty patients had at least one episode of unilateral ON and were able to identify which eye had been affected. Median age of these patients was 47.1 years (range 39.0–62.8 years), and 40.0% were male (Table 2). There were no differences between the two eyes regarding visual acuity, Ishihara Color Vision test, intraocular pressure, and CRT or RNFL in superior, temporal, and nasal quadrant. On the other hand, patients had a lower inferior RNFL (109 vs 115 μm, P=0.04) and a higher CRT/RNFLmean ratio (2.7 vs 2.4, P=0.04) in the affected eye. In addition, there was a trend toward a lower mean RNFL in the affected eye (87 vs 93 μm, P=0.06).
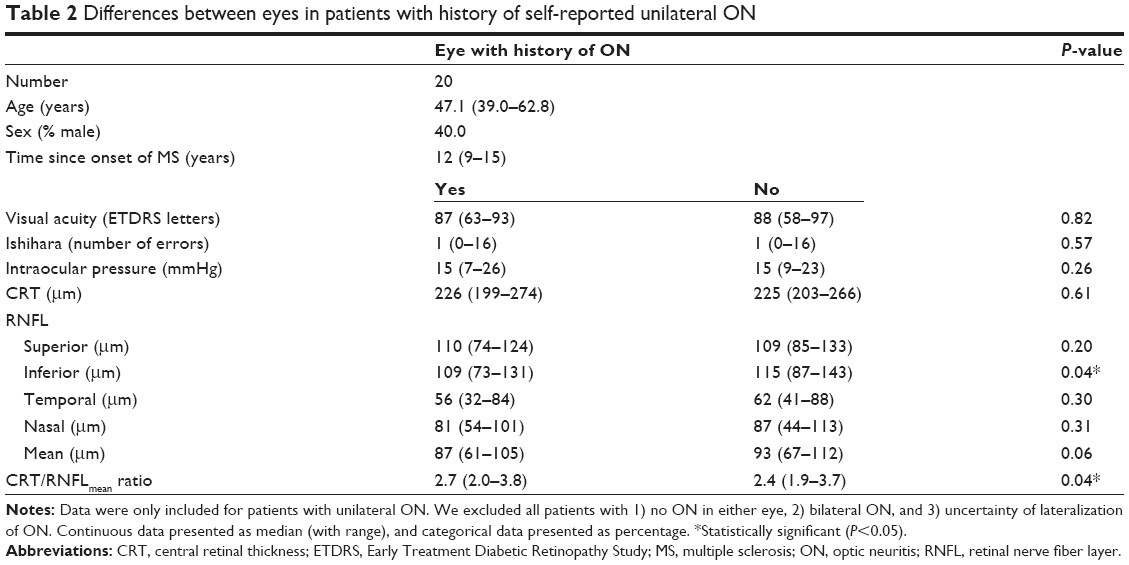 | Table 2 Differences between eyes in patients with history of self-reported unilateral ON |
Twenty-three patients had a history of ON in at least one eye (Figure 1). These patients were compared with the 44 patients without any episodes of ON. Patients with ON had a lower inferior (109 vs 113 μm, P=0.04) and temporal (56 vs 67 μm, P=0.01) RNFL in the affected eye (Table 1). There was also a trend toward a shorter time since onset of MS (12 vs 13 years, P=0.08) and a lower mean RNFL in patients with a history of ON (87 vs 92 μm, P=0.07), but patients did not differ on other parameters.
 | Figure 1 OCT with color photo and thickness maps. |
In an unadjusted logistic regression model, lower inferior, temporal, and mean RNFL thickness were all statistically significantly associated with a history of ON (OR 1.63 [95% CI 1.09–2.46], OR 1.79 [95% CI 1.39–2.80], and OR 1.79 [95% CI 1.06–3.04] per 10 μm decrement in RNFL thickness, respectively) (Table 3). In a model adjusted for age and sex, this was still statistically significant for inferior and temporal RNFL (OR 1.56 [95% CI 1.01–2.41] and 1.74 [95% CI 1.10–2.77] per 10 μm decrement in RNFL thickness, respectively).
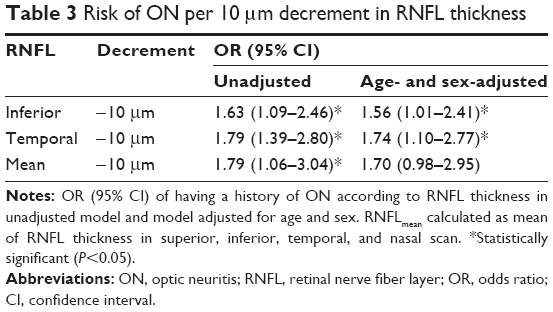 | Table 3 Risk of ON per 10 μm decrement in RNFL thickness |
Discussion
In the present study, we demonstrated long-term structural changes in MS patients with a history of ON. Even though patients with ON, in general, did not have any functional loss of vision, it still was possible to demonstrate RNFL thinning with OCT.
Other studies have confirmed that patients with ON, in general, do not have persistent functional loss of vision. Beck et al20 demonstrated a normal visual acuity in 74% of 319 patients after a history of ON 9.9–13.7 years earlier. This illustrates that the optic nerve is often functional despite the atrophic changes detected in the RNFL.
The interpretation from OCT studies in MS is challenging, since a large number of OCT devices from different generations are being used and measurements from different devices are not interchangeable.21–24 This is partly due to different normative databases and software algorithms among the machines. The Topcon software measures the macular thickness between the internal limiting membrane (ILM) and the top of the retinal pigment epithelium (RPE), whereas the Heidelberg software measures between the ILM and the bottom of the RPE. The inter device variation between different TD-OCT and SD-OCT varies from clinically insignificant 2 μm (about axial resolution of SD-OCT) to 14 μm.13 Although our one-center study had a single trained investigator performing all scans on the same SD-OCT machine, it is still difficult to compare our results with other studies.
Since Parisi et al12 demonstrated temporal and mean RNFL loss in eyes with ON caused by MS, numerous other studies using TD-OCT in MS emerged. In a meta-analysis including 27 studies with a total of 4,199 eyes, there was a mean reduction in RNFL of 14.6 μm in the eyes with ON caused by MS compared to the fellow eyes.25 Costello et al18 demonstrated that about 75% of ON eyes had a 10–40 μm loss in RNFL 3–6 months after ON and, furthermore, identified a threshold value of 75 μm below which decreased visual function was seen. Since mean RNFL in healthy controls on TD-OCT is 105 μm, a decrease to 75 μm is substantial and more than expected with normal aging (0.017% RNFL loss/year).
Studies by SD-OCT have demonstrated similar findings of reduced mean RNFL in MS-ON eyes compared to MS non-ON eyes.13,14,16 In this study, although not statistically significant, there was a trend toward mean RNFL thinning in MS-ON eyes compared with fellow eye (P=0.06) and in MS-ON compared with MS non-ON (P=0.07). Monteiro et al10 also found a trend toward mean RNFL loss in MS-ON eyes compared to MS non-ON eyes as well as sectorial loss in the temporal and superotemporal sector.
We found decreased RNFL in the inferior and temporal quadrants associated with previous ON. There was also a trend toward a higher risk of previous ON with mean RNFL loss, but this was not statistically significant when adjusted for age and sex. In consistency with our study, Khanifar et al16 found a significant elevated risk of previous ON for patients with RNFL loss in the temporal and inferior sectors as well as for those with lower mean RNFL. This might be explained by certain retinal areas (ie, the papillomacular bundle in the temporal part of the peripapillary RNFL scan) being more susceptible to the temporary distress induced by ON. This may lead to retinal neurodegeneration despite unaffected functional visual outcome.
CRT is a measurement of the overall foveal thickness, which includes the internal limiting membrane, the outer plexiform layer, the outer nuclear layer, and the retinal cones. While the foveal structure is closely related to the visual acuity, peripapillary measurements of the RNFL are a more global measurement of the retinal ganglion cell axons. In order to combine the evaluation of the retinal structure at different parts, we developed and evaluated the OCT-derived composite end point of the CRT/RNFLmean ratio. Such end points have also been tested in diseases such as glaucoma, where it has been demonstrated that regional ganglion cell layer/inner nuclear layer measures performed just as well as regional RNFL outcomes.26 For patients with a history of unilateral ON in our study, there was no difference between the eyes regarding CRT or mean RNFL. However, the CRT/RNFLmean ratio was higher in the eye that had ON. It is difficult to say if this was primarily driven by a higher CRT or a lower RNFL. In other neurodegenerative diseases such as diabetic retinopathy, there is a general association between retinal atrophy and disease activity,27 even though some studies have indicated increased retinal thickness in some patients.28 In our study, CRT/RNFLmean ratio was different between the affected and non-affected eyes, while patients with and without a history of ON did not differ. Hence, we cannot conclude at this stage if CRT/RNFLmean ratio could be a potential biomarker for retinal axonal degeneration or if it was an incidental finding.
Our study was strengthened by the use of high-resolution SD-OCT in a large, well-defined cohort of patients with long-term MS. On the other hand, the diagnosis of ON was self-reported, and even if we excluded a few patients, who were not able to give a positive history, the study was still limited by the retrospective design and potential recall bias. In addition, we did not have available visual evoked potentials (VEPs). However, VEPs may not be able to detect changes after ON, ie, normal VEP does not exclude the possibility of a previous ON.29
Conclusion
In a long-term follow-up study, we demonstrated structural, but not functional, visual changes in patients with ON during the course of MS. RNFL thinning in the inferior or temporal sector were independently associated with ON. Upcoming studies should address these sectorial differences and evaluate the use of composite structural end points.
Acknowledgment
This study was funded by the Danish Multiple Sclerosis Society.
Disclosure
The authors report no conflicts of interest in this work.
References
Compston A, Coles A. Multiple sclerosis. Lancet. 2008;372(9648):1502–1517. | ||
Sergott RC, Frohman E, Glanzman R, AL-Sabbagh A, Panel OME. The role of optical coherence tomography in multiple sclerosis: expert panel consensus. J Neurol Sci. 2007;263(1–2):3–14. | ||
Balcer LJ, Miller DH, Reingold SC, Cohen JA. Vision and vision-related outcome measures in multiple sclerosis. Brain. 2015;138(pt 1):11–27. | ||
Kale N. Optic neuritis as an early sign of multiple sclerosis. Eye Brain. 2016;8:195–202. | ||
Peschl P, Bradl M, Hoftberger R, Berger T, Reindl M. Myelin oligodendrocyte glycoprotein: deciphering a target in inflammatory demyelinating diseases. Front Immunol. 2017;8:529. | ||
Weinshenker BG, Wingerchuk DM. Neuromyelitis spectrum disorders. Mayo Clin Proc. 2017;92(4):663–679. | ||
Petzold A, Plant GT. Chronic relapsing inflammatory optic neuropathy: a systematic review of 122 cases reported. J Neurol. 2014;261(1):17–26. | ||
Talman LS, Bisker ER, Sackel DJ, et al. Longitudinal study of vision and retinal nerve fiber layer thickness in multiple sclerosis. Ann Neurol. 2010;67(6):749–760. | ||
Bennett JL, de Seze J, Lana-Peixoto M, et al. Neuromyelitis optica and multiple sclerosis: seeing differences through optical coherence tomography. Mult Scler. 2015;21(6):678–688. | ||
Monteiro MLR, Fernandes DB, Apostolos-Pereira SL, Callegaro D. Quantification of retinal neural loss in patients with neuromyelitis optica and multiple sclerosis with or without optic neuritis using fourier-domain optical coherence tomography. Invest Ophthalmol Vis Sci. 2012;53(7):3959–3966. | ||
Park KA, Kim J, Oh SY. Analysis of spectral domain optical coherence tomography measurements in optic neuritis: differences in neuromyelitis optica, multiple sclerosis, isolated optic neuritis and normal healthy controls. Acta Ophthalmol. 2014;92(1):E57–E65. | ||
Parisi V, Manni G, Spadaro M, et al. Correlation between morphological and functional retinal impairment in multiple sclerosis patients. Invest Ophthalmol Vis Sci. 1999;40(11):2520–2527. | ||
Lange AP, Sadjadi R, Saeedi J, Lindley J, Costello F, Traboulsee AL. Time-domain and spectral-domain optical coherence tomography of retinal nerve fiber layer in MS patients and healthy controls. J Ophthalmol. 2012;2012:564627. | ||
Feng LG, Shen J, Jin XH, Li JK, Li YM. The evaluation of the retinal nerve fiber layer in multiple sclerosis with special-domain optical coherence tomography. Ophthalmologica. 2013;230(3):116–120. | ||
Huang-Link YM, Al-Hawasi A, Lindehammar H. Acute optic neuritis: retinal ganglion cell loss precedes retinal nerve fiber thinning. Neurol Sci. 2015;36(4):617–620. | ||
Khanifar AA, Parlitsis GJ, Ehrlich JR, et al. Retinal nerve fiber layer evaluation in multiple sclerosis with spectral domain optical coherence tomography. Clin Ophthalmol. 2010;4:1007–1013. | ||
Burkholder BM, Osborne B, Loguidice MJ, et al. Macular volume determined by optical coherence tomography as a measure of neuronal loss in multiple sclerosis. Arch Neurol. 2009;66(11):1366–1372. | ||
Costello F, Coupland S, Hodge W, et al. Quantifying axonal loss after optic neuritis with optical coherence tomography. Ann Neurol. 2006;59(6):963–969. | ||
McDonald WI, Compston A, Edan G, et al. Recommended diagnostic criteria for multiple sclerosis: guidelines from the international panel on the diagnosis of multiple sclerosis. Ann Neurol. 2001;50(1):121–127. | ||
Beck RW, Gal RL, Bhatti MT, et al. Visual function more than 10 years after optic neuritis: experience of the optic neuritis treatment trial. Am J Ophthalmol. 2004;137(1):77–83. | ||
Wolf-Schnurrbusch UEK, Ceklic L, Brinkmann CK, et al. Macular thickness measurements in healthy eyes using six different optical coherence tomography instruments. Invest Ophthalmol Vis Sci. 2009;50(7):3432–3437. | ||
Bentaleb-Machkour Z, Jouffroy E, Rabilloud M, Grange JD, Kodjikian L. Comparison of central macular thickness measured by three OCT models and study of interoperator variability. ScientificWorldJournal. 2012;2012:842795. | ||
Warner CV, Syc SB, Stankiewicz AM, et al. The impact of utilizing different optical coherence tomography devices for clinical purposes and in multiple sclerosis trials. PLoS One. 2011;6(8):e22947. | ||
Bock M, Brandt AU, Dorr J, et al. Time domain and spectral domain optical coherence tomography in multiple sclerosis: a comparative cross-sectional study. Mult Scler. 2010;16(7):893–896. | ||
Petzold A, de Boer JF, Schippling S, et al. Optical coherence tomography in multiple sclerosis: a systematic review and meta-analysis. Lancet Neurol. 2010;9(9):921–932. | ||
Nouri-Mahdavi K, Nowroozizadeh S, Nassiri N, et al. Macular ganglion cell/inner plexiform layer measurements by spectral domain optical coherence tomography for detection of early glaucoma and comparison to retinal nerve fiber layer measurements. Am J Ophthalmol. 2013;156(6):1297–1307. | ||
Jonsson KB, Frydkjaer-Olsen U, Grauslund J. Vascular changes and neurodegeneration in the early stages of diabetic retinopathy: which comes first? Ophthalmic Res. 2016;56(1):1–9. | ||
Araszkiewicz A, Zozulinska-Ziolkiewicz D, Meller M, et al. Neurodegeneration of the retina in type 1 diabetic patients. Pol Arch Med Wewn. 2012;122(10):464–470. | ||
Sisto D, Trojano M, Vetrugno M, Trabucco T, Iliceto G, Sborgia C. Subclinical visual involvement in multiple sclerosis: a study by MRI, VEPs, frequency-doubling perimetry, standard perimetry, and contrast sensitivity. Invest Ophth Vis Sci. 2005;46(4):1264–1268. |
 © 2017 The Author(s). This work is published and licensed by Dove Medical Press Limited. The
full terms of this license are available at https://www.dovepress.com/terms
and incorporate the Creative Commons Attribution
- Non Commercial (unported, 3.0) License.
By accessing the work you hereby accept the Terms. Non-commercial uses of the work are permitted
without any further permission from Dove Medical Press Limited, provided the work is properly
attributed. For permission for commercial use of this work, please see paragraphs 4.2 and 5 of our Terms.
© 2017 The Author(s). This work is published and licensed by Dove Medical Press Limited. The
full terms of this license are available at https://www.dovepress.com/terms
and incorporate the Creative Commons Attribution
- Non Commercial (unported, 3.0) License.
By accessing the work you hereby accept the Terms. Non-commercial uses of the work are permitted
without any further permission from Dove Medical Press Limited, provided the work is properly
attributed. For permission for commercial use of this work, please see paragraphs 4.2 and 5 of our Terms.