Back to Journals » Clinical Ophthalmology » Volume 20
Light Discomfort Thresholds in Patients with Moderate-to-Severe Active versus Mild Non-Active Thyroid Eye Disease
Authors Lixi F ![]() , Corrias S, Coco G, Lai R, Corda C, Cuccu A
, Corrias S, Coco G, Lai R, Corda C, Cuccu A ![]() , Vitiello L
, Vitiello L ![]() , Troisi M, Mura C, Boi F
, Troisi M, Mura C, Boi F ![]() , Lanzolla G, Giannaccare G
, Lanzolla G, Giannaccare G ![]()
Received 4 November 2025
Accepted for publication 5 February 2026
Published 13 February 2026 Volume 2026:20 578968
DOI https://doi.org/10.2147/OPTH.S578968
Checked for plagiarism Yes
Review by Single anonymous peer review
Peer reviewer comments 2
Editor who approved publication: Dr Scott Fraser
Filippo Lixi,1,2 Silvia Corrias,3 Giulia Coco,4 Roberta Lai,1 Claudia Corda,1 Alberto Cuccu,1 Livio Vitiello,5 Mario Troisi,6 Chiara Mura,3 Francesco Boi,3 Giulia Lanzolla,3,* Giuseppe Giannaccare1,*
1Eye Clinic, Department of Surgical Sciences, University of Cagliari, Cagliari, Italy; 2Department of Medical Sciences and Public Health, University of Cagliari, Monserrato, Italy; 3Endocrinology Unit, Department of Medical Sciences, University of Cagliari, Monserrato, Italy; 4Ophthalmology Unit, Department of Clinical Sciences and Translational Medicine, University of Rome Tor Vergata, Rome, Italy; 5Eye Unit, Luigi Curto Hospital, Azienda Sanitaria Locale Salerno, Polla, Italy; 6Eye Clinic, Department of Neurosciences, Reproductive and Odontostomatological Sciences, Federico II University, Naples, Italy
*These authors contributed equally to this work
Correspondence: Livio Vitiello, Eye Unit, Luigi Curto Hospital, Azienda Sanitaria Locale Salerno, Polla, Italy, Tel +39 3491638307, Email [email protected]
Purpose: To quantitatively assess light sensitivity thresholds and ocular surface parameters in patients with thyroid eye disease (TED) compared to sex- and age-matched patients with dry eye disease (DED) and healthy controls, and to further investigate differences between moderate-to-severe active and mild non-active TED.
Patients and Methods: This cross-sectional, controlled study included patients with TED, patients with DED, and healthy controls. Light sensitivity was evaluated using the Lumiz 100 device (Essilor International, Paris, France) under three lighting conditions: continuous warm, continuous cold and flashing warm. TED patients were further stratified into moderate-to-severe active and mild non-active subgroups. In addition, ocular surface parameters were assessed using the Keratograph 5M (Oculus, Wetzlar, Germany). Correlations between light sensitivity thresholds and clinical parameters were analyzed.
Results: Out of 93 included patients, 39 had TED (14 moderate-to-severe active, 25 mild non-active), 25 had DED, and 29 were healthy controls. TED patients demonstrated significantly lower total light sensitivity thresholds compared to healthy controls (3.17 ± 0.52 vs 3.47 ± 0.42 log10[lux], p = 0.040) but higher thresholds compared to DED patients (2.71 ± 0.52 log10[lux], p = 0.003). Among TED patients, those with moderate-to-severe active disease exhibited significantly lower light sensitivity thresholds than those with mild non-active disease (2.85 ± 0.48 vs 3.35 ± 0.47 log10[lux], p = 0.004). A significant negative correlation was found between total light sensitivity threshold and ocular discomfort symptoms in both subgroups of TED patients (r =− 0.623, p = 0.017 for moderate-to-severe active TED and r = − 0.405, p = 0.045 for mild non-active TED, respectively). Conversely, no significant correlation was found between light thresholds and tear film or thyroid function parameters.
Conclusion: Light sensitivity represents a significant and quantifiable manifestation of TED, particularly in patients with active disease. Quantitative assessment of light sensitivity might be incorporated into clinical evaluation of TED patients to better characterize disease burden and guide management strategies.
Keywords: light sensitivity, photophobia, light discomfort thresholds, thyroid eye disease, Graves’s orbitopathy, dry eye disease
Introduction
Thyroid eye disease (TED) is an autoimmune disorder involving the orbit. TED is observed more frequently in patients with Graves’ disease (GD), although it can also be found in patients with chronic autoimmune thyroiditis and, rarely, in euthyroid patients (the so-called “euthyroid TED”). The pathogenesis of TED involves complex interactions between cellular and humoral immune responses directed against the thyrotropin (TSH) receptor (TSH-R) and potentially other shared autoantigens expressed by thyroid epithelial cells and orbital fibroblasts, such as insulin-like growth factor-1 receptor (IGF-1R). Clinically, TED is characterized by hypertrophy of the extraocular muscles, expansion of orbital adipose tissue, and varying degrees of proptosis, eyelid retraction, and periocular soft-tissue inflammation.1–3
Beyond its structural and functional impact on the orbit, TED frequently affects the ocular surface, leading to symptoms such as dryness, irritation, foreign body sensation and photophobia.4–6 Precisely, light sensitivity, or photophobia, is among the most disabling manifestations of ocular surface disease and can substantially impair visual comfort and quality of life in TED patients.6 Despite the high prevalence of light sensitivity in TED,6 there is a paucity of literature regarding its quantitative assessments through standardized and reliable measurements. Traditional assessment of light sensitivity relies on scales and self-reported symptoms, including photophobia-related questions embedded in validated dry eye disease (DED) symptom questionnaires [eg Question 1 (Q1) of the Ocular Surface Disease Index (OSDI)].7,8 However, these tools are inherently limited by recall bias, inter-individual variability in symptom perception, and the inability to precisely quantify light discomfort in standardized units, thereby hindering accurate comparisons across patients and disease states. Recently, semi-automated systems have been validated to quantify visual photosensitivity discomfort thresholds.9,10 Among these, the Lumiz 100 (Lumiz 100, Essilor International, Paris, France) has showed to provide rapid, accurate and safe evaluation of light discomfort thresholds through an easy-to-use handheld device.10 Specifically, various studies have confirmed its utility for evaluating light sensitivity thresholds in healthy subjects and in patients with DED or age-related cataract.10–14
Given the overlap between the ocular surface alterations present in TED and DED, the latter being a condition strongly associated with photophobia,15,16 it remains unclear to what extent photosensitivity in TED reflects exposure-related ocular surface changes or other disease-specific mechanisms.
Therefore, this study aims at assessing light sensitivity thresholds and other ocular surface parameters in patients with TED, in comparison with age- and sex-matched patients affected by DED and healthy controls. Furthermore, it seeks to investigate differences in ocular parameters and light sensitivity between patients with moderate-to-severe active TED and those with mild non-active disease, as well as to explore potential correlations among these variables.
Material and Methods
Ethical Statement
Ethical approval for the study was obtained from the Ethics Committee “Comitato Etico Territoriale Lazio Area 2” (protocol number 316.24, approval date 13-02-2025). Informed consent was obtained from all participants, and the study was conducted in accordance with the tenets of the Declaration of Helsinki.
Study Design and Participants
In this cross-sectional, controlled study, patients were consecutively recruited at two University centers between February and September 2025. Inclusion criteria were: 1) diagnosis of GD, based on the presence of hyperthyroidism and detectable antibodies against TSH receptor (TRAb); 2) diagnosis of TED, according to the European Group on Graves’ Orbitopathy (EUGOGO) guidelines;17 3) diagnosis of DED obtained using the following Tear Film & Ocular Surface Society (TFOS) Dry Eye Workshop (DEWS) II criteria: positive symptom score (OSDI score ≥ 13) and non-invasive break-up time (NIBUT) < 10 seconds (s).18 Exclusion criteria were: 1) age < 18 years; 2) recent ocular surgery or treatment with immunosuppressive medication (eg glucocorticoids) (within 3 months); 3) migraine, epilepsy and use of medications with a known link with light sensitivity (eg non-steroidal anti-inflammatory drugs, anticonvulsants, anti-rheumatic drugs, chemotherapy, antibiotics, antiarrhythmic, atropine, antipsychotics, anti-ulcer drugs). Age- and sex-matched healthy subjects attending the general office for routine eye checkups were enrolled. Further analyses were performed to assess differences between patients with moderate-to-severe active TED and those with mild non-active TED; in addition, the correlation between light discomfort thresholds and ocular parameters of TED patients was also investigated.
Data Acquisition
After the eligibility screening, participants fulfilling study criteria were analyzed for the collection of the following data: age; sex; logMAR best-corrected visual acuity (BCVA); ocular surface symptoms measured using the OSDI questionnaire; light-related symptoms assessed by OSDI Question 1 (OSDI Q1; range 0–4) and by the Lumiz 100 device (Essilor International, Paris, France); ocular surface parameters assessed by Keratograph 5M (Oculus, Wetzlar, Germany). For variables assessed in both eyes, the average of the bilateral measurements was calculated and used for statistical analysis.
The OSDI is a 12-item questionnaire designed to evaluate DED and its impact on quality of life. It comprises three subscales assessing ocular symptoms, vision-related functions and environmental triggers. Participants rate the frequency of their symptoms on a 5-point Likert scale ranging from 0 (“none of the time”) to 4 (“all of the time”). Each response is assigned a score from 0 to 4, and the overall OSDI score is calculated as the sum of all responses, scaled to a total score ranging from 0 to 100. A score of 13 or higher indicates the presence of DED, with disease severity categorized as mild (13–22), moderate (23–32), or severe (>32). OSDI Q1 specifically assesses photosensitivity by asking participants how often their eyes are sensitive to light, thereby providing a subjective measure of photophobia from 0 to 4. In addition, light discomfort thresholds were evaluated using the Lumiz 100, a portable device that provides uniform diffuse illumination across the participant’s visual field. Given the logarithmic relationship between photosensitivity and light intensity, lux values were log-transformed, and all statistical analyses were performed using log10 (lux) thresholds. The device, controlled via a tablet application, delivers light intensities ranging from 10 lux (log10[lux] = 1) to 10,211 lux (log10[lux] = 4.01) at eye level. When the discomfort threshold was not reached at 10,211 lux, the next intensity level (12,253 lux) was arbitrarily assigned. Thresholds were determined for two levels of discomfort under three lighting conditions designed to simulate everyday visual environments: two with continuous light increases and one with discontinuous increases. For continuous lighting, illumination began at 25 lux for 5 seconds and subsequently increased every second by 20%, using either warm light (4000 K, mimicking natural light) or cold light (6500 K, mimicking artificial light). For discontinuous lighting, illumination started at 10 lux for 5 seconds, followed by an increase to 25 lux for 0.5 seconds, then a return to 10 lux for 2 seconds, with each subsequent flash increased by 44% from the previous one using warm light (4000 K). This flashing pattern prevents visual adaptation and was designed to reproduce the most discomforting real-world light situations. Participants were instructed to press a button twice to indicate two levels of discomfort: the “just perceptible” threshold, corresponding to the initial awareness of mild discomfort (eg eyelid tension or tingling), and the “really disturbing” threshold, when discomfort became intense enough to require effort to keep the eyes open. The mean of these two values represented the average threshold for each lighting condition. The overall light sensitivity threshold was calculated as the mean of the six logarithmic illumination thresholds. Details regarding the protocol and measurement reliability have been described in previous studies.10,11
Participants underwent a non-invasive ocular surface assessment using the Keratograph 5M. All measurements were performed between 9:00 a.m. and 12:00 p.m. in a dimly lit room with controlled environmental conditions (temperature: 21–24°C; relative humidity: 30–60%). The following parameters were evaluated: NIBUT-first, NIBUT-average, tear meniscus height (TMH), meibomian gland loss (MGL), bulbar redness. NIBUT was defined as the time interval in seconds between the last complete blink and the first appearance of discontinuity in the Placido ring reflection on the corneal surface, as automatically detected by the instrument. The instrument generated two measures: the time until the tear film’s initial disruption (NIBUT-first) and the average duration of all instances of rupture (NIBUT-average). Values <10 s are considered pathological by the instrument for both parameters. The NIBUT, considered as the average of the values of both eyes of NIBUT-first and NIBUT-average, was calculated for the statistical analysis.19 Photographs of the lower TMH were acquired and evaluated for each participant. The measurements were obtained by placing a ruler perpendicular to the edge of the lid at the central position with respect to the center of the pupil. The cut-off provided by the instrument (0.20 mm) was used to distinguish between normal (≥) or pathological values (<).19,20 Infrared meibography of both upper and lower eyelids was performed to quantify MGL and the mean of these values was used for each patient. The measurement process included utilizing a grading system known as meiboscore, which classifies deficiencies on a scale ranging from 0 to 3. Grade 0 means no gland loss, grade 1 indicates up to 33% gland loss, grade 2 represents 33% to 66% gland loss, and grade 3 suggests 67% or more gland loss.20 Assessments of bulbar redness were automatically acquired, and the R-Scan module automatically categorizes redness levels in the bulbar and limbal areas, identifies blood vessels in the conjunctiva, and scores redness levels using a grading system.20
For patients affected by TED, a further evaluation was performed for examining the following data: 1) blood test values [free thyroxine (FT4) (Vitros Immunodiagnostics, Raritan, NJ); free triiodothyronine (FT3) (Vitros Immunodiagnostics, Raritan, NJ); TSH (Immulite 2000, Siemens Healthcare, Gwynedd, UK); TRAbs (Brahms, Berlin, Germany)]; 2) Hertel’s exophthalmometry (Handaya, Tokyo, Japan); 3) eyelid aperture; 4) Clinical Activity Score (CAS), calculated by assigning one point each for the presence of spontaneous retrobulbar pain, pain on eye movements, redness of the eyelids, swelling of the eyelids, redness of the conjunctiva, chemosis, and inflammation of the caruncle or plica, yielding a total score ranging from 0 to 7; a CAS ≥3/7 defined active disease;21 5) TED severity, classified according to EUGOGO criteria as mild, moderate-to-severe, or sight-threatening based on functional impact;17 6) TED duration and previous treatment; 7) assessment of diplopia evaluated using a Gorman score (patients were divided into four categories: absent, intermittent, inconstant and constant)22 8) ocular ductions evaluated using the light reflex technique and the VISA classification system was used to grade motility restrictions (0 for duction >45°, 1 for 30–45°, 2 for 15–30°, and 3 for ≤15°);23 9) smoking habit.
Statistical Analysis
Statistical analysis was conducted using SPSS for Macintosh software (version 30.0.0.0, SPSS, Inc). Means ± standard deviations (SDs) or median (interquartile range IQR) were calculated for numerical continuous variables, while percent distributions were presented for categorical data. The normality of data distribution for each continuous variables was evaluated using the Shapiro–Wilk test. Parametric (Student’s t-test and One-way ANOVA) and non-parametric (Mann–Whitney U-test and Kruskal–Wallis test) tests were used to compare normally and non-normally distributed variables among groups, respectively. Chi-squared test was employed to compare categorical variables. The relationship between total light sensitivity and other numerical data was evaluated using Pearson or Spearman correlation test. Receiver operating characteristic (ROC) curve analysis was performed to evaluate the discriminative ability of total light sensitivity threshold to distinguish between patients with mild non-active TED and those with moderate-to-severe active TED. Univariate logistic regression analysis was used to assess the association between total light sensitivity threshold and each individual component of the CAS. A post hoc power analysis was conducted by using G*Power software (version 3.1.9.6) to assess the statistical power of the study. Based on the Kruskal–Wallis test results in the primary outcome (total light sensitivity threshold 3.38 ± 0.51 log10[lux], 2.71 ± 0.52 log10[lux], 3.17 ± 0.52 log10[lux]), respectively, among healthy, DED and TED patients, the corresponding effect size (η2 = 0.26) indicated a large effect. The equivalent parametric effect size (Cohen’s f = 0.58) yielded an estimated power of 0.99 (99%) at α = 0.05, confirming that the sample size was sufficient to detect a true difference among groups. A p-value of less than 0.05 was considered statistically significant.
Results
Demographic Data
Overall, 186 eyes of 93 Caucasians patients (33 men, 60 women; mean age 56.16 ± 15.36 years) were included in the study analysis. Of these, 39 patients were GD patients with TED (group 1), 25 patients were affected by DED (group 2) and 29 were matched healthy subjects (group 3). There were no statistically significant differences among groups in terms of age (56.62 ± 13.41 vs 56.44 ± 17.69 vs 55.31 ± 16.19 years, p = 0.938, One-way ANOVA) and gender [10 males (25,6%) and 29 females (74,4%) vs 8 males (32,0%) and 17 females (68,0%) vs 15 males (51,7%) and 14 females (48,3%), p = 0.07, Chi-squared test]. Mean values for each ocular parameter investigated are shown in Table 1.
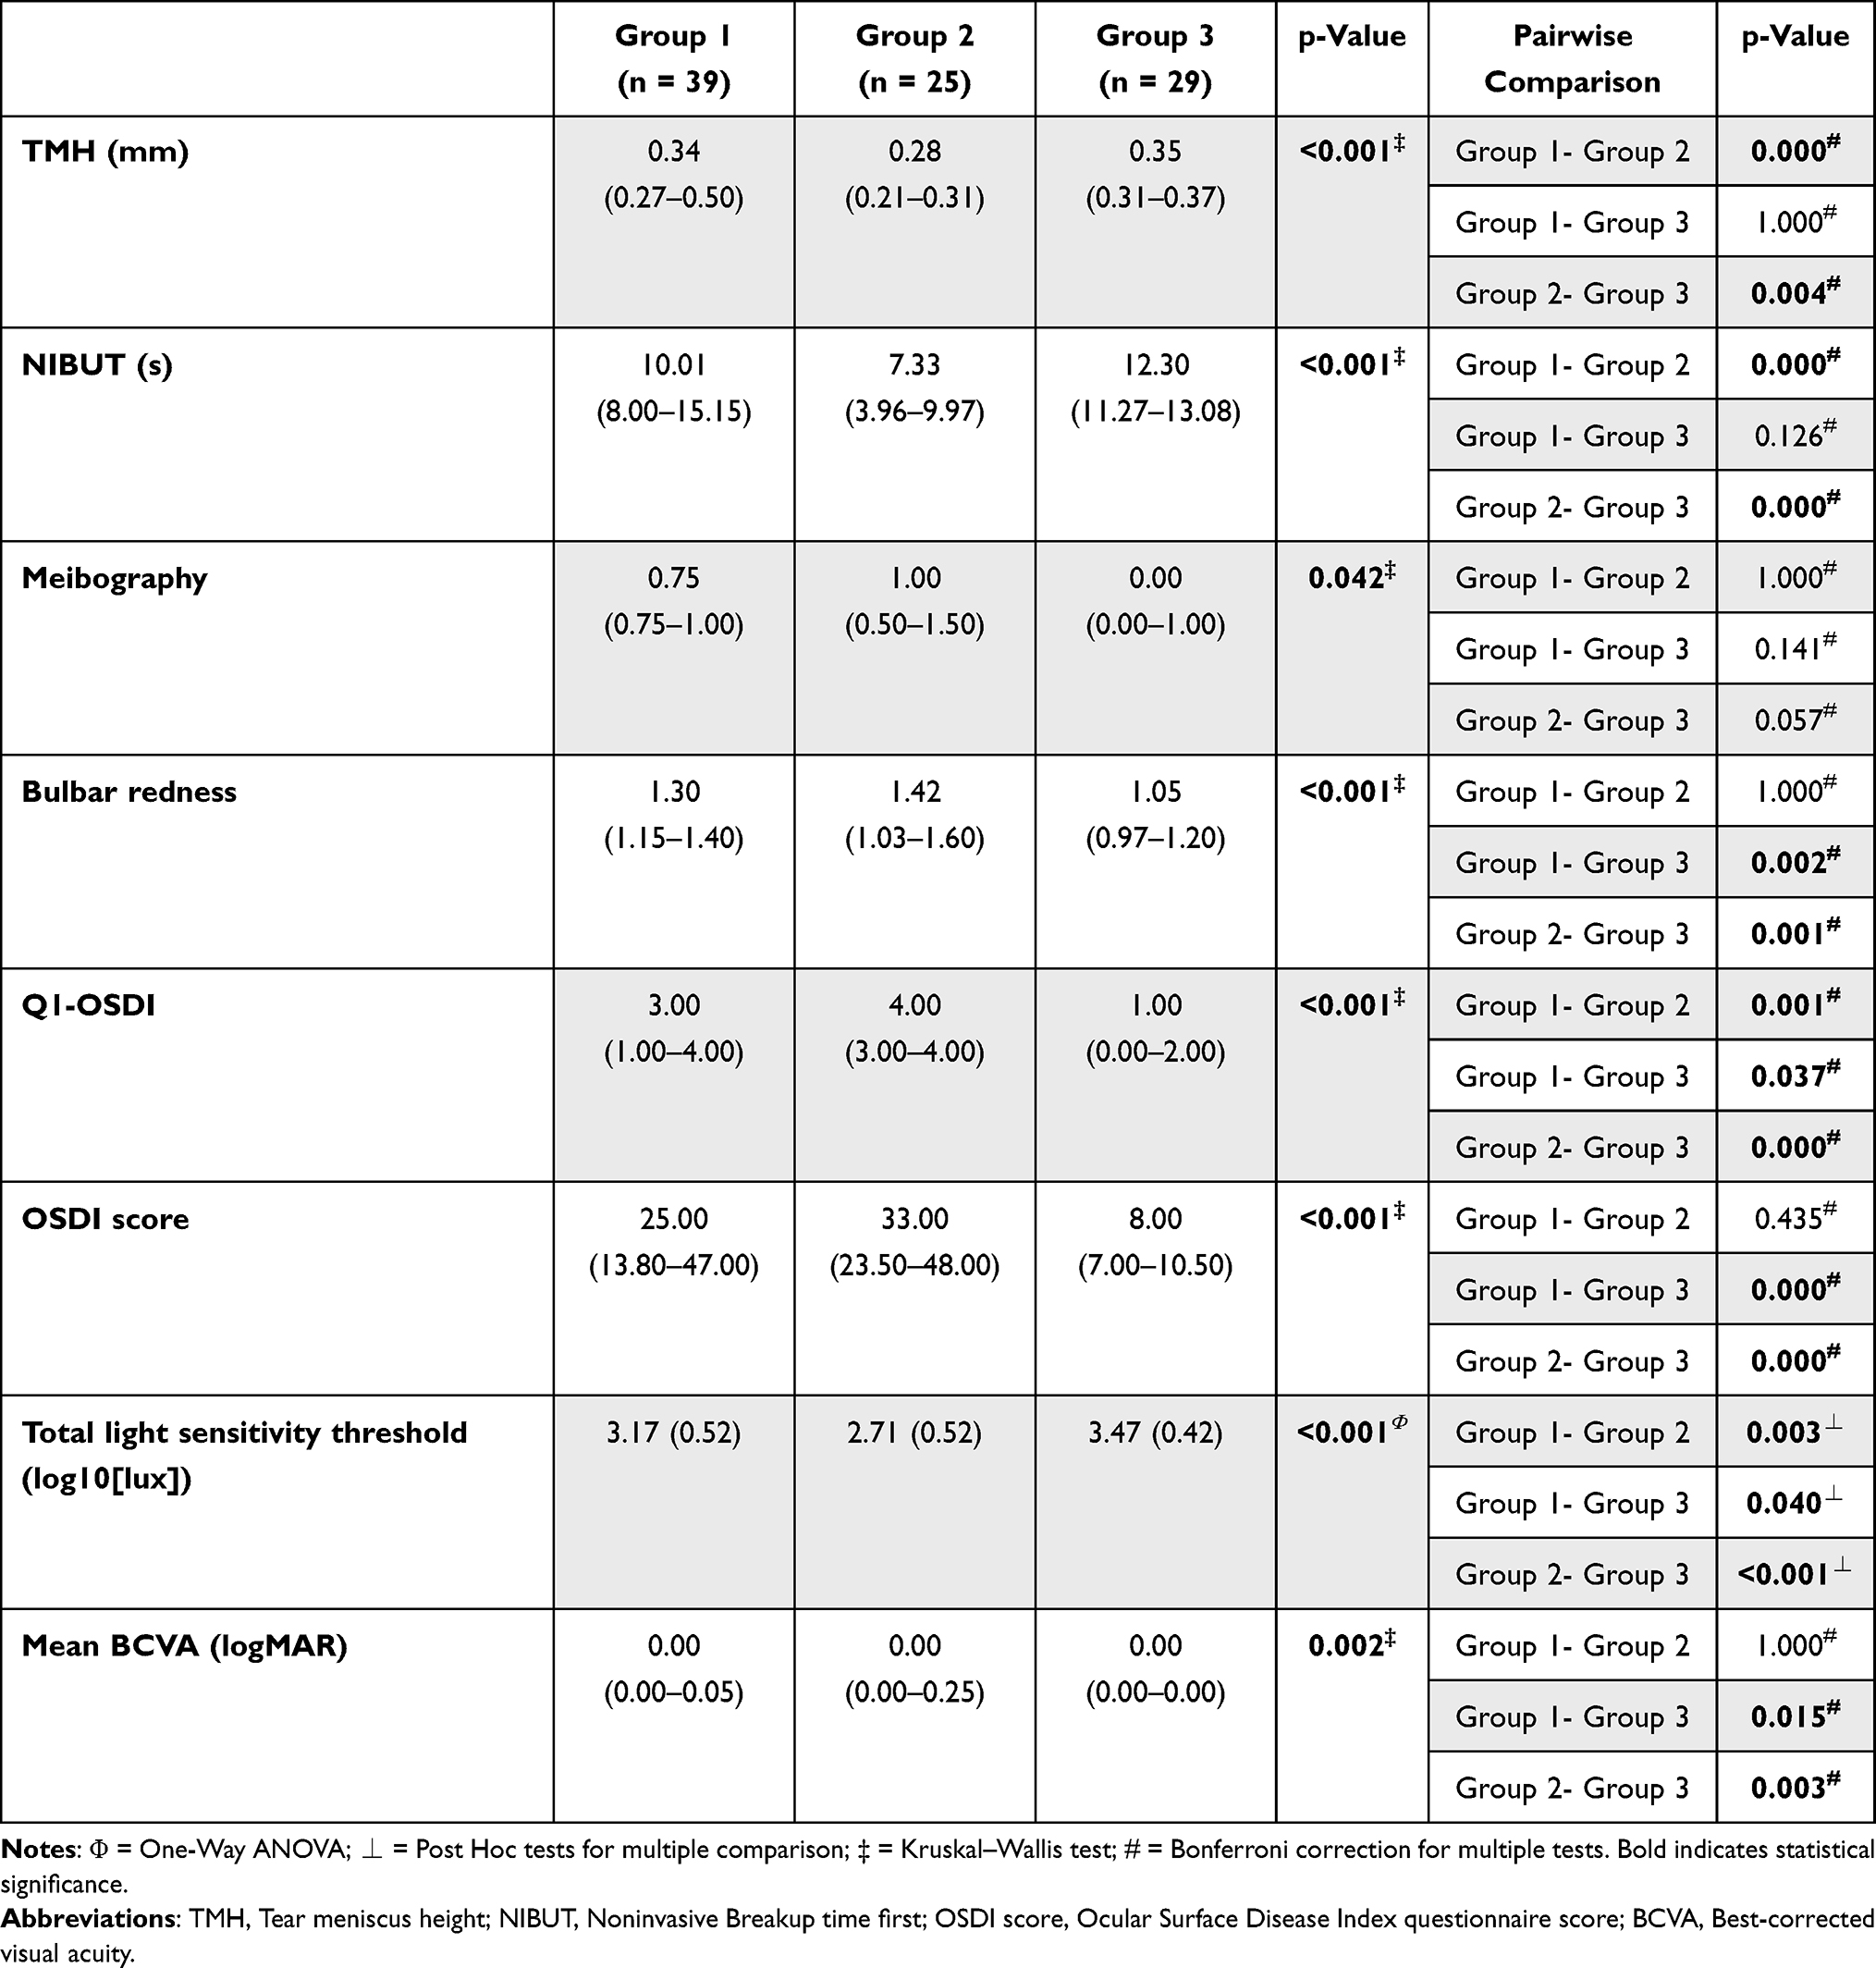 |
Table 1 Ocular Parameters Analyzed in Patients with TED (Group 1, n = 39) and DED (Group 2, n = 25) and in Healthy Subjects (Group 3, n = 29). Data are Presented as Mean (SD) or Median (IQR), as Appropriate |
TMH differed significantly among the groups (p < 0.001). In detail, TMH was significantly lower in group 2 compared to group 1 (p = 0.000) and group 3 (p = 0.004), while no significant difference was found between groups 1 and 3 (p = 1.000). Also, NIBUT differed significantly among the groups (p < 0.001). Group 2 showed a lower NIBUT compared to group 1 (p = 0.000) and group 3 (p = 0.000), whereas groups 1 and 3 were not significantly different (p = 0.126).
Infrared meibography presented differences (p = 0.042), but pairwise comparisons did not reveal significance among the groups (all p > 0.05). Bulbar redness showed significant differences among the groups (p < 0.001). In detail, redness was higher in groups 1 and 2 compared to group 3 (p = 0.002 and p = 0.001, respectively), while no difference was found between groups 1 and 2 (p = 1.000).
OSDI questionnaire scores demonstrated significant differences across all groups (p < 0.001). Both Q1-OSDI and total OSDI scores were significantly higher in both patient groups compared to controls. For Q1-OSDI, group 2 showed the highest scores, followed by group 1 and group 3, with all pairwise comparisons reaching statistical significance (all p < 0.05). Total OSDI scores were similarly higher in group 2 and group 1 (p = 0.435), both significantly different compared to group 3 (p < 0.001 for both comparisons). Total light sensitivity threshold differed significantly among the groups (p < 0.001). Group 3 demonstrated the highest threshold (3.47 ± 0.42 log10[lux]), followed by group 1 (3.17 ± 0.52 log10[lux]) and group 2 (2.71 ± 0.52 log10[lux]) with all intergroup comparisons reaching statistical significance (all p < 0.05). Also, BCVA showed significant differences among the groups (p = 0.002). Group 2 had the poorest visual acuity, which was significantly worse than group 3 (p = 0.003) but comparable to group 1 (p = 1.000). Group 1 also demonstrated significantly worse BCVA compared to healthy controls (p = 0.015).
Analysis of Moderate-to-Severe Active vs Mild Non-Active TED
Among patients with GD and TED, 22 (56.4%) were euthyroid, 9 (23.1%) and 6 (15.4%) were on methimazole treatment for a subclinical hyperthyroidism and an overt hyperthyroidism, respectively. Two patients (5.1%) had been previously treated with I131 (more than 12 months before study enrolment) and were on levothyroxine (LT4) treatment for hypothyroidism. Patients with moderate-to-severe active TED (n = 14) and patients with mild non-active TED (n = 25) were compared. Demographical and clinical data are reported in Table 2.
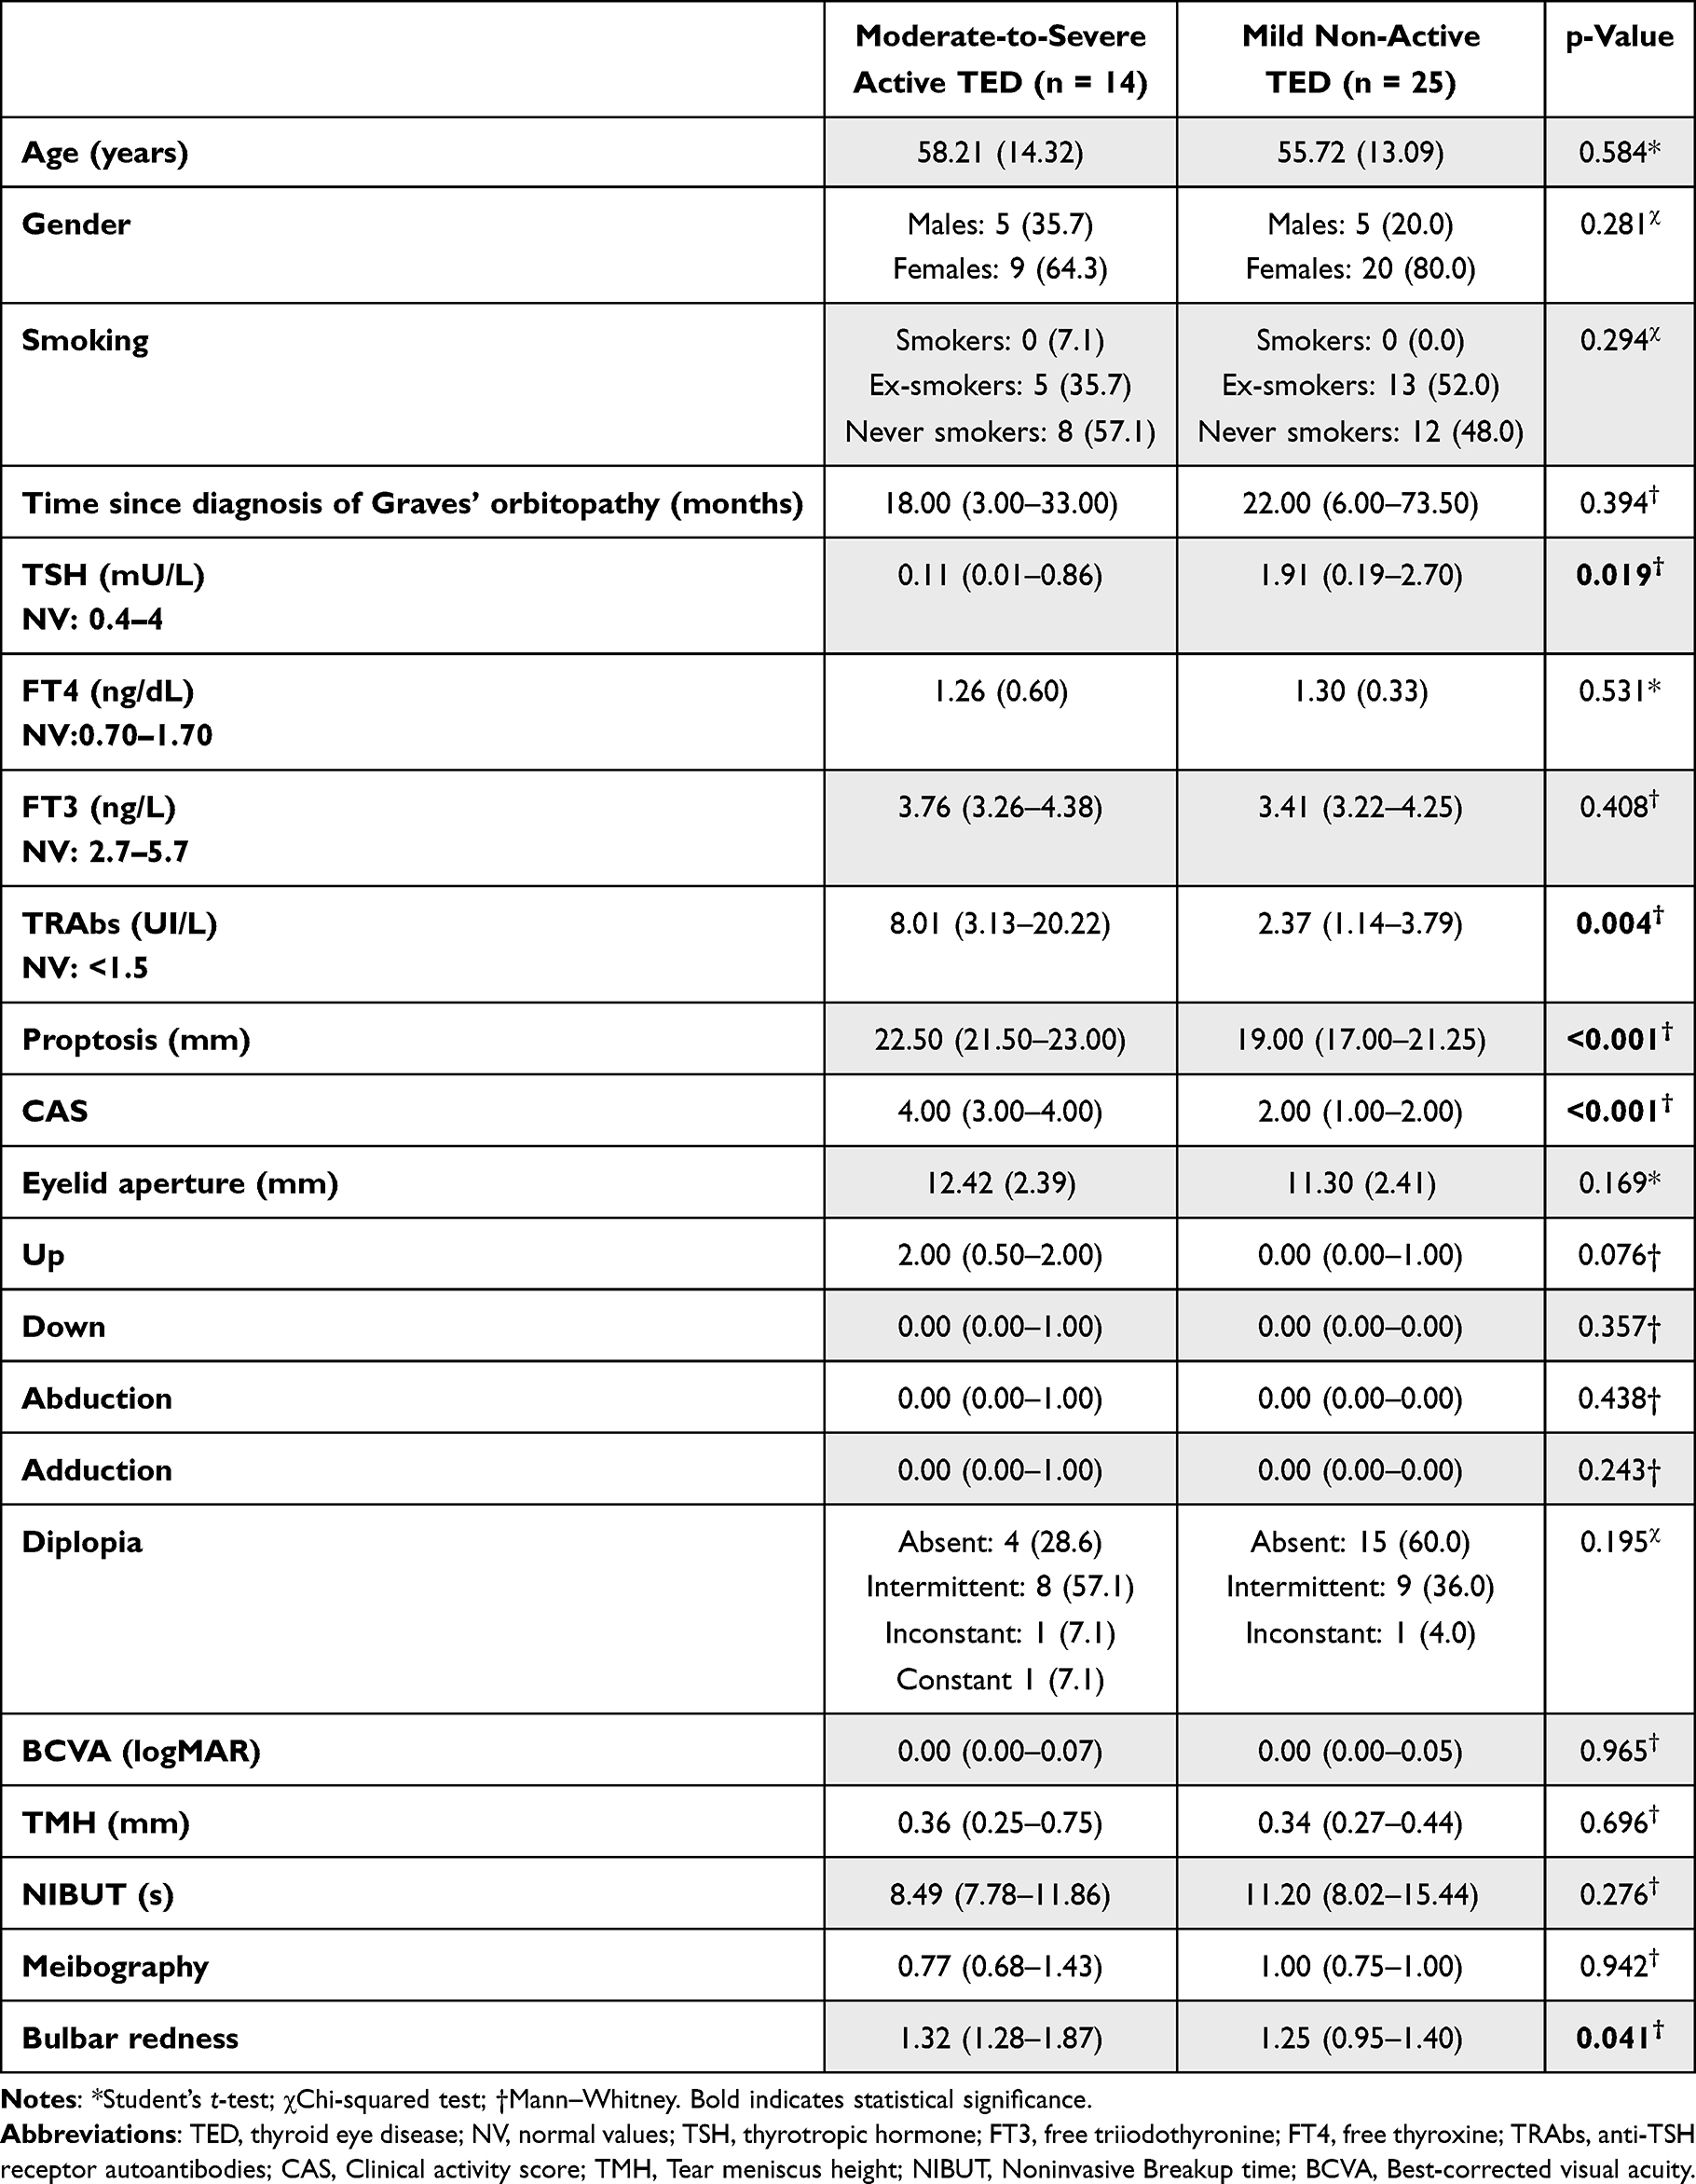 |
Table 2 Demographic and Clinical Features of Patients with Moderate-to-Severe Active TED (n = 14) and Patients with Mild Non-Active TED (n = 25). Data are Presented as Mean (SD), Median (IQR), or Numbers (%), as Appropriate |
No significant differences were observed in age, gender distribution, smoking status, or time since diagnosis between groups. Regarding thyroid function, patients with moderate-to-severe active TED exhibited significantly lower serum TSH levels compared to those with mild non-active disease (0.11 [0.01–0.86] vs 1.91 [0.19–2.70] mU/L, p = 0.019), while FT4 and FT3 values did not differ significantly between groups (p = 0.531 and p = 0.408, respectively). TRAb titers were higher in the active group (8.01 [3.13–20.22] vs 2.37 [1.14–3.79] UI/L, p = 0.004).
Concerning ocular parameters, patients with moderate-to-severe active TED exhibited significantly higher proptosis (p < 0.001), CAS (p < 0.001) and bulbar redness (p = 0.028) whereas eye motility did not differ significantly between groups. OSDI-related parameters were significantly higher (Q1-OSDI, p = 0.032; OSDI score, p = 0.041) while light discomfort thresholds across all lighting conditions were significantly lower (respectively, 3.00 ± 0.53 log10[lux] vs 3.38 ± 0.52 [p = 0.045] for continuous warm; 2.83 (2.42–3.40) vs 3.58 (3.34–3.85) [p = 0.006] for continuous cold; 2.61 ± 0.47 vs 3.17 ± 0.52 [p = 0.041] for flashing warm; 2.85 ± 0.48 vs 3.35 ± 0.47 [p = 0.004] for total light sensitivity) in patients with moderate-to-severe active TED compared to those with mild non-active TED (Figure 1).
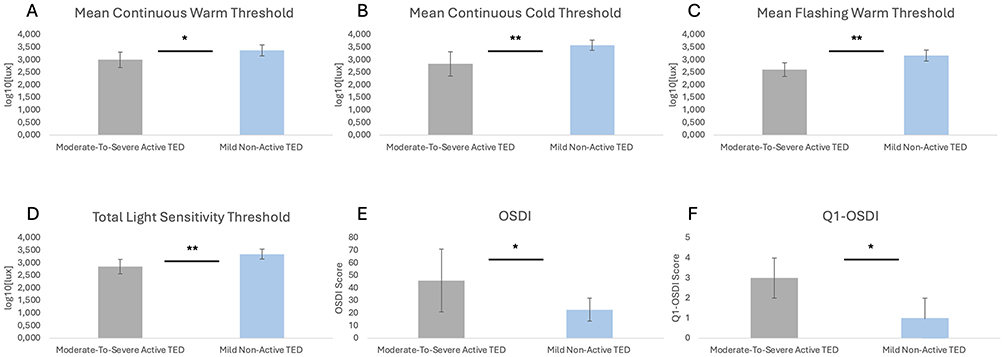 |
Figure 1 Patients with moderate-to-severe active thyroid eye disease (TED) experience lower light discomfort thresholds across all lighting conditions (A–D) and higher Ocular Surface Disease Index (OSDI) (E) and Question 1 (Q1)-OSDI (F) compared with mild non-active TED patients. The statistical significance was assessed by Student’s t-test and Mann–Whitney test, as appropriate. p-value significance: p < 0.05, *; p < 0.01, **. |
The total light sensitivity threshold was evaluated for a possible correlation with different ocular and hormonal parameters (Table 3).
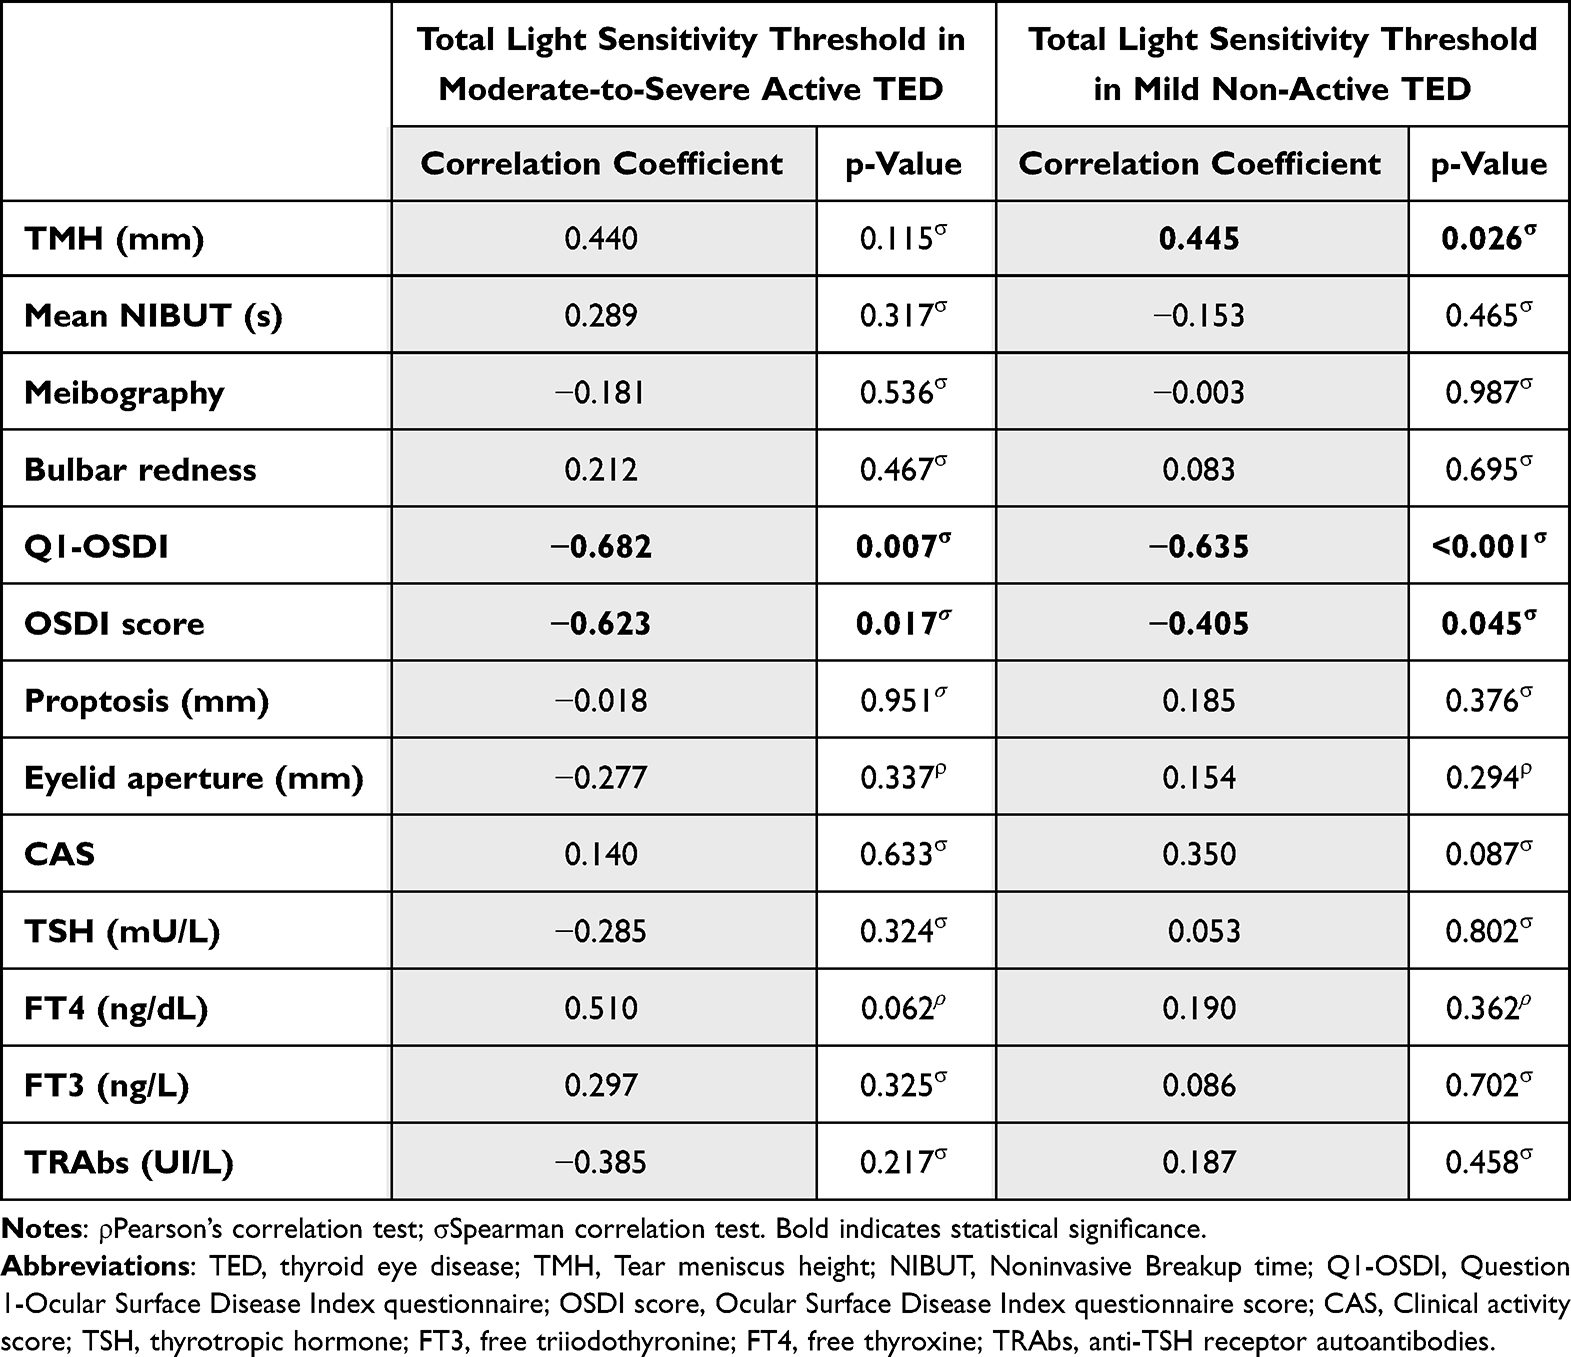 |
Table 3 Correlations Between Total Light Sensitivity Threshold and Ocular/Hormonal Parameters Evaluated in Patients with Moderate-to-Severe Active TED (n = 14) and Patients with Mild Non-Active TED (n = 25) |
In the moderate-to-severe active TED group, total light sensitivity threshold showed a significant negative correlation with both Q1-OSDI (R = −0.682, p = 0.007) and the OSDI score (R = −0.623, p = 0.017). No significant correlations were found with TMH, NIBUT, infrared meibography, bulbar redness, proptosis, eyelid aperture, CAS, TSH, FT4, FT3 and TRAbs. Similarly, in the mild non-active TED group, a significant negative correlation was observed between total light sensitivity threshold and both Q1-OSDI (R = −0.635, p < 0.001) and OSDI score (R = –0.405, p = 0.045). In addition, a significant positive correlation was observed with TMH (R = 0.445, p = 0.026) No significant correlations were detected among total light sensitivity threshold and the other variables investigated.
To further explore the relationship between light sensitivity and disease activity, univariate logistic regression analyses were performed to assess the association between light sensitivity thresholds and each individual component of the CAS. The analysis revealed a trend toward an association between light sensitivity and conjunctival hyperemia (p = 0.07). No statistically significant associations were observed between light sensitivity and the other individual components of the CAS.
In addition, receiver operating characteristic (ROC) curve analysis was used to evaluate the ability of light sensitivity thresholds to discriminate between patients with mild non-active TED and those with moderate-to-severe active TED. The area under the curve (AUC), 95% confidence intervals, and optimal cut-off values were calculated (Figure 2). ROC curve analysis demonstrated that light sensitivity effectively discriminated between patients with mild non-active TED and those with moderate-to-severe active TED, with an AUC of 0.78 (95% CI: 0.61–0.95, p = 0.0066). A threshold value >0.55 yielded a sensitivity of 79.1% and a specificity of 66.7%.
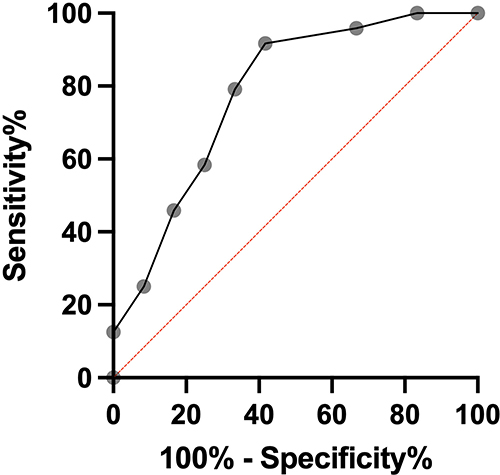 |
Figure 2 Receiver operating characteristic (ROC), AUC 0.7813, Std. Error 0.08761, 95% CI 0,6095 to 0,9530, p-value = 0.0066. |
Discussion
Light sensitivity is a commonly reported symptom in patients with ocular surface alterations, yet its objective quantification remains challenging in clinical practice. In this study, a quantitative assessment of photophobia, using both a validate questionnaire (OSDI Q1) and a semi-automated tool (Lumiz 100), was provided, comparing patients with TED with those affected by DED and with healthy controls. TED patients exhibited intermediate levels of photophobia, higher than controls but lower than DED patients. Specifically, DED patients had the lowest light discomfort thresholds, whereas TED patients showed significant photosensitivity compared to controls. Within the TED group, moderate-to-severe active disease was associated with a higher degree of photosensitivity than mild non-active disease. Furthermore, light discomfort threshold correlated strongly with self-reported light sensitivity and overall symptom burden, but not with ocular surface or hormonal parameters.
Photophobia is generally defined as an increased sensitivity to normal lighting conditions and is a well-recognized feature in both DED and TED,6,9,13,15,24,25 occurring in up to 79% and 48% of patients.6,15,25 In our cohort, DED patients had the highest photosensitivity, along with the most pronounced tear film instability and reduced tear production. Although these findings might suggests a direct relationship between tear film dysfunction and photophobia, the lack of correlation between signs and symptoms in DED is a well-established observation.13,15,26 TED patients also exhibited increased light sensitivity compared to healthy subjects, with significant correlations between light sensitivity and symptom scores, but not with other ocular parameters, in both moderate-to-severe, active TED and mild disease. This suggests that in the setting TED photophobia may arise through different overlapping mechanisms involving peripheral and central sensitization. The irritation of trigeminal nerve afferents, induced by chronic exposure and inflammation, may play a key role in the development of photophobia in ocular surface disease.24 On the other hand, the dense innervation of the orbital tissues,24 along with inflammation, edema, and vascular congestion within the extraocular muscles and orbital connective tissue - hallmarks of TED - may further stimulate trigeminal nerve endings, resulting in heightened light sensitivity. Moreover, it is conceivable that immune-mediated processes specific to TED may sensitize neural pathways.
A major finding of this study is the clear difference in light sensitivity between patients with moderate-to-severe active TED and those with mild non-active disease. Indeed, patients with moderate-to-severe active TED showed consistently lower discomfort thresholds across all lighting conditions. This observation suggests that photophobia in TED is linked to disease activity and severity rather than merely representing a consequence of structural orbital changes. Supporting this interpretation, in agreement with findings reported by Parunakian et al,27 light sensitivity showed no correlation with proptosis and eyelid aperture, which represent relatively static anatomical features.
The active inflammatory phase of TED, characterized by increased production of inflammatory cytokines, adipogenesis and orbital tissue edema,2 may directly sensitize ocular and periorbital nociceptive pathways, lowering the threshold for light-induced discomfort. However, there was no significant correlations between light sensitivity and thyroid function parameters, TRAbs levels and CAS in our cohort. This suggests that while systemic autoimmunity and disease activity may play a role, photophobia remains probably more directly related to a combination of local and central mechanisms, as reported above. Notably, although light sensitivity did not show significant associations with individual CAS components, it demonstrated good discriminative ability between mild non-active disease and moderate-to-severe active TED, as highlighted by the ROC analysis. This finding suggests that light sensitivity reflects the overall inflammatory disease state rather than being driven by a single clinical sign of soft tissue involvement. The observed trend toward an association with conjunctival hyperemia is biologically plausible, as this feature directly reflects ocular surface inflammation and vascular congestion, which may contribute to increased discomfort. Collectively, these results support the concept that photophobia in TED represents an integrative symptom related to disease activity and inflammatory burden rather than a direct consequence of isolated anatomical or clinical features.
Recognition of photophobia as a clinically meaningful symptom in TED patients has important clinical implications. It represents a source of considerable discomfort and functional limitation, as reflected in higher OSDI scores, and should be systematically evaluated during clinical assessment. Little is known about potential therapeutic strategies for assessing photophobia in TED. The positive correlation between TMH and light sensitivity threshold in mild non-active TED patients suggests that adequate tear volume may provide some protective effect against photophobia, potentially through improved optical surface quality or reduced corneal nociceptor stimulation. However, this relationship was not observed in active disease, further supporting the concept that inflammatory mechanisms override structural factors in determining light sensitivity during active phases of TED. Accordingly, tear substitutes have showed limited therapeutic response in reducing light sensitivity,28 substantiating that the tear film stabilization alone may be insufficient in alleviating photophobia. Interestingly, recent evidence indicates that treatment with teprotumumab, an IGF-1R inhibitor, may alleviate light sensitivity in TED,27 potentially through modulation of IGF-1R signaling in corneal epithelial cells.29,30 However, this mechanism remains speculative in the absence of direct corneal assessments.27
Several methodological aspects strengthen the validity of the present study. First, the use of the Lumiz 100 device enabled a semi-automated and quantitative assessment of light sensitivity, providing standardized and reproducible measurements under controlled conditions. This approach overcomes limitations of purely subjective photophobia assessment and enables precise quantification of light discomfort thresholds. Second, light sensitivity was tested under three distinct lighting conditions designed to simulate real-world visual environments. The finding that TED patients demonstrated reduced tolerance across all lighting conditions tested indicates that photophobia in TED is a robust phenomenon not limited to specific lighting circumstances. Third, the presence of appropriate control groups, including both DED patients and healthy subjects, enabling comparative assessment and providing context for interpreting the significance of findings in TED patients.
Nonetheless, some limitations must be acknowledged. The cross-sectional design precludes assessment of longitudinal changes in light sensitivity with disease progression or treatment. Although the post hoc power analysis confirmed that the overall sample size was sufficient to detect significant differences among groups for the primary outcome, the relatively small sample size represents a limitation especially considering the further stratification for subgroup analyses. Prospective studies tracking light sensitivity over time, particularly in response to therapeutic interventions for active TED, would provide valuable insights into the dynamic nature of photophobia and its relationship to disease course. In addition, while a comprehensive ocular surface analysis was performed, corneal nerve structure and function, which may play important roles in mediating photophobia, were not evaluated. In vivo confocal microscopy (IVCM) studies examining corneal nerve density, morphology, and inflammatory cell infiltration in TED patients with varying degrees of photophobia could elucidate neural mechanisms underlying light sensitivity in this population. Furthermore, while patients taking certain medications known to affect light sensitivity were excluded, some participants were receiving thyroid-related medications, which could potentially influence photophobia. However, the lack of correlation between thyroid function parameters and light sensitivity suggests that this influence, if present, is likely minimal.
Future research should focus on larger and longitudinal studies to examine changes in light sensitivity during different phases of TED disease activity and in response to different treatment. Moreover, investigation of corneal nerve structure and function using IVCM in TED patients with varying degrees of photophobia would provide insights into neural mechanisms underlying light sensitivity. Finally, mechanistic studies examining inflammatory mediators in tears and orbital tissues of TED patients with photophobia could identify specific molecular pathways contributing to light sensitivity. Such knowledge might enable development of novel therapeutic approaches targeting these pathways to alleviate photophobia.
Conclusion
This study provides the first quantitative evidence that light sensitivity represents a distinct and measurable manifestation of TED. These patients exhibited intermediate light sensitivity between DED patients and healthy controls, with markedly lower discomfort thresholds in patients with moderate-to-severe active TED. The dissociation between light sensitivity and most ocular surface parameters suggests that photophobia in TED is not a merely consequence of tear film disruption but rather arises through complex mechanisms involving inflammatory processes and neural sensitization. Recognizing photophobia as a clinically relevant manifestation of TED and including light sensitivity quantitative assessment into routine clinical evaluation could improve disease characterization and patient management.
Abbreviations
GD, Graves’ Disease; TED, Thyroid Eye Disease; EUGOGO, European Group on Graves’ Orbitopathy; CAS, Clinical Activity Score; FT3, Free Triiodothyronine; FT4, Free Thyroxine; LT4, Levothyroxine; TRAbs, Anti-TSH Receptor Autoantibodies; IGF-1R, Insulin-like Growth Factor 1 Receptor; DED, Dry eye disease; OSDI, Ocular Surface Disease Index; OSDI, Q1 Question 1 of the Ocular Surface Disease Index; TFOS, Tear Film & Ocular Surface Society; DEWS, Dry Eye Workshop; NIBUT, Non-invasive break-up time; TMH, Tear meniscus height; MGL, Meibomian gland loss; BCVA, Best-corrected visual acuity; IVCM, In Vivo Confocal Microscopy; SD, Standard deviation; IQR, Interquartile Range.
Data Sharing Statement
The datasets used and/or analyzed during the current study are available from the corresponding author on reasonable request.
Ethical Approval and Informed Consent
The study was conducted in accordance with the Declaration of Helsinki and approved by the Institutional Review Board of “Comitato Etico Territoriale Lazio Area 2” (approval date 13-02-2025). Written informed consent was obtained from all participants.
Author Contributions
Giulia Lanzolla and Giuseppe Giannaccare contributed equally as co-last authors. All authors made a significant contribution to the work reported, whether that is in the conception, study design, execution, acquisition of data, analysis and interpretation, or in all these areas; took part in drafting, revising or critically reviewing the article; gave final approval of the version to be published; have agreed on the journal to which the article has been submitted; and agree to be accountable for all aspects of the work.
Funding
This research received no specific grant from any funding agency in the public, commercial or not-for-profit sectors.
Disclosure
The authors report no conflicts of interest in this work.
References
1. Bartalena L, Tanda ML. Current concepts regarding Graves’ orbitopathy. J Intern Med. 2022;292(5):692–13. doi:10.1111/joim.13524
2. Wiersinga WM, Eckstein AK, Žarković M. Thyroid eye disease (Graves’ orbitopathy): clinical presentation, epidemiology, pathogenesis, and management. Lancet Diabetes Endocrinol. 2025;13(7):600–614. doi:10.1016/S2213-8587(25)00066-X
3. Lixi F, Cuccu A, Giannaccare G, et al. Subclinical Ocular Motility Dysfunction and Extraocular Muscle Changes in Inactive Graves’ Orbitopathy. J Pers Med. 2024;14(8):848. doi:10.3390/jpm14080848
4. Allam IY, Lazreg S, Shafik Shaheen M, Doheim MF, Mohammed MA. Ocular Surface Changes in Patients with Thyroid Eye Disease: an Observational Clinical Study. Clin Ophthalmol. 2021;15:2481–2488. doi:10.2147/OPTH.S317708
5. Maglionico MN, Lanzolla G, Figus M, et al. Ocular surface disease index in Graves’ orbitopathy: a cross-sectional study. Front Endocrinol. 2024;15:1428185. doi:10.3389/fendo.2024.1428185
6. Cockerham KP, Padnick-Silver L, Stuertz N, Francis-Sedlak M, Holt RJ. Quality of Life in Patients with Chronic Thyroid Eye Disease in the United States. Ophthalmol Ther. 2021;10(4):975–987. doi:10.1007/s40123-021-00385-8
7. Cortez MM, Digre K, Uddin D, et al. Validation of a photophobia symptom impact scale. Cephalalgia. 2019;39(11):1445–1454. doi:10.1177/0333102419845641
8. Schiffman RM, Christianson MD, Jacobsen G, Hirsch JD, Reis BL. Reliability and validity of the Ocular Surface Disease Index. Arch Ophthalmol. 2000;118(5):615–621. doi:10.1001/archopht.118.5.615
9. Karakoleva EV, Pondelis N, Talbert C, et al. Heightened visual light sensitivity discomfort measured by the ocular photosensitivity analyzer is associated with chronic ocular pain. Ocul Surf. 2025;38:64–71. doi:10.1016/j.jtos.2025.06.007
10. Montés-Micó R, Cerviño A, Martínez-Albert N, García-Marqués JV, Marie S. Performance of a new device for the clinical determination of light discomfort. Expert Rev Med Devices. 2020;17(11):1221–1230. doi:10.1080/17434440.2020.1837623
11. Marié S, Montés-Micó R, Martínez-Albert N, García-Marqués JV, Cerviño A. Evaluation of Physiological Parameters on Discomfort Glare Thresholds Using LUMIZ 100 Tool. Transl Vis Sci Technol. 2021;10(8):28. doi:10.1167/tvst.10.8.28
12. Lixi F, Corda C, Coco G, et al. Light discomfort thresholds in patients with senile cataract versus pseudophakic subjects. Graefes Arch Clin Exp Ophthalmol. 2025;263(11):3147–3154. doi:10.1007/s00417-025-06941-3
13. Lixi F, Coco G, Corda C, et al. Light discomfort thresholds under different lighting conditions in healthy subjects and dry eye patients. Sci Rep. 2025;15(1):29213. doi:10.1038/s41598-025-15633-1
14. Lixi F, Coco G, Calabresi V, et al. Quantitative assessment of light discomfort thresholds in a patient with photoallodynia treated with topical naltrexone 0.01. Am J Ophthalmol Case Rep. 2025;41:102500. doi:10.1016/j.ajoc.2025.102500. PMID: 41487290; PMCID: PMC12756562.
15. Buchanan TM, Digre KB, Warner JEA, Katz BJ. The Unmet Challenge of Diagnosing and Treating Photophobia. J Neuroophthalmol. 2022;42(3):372–377. doi:10.1097/WNO.0000000000001556
16. Singh S, Maity M, Ali MH, Basu S. Tear Film and Dry Eye Characteristics as Predictors of Photophobia in 374 Patients with Dry Eye Disease. Semin Ophthalmol. 2025;40(3):235–238. doi:10.1080/08820538.2024.2429630
17. Bartalena L, Kahaly GJ, Baldeschi L, et al. The 2021 European Group on Graves’ orbitopathy (EUGOGO) clinical practice guidelines for the medical management of Graves’ orbitopathy. Eur J Endocrinol. 2021;185(4):G43–G67. doi:10.1530/EJE-21-0479
18. Wolffsohn JS, Arita R, Chalmers R, et al. TFOS DEWS II Diagnostic Methodology report. Ocul Surf. 2017;15(3):539–574. doi:10.1016/j.jtos.2017.05.001
19. Tian L, Qu JH, Zhang XY, Sun XG. Repeatability and Reproducibility of Noninvasive Keratograph 5M Measurements in Patients with Dry Eye Disease. J Ophthalmol. 2016;2016:8013621. doi:10.1155/2016/8013621
20. Vaccaro S, Borselli M, Scalia G, et al. A Novel Noninvasive Screening Tool for Dry Eye Disease. Diagnostics. 2024;14(12):1209. doi:10.3390/diagnostics14121209
21. Mourits MP, Prummel MF, Wiersinga WM, Koornneef L. Clinical activity score as a guide in the management of patients with Graves’ ophthalmopathy. Clin Endocrinol. 1997;47(1):9–14. doi:10.1046/j.1365-2265.1997.2331047.x. Erratum in: Clin Endocrinol (Oxf) 1997 Nov;47(5):632. PMID: 9302365.
22. Bahn RS, Gorman CA. Choice of therapy and criteria for assessing treatment outcome in thyroid-associated ophthalmopathy. Endocrinol Metab Clin North Am. 1987;16(2):391–407. PMID: 3319588.
23. Dolman PJ, Cahill K, Czyz CN, et al. Reliability of estimating ductions in thyroid eye disease: an International Thyroid Eye Disease Society multicenter study. Ophthalmology. 2012;119(2):382–389. doi:10.1016/j.ophtha.2011.07.011. Epub 2011 Sep 29. PMID: 21959369.
24. Digre KB, Brennan KC. Shedding light on photophobia. J Neuroophthalmol. 2012;32(1):68–81. doi:10.1097/WNO.0b013e3182474548
25. Galor A, Levitt RC, Felix ER, Sarantopoulos CD. What can photophobia tell us about dry eye? Expert Rev Ophthalmol. 2016;11(5):321–324. doi:10.1080/17469899.2016.1222905
26. Galor A, Zlotcavitch L, Walter SD, et al. Dry eye symptom severity and persistence are associated with symptoms of neuropathic pain. Br J Ophthalmol. 2015;99(5):665–668. doi:10.1136/bjophthalmol-2014-306057
27. Parunakian E, Ugradar S, Tolentino J, et al. Teprotumumab improves light sensitivity in patients with thyroid eye disease. Graefes Arch Clin Exp Ophthalmol. 2024;262(9):2999–3006. doi:10.1007/s00417-024-06491-0
28. Galor A, Batawi H, Felix ER, et al. Incomplete response to artificial tears is associated with features of neuropathic ocular pain. Br J Ophthalmol. 2016;100(6):745–749. doi:10.1136/bjophthalmol-2015-307094
29. Titone R, Zhu M, Robertson DM. Insulin mediates de novo nuclear accumulation of the IGF-1/insulin Hybrid Receptor in corneal epithelial cells. Sci Rep. 2018;8(1):4378. doi:10.1038/s41598-018-21031-7
30. Rocha EM, Cunha DA, Carneiro EM, Boschero AC, Saad MJA, Velloso LA. Identification of insulin in the tear film and insulin receptor and IGF-1 receptor on the human ocular surface. Invest Ophthalmol Vis Sci. 2002;43(4):963–967.
 © 2026 The Author(s). This work is published and licensed by Dove Medical Press Limited. The
full terms of this license are available at https://www.dovepress.com/terms
and incorporate the Creative Commons Attribution
- Non Commercial (unported, 4.0) License.
By accessing the work you hereby accept the Terms. Non-commercial uses of the work are permitted
without any further permission from Dove Medical Press Limited, provided the work is properly
attributed. For permission for commercial use of this work, please see paragraphs 4.2 and 5 of our Terms.
© 2026 The Author(s). This work is published and licensed by Dove Medical Press Limited. The
full terms of this license are available at https://www.dovepress.com/terms
and incorporate the Creative Commons Attribution
- Non Commercial (unported, 4.0) License.
By accessing the work you hereby accept the Terms. Non-commercial uses of the work are permitted
without any further permission from Dove Medical Press Limited, provided the work is properly
attributed. For permission for commercial use of this work, please see paragraphs 4.2 and 5 of our Terms.