
Back to Journals » Clinical Optometry » Volume 18
Lead Times of Optometry Services in Selected Public Hospitals in Rural South Africa
Authors Rapao MP  , Nkoana PMW
Received 20 December 2025
Accepted for publication 12 March 2026
Published 22 May 2026 Volume 2026:18 590480
DOI https://doi.org/10.2147/OPTO.S590480
Checked for plagiarism Yes
Review by Single anonymous peer review
Peer reviewer comments 2
Editor who approved publication: Prof. Dr. Chris Lievens
Mapula Precious Rapao, Pheagane Motsime William Nkoana
Department of Optometry, University of Limpopo, Polokwane, South Africa
Correspondence: Mapula Precious Rapao, University of Limpopo, Polokwane, South Africa, Tel +27760594971, Email [email protected]
Purpose: Efficient service delivery remains a critical benchmark of public sector performance, with lead and waiting times serving as essential indicators of responsiveness and accessibility. Long waiting times not only diminish user satisfaction but can also exacerbate inequalities in access, particularly in resource-constrained contexts. This study investigated the lead times of optometry services in selected hospitals in rural South Africa. By evaluating lead and waiting times and identifying contributing factors, the research further aimed to inform strategies for improving service delivery and reducing delays in optometry care.
Methods: A cross sectional, prospective, and observational designs was adopted to record and quantitatively describe waiting and lead times in five selected hospitals in Limpopo, South Africa. Retrospective, quantitative document review was also conducted to check waiting time to receive optical devices. Descriptive and inferential statistical analysis was performed. This study used a cross-sectional, prospective, quantitative, descriptive and observational design to track consulting patients in order to record the lead times throughout the consultation, time to secure referral appointment and waiting times to receive optical devices after consultation. Secondly, a survey of available hospital staff complement, equipment and facilities was conducted.
Results: The mean lead-time across all service points was 255.6 ± 124.7 minutes and 31.2 ± 35.1 minutes for optometry service. The lead times varied per hospital (p = 0.05). Overall waiting time for spectacles averaged 121.0 ± 181.5 days. All sites had basic optometry equipment, but specialised instruments (eg., fundus camera) were distributed unevenly among sites. The most frequently referred condition was cataract, and the referral time depends on the severity of the condition.
Conclusion: Selected hospitals had longer waiting times that exceeded national guidelines for South Africa by an average of 2 hours. Improving capacity on staffing, equipment, patient flow management, and scheduling can reduce waiting times and guarantee more effective service delivery.
Keywords: lead time, waiting time, optometry services, rural South Africa, public hospitals
Introduction
Global health agendas increasingly position timely access to care as a fundamental indicator of health-system effectiveness.1 Within Universal Health Coverage (UHC), the World Health Organization (WHO) emphasises that people should obtain essential health services of adequate quality without financial hardship, making service availability and prompt access central to performance assessment. Delays in care delivery directly undermine these goals by worsening outcomes and deepening inequities. The World Report on Vision1 further identifies delays in accessing eye-care services as a significant barrier to reducing avoidable vision impairment, particularly in underserved and resource-constrained contexts. In response, the WHO promotes Integrated People-Centred Eye Care, which prioritises coordinated, continuous, efficient, and responsive service delivery across all levels of care. Within this model, indicators such as lead times and waiting periods are increasingly regarded as important system-level measures, reflecting how effectively health systems deliver timely, patient-centred eye care. Timely access to eye care is an essential component of an effective healthcare system.2
Lead times entail the total time between the beginning of a patient’s request for a service and the completion of that service, which in the context of healthcare will include all phases of the patient’s journey such as booking, waiting, consultation, and treatment.3,4 It is an important indicator for health services performance due to its ability to efficiently reflect the patient’s progress through the stages of care. For optometry service, lead times entail the time patients take to set and secure an appointment, the waiting time, the eye examination time, the time taken to receive spectacles, and the time it takes to secure an appointment during a referral.
Longer lead times may worsen existing conditions leading to visual impairment, reduce uptake of services, and create inefficiencies in an already strained health system, especially in public services.5 Treatable eye disorders including glaucoma6,7 and cataracts8,9 may worsen, diagnosis and treatment may be delayed, and no-show rates increased because of longer lead times.10,11 On the contrary, shorter lead times have an increased likelihood to improve early detection, treatment adherence, and overall service quality by enabling prompt access to care. Reducing lead times provides more advantages including improved patient satisfaction, better health outcomes, higher clinic efficiency and optimal use of resources.12
Lead times for eyecare vary from country to the next, but are much longer in low- to medium-income countries (LTMICs) with limited resources.13–15 Some of the examples are that patients in Denmark wait for an average of a month, those in the United Kingdom wait about 3 months, in Canada about 16 weeks, in Czech Republic about 30 weeks while those in Estonia and Canada may wait up to a year and half to two years to receive a cataract extraction.16 This realisation is an important issue used in healthcare services planning where countries like Poland, some general practitioners were considered for expanded roles such as ophthalmology services to curb the backlog.16 Research on lead times in LTMICs especially in Africa commonly focuses on the total time that patients spend in facilities. Nigerian tertiary hospitals report about two and a half to three hours of waiting times in clinics, with the longest delays occurring before examination by a clinician.17 Ethiopian studies on the other hand report similar challenges, with long waiting periods for outpatient care and variable access to surgery depending on available theatre lists and patient travel time.18,19
Like in many other LTMICs, South Africa experiences longer lead times in the provision of eye care services. These are more common in rural South Africa, which continues to face persistent constraints in the delivery of eye care, such as shortages of optometrists with specialised skills, limited working space, limited diagnostic equipment, irregular spectacle supply systems, and inadequate integration of eye care within broader health services.20,21 Rural hospitals often serve wide geographic areas with dispersed communities which increase patient volumes and intensifies pressure on the limited eye care workforce.2
The KwaZulu-Natal Department of Health public facilities experience similar challenges where some of the end-users initially walk for over 30 minutes from the rural to urban areas to seek eye health service.20 Critically, 64.3% of end-users wait for a day, 25% wait for up to three weeks, and some up to six weeks to see an optometrist.20 This phenomenon may result from limited capacity in human resources or capacity of the hospital in terms of equipment and working space hence not providing requisite eye health coverage. In some of the eye clinics, two to four hours waiting times were observed, and 46% of end-users waited a month to receive spectacles after an eye examination.20 In Limpopo Province, patients wait for longer times to secure appointment for management of special conditions such as keratoconus.22 Keratoconus patients wait for longer times to receive an appointment for contact lenses fitting, dispensing and aftercare.21
While these challenges have been reported in other relative studies, there has not been a specific study to quantify lead times in optometry services in selected public hospitals in Limpopo Province, South Africa. This is critical to develop evidence-based strategies to curb the longer lead or waiting times such as to improve patient satisfaction. This study aimed to quantify lead times for optometry services in selected public hospitals in Limpopo Province, South Africa, to generate evidence that can inform strategies to reduce waiting times and improve patient satisfaction.
Methodology
Study Design
This study used a cross-sectional, prospective, quantitative, descriptive and observational design to track consulting patients in order to record the lead times throughout the consultation. A pre-defined check list that includes applicable service points in the hospitals was used. Secondly, a survey of available hospital staff complement, equipment and facilities was conducted. Survey tool was used. Thirdly, waiting time to record the waiting times to secure appointments and to receive optical devices, a retrospective quantitative document analysis was conducted. Document review tool was used.
Study Setting
The study was conducted in selected regional public facilities of Limpopo Province of South Africa. Limpopo Province is one of the nine provinces in South Africa, and the northern most bordering Botswana, Zimbabwe and Mozambique. It has 5.8 million people and is generally characterised by significant poverty, unemployment and income inequality.23 Five district-level hospitals from each of the districts, Capricorn, Mopani, Sekhukhune, Waterberg and Vhembe, were included. Seshego Hospital which is situated 12 km northwest of Polokwane in the Capricorn district, Mokopane Hospital situated 5 km from Mokopane in the Waterberg district; Letaba Hospital situated 26.9 km from Tzaneen in the Mopani district; St. Rita’s Hospital which is located 12.6 km from Jane Furse in the Sekhukhune district, and Elim Hospital which is located 21.6 km from Lous Trichardt in the Vhembe district were included as research sites.
Study Population
The population in the study was all persons who received optometry services in the outpatient’s department in the five selected hospitals, Seshego, St Ritas, Letaba, Mokopane and Elim. This included those attending the service for refractive services or with other eye health problems. District hospitals in Limpopo Province are the primary referral facilities for most communities, especially rural and underserved populations. The estimated combined patient headcount of the hospitals averages 45,110 persons per year with an average 181 patients per day attending in all five hospitals. Secondly, all eye units of the five hospitals were included such as to document the capacity through the available working space, equipment and human resources for eye health. Lastly, all kept documents on referral of patients and spectacle orders were also included in the investigation.
Inclusion and Exclusion Criteria
All persons who sought optometry services in the five selected hospitals in Limpopo Province from August to November 2025 were included in the study. All participants granted researchers their consent of participation. Parents or legal guardians of children under 18 years granted consent while children granted assent of participation. All eye unit managers were included to represent the respective eye units within the stipulated data collection period. All kept documents on patients’ referrals and spectacle orders for the years October 2023 to July 2025 were included.
All persons who attended the eye unit but were not seen by an optometrist were excluded. All files with incomplete or insufficient information on patient referrals or spectacle orders were excluded.
Sample and Sampling Techniques
A multistage sampling procedure was used to select participants for the study. At the first stage of sampling, five hospitals from each district in Limpopo were selected. At the second stage, participants within the selected hospitals were selected randomly as they consulted until the set sampling targets were reached. Multistage sampling is recommended for large and geographically dispersed populations where a complete sampling frame is not readily available, as it enhances feasibility, reduces cost, and maintains representativeness through probability-based selection at successive levels.24 Participants were randomly approached and invited to participate in the study at the registry station. To estimate the sample size, the Ideal Health Establishment principle was used. Hence, for an estimated 200 consulting patients, 130 patients were included.25 The estimated number is ideal to keep the participant sample size minimal, such as to reduce interference of the service provision during the period of the study. Additionally, this was considered feasible based on the available staff, patient flow patterns and time.26,27
For data on equipment, working space and human resources for eye health, five eye managers from all selected hospitals were included. For data of patient referrals and spectacle orders and collections, all kept documents per hospitals were included.
Data Collection
A record form was developed for data collection. The form recorded lead times in five service stations which were (1) registry, (2) triage, (3) ophthalmology or ophthalmological nurses’ station, (4) optical services sections, and (5) pharmacy stations. The form was developed by the researcher and verified by the independent reviewers. Patient names were not used and rather the reference numbers. For waiting times on securing an appoitment to recieve a service and receiving spectacles, document review tools were used.
Validity and Reliability
To ensure content validity, the researcher created the record form and had two academic supervisors with relevant experience examine it. Content validity of the service point inclusion tool was established through expert review by five public sector optometrists, who rated the relevance of each service point using a four-point scale. Item-level validity was assessed using the Item Content Validity Index (I-CVI), with a minimum acceptable threshold of 0.78, while overall validity was determined using the Scale Content Validity Index (S-CVI), with ≥0.90 indicating excellent content validity. Service points that failed to meet these criteria were revised or excluded. Inter-rater reliability was evaluated using the Intraclass Correlation Coefficient (ICC) with a two-way random effects model and absolute agreement. ICC values were interpreted according to standard benchmarks, with good (0.75–0.90) or excellent (>0.90) agreement considered sufficient for inclusion. Together, the CVI and ICC provided robust evidence of relevance and expert agreement, ensuring that only appropriate and consistently rated service points were included in the optometry lead time analysis framework. Furthermore, pilot study was carried out to evaluate and improve data collection methods and instruments, enhancing instrument consistency and practical viability in real-world settings. Five patients, one in each hospital, were traced in each hospital to check instrument consistency and practical viability. The data from the pilot study were not included in analysis of the main findings. Same data collectors who were initially trained, collected data across all hospitals using standardised recording procedure and methods.
Patient Recruitment and Data Collection
When each patient arrived at the hospital, local data collectors went up to them, described the study, got their informed consent, and noted their arrival timings. Timestamps were recorded at each service point as several skilled data collectors followed patients through the registry, triage, ophthalmic nurse office, optometry office, ophthalmologist, and pharmacy. Additionally, facility managers were tasked with reviewing pertinent paperwork and delays, particularly in relation to the supply and dispensing of spectacles.
Data Analysis
For analysis of data, frequencies, percentages, means, and standard deviations described overall patterns. Normality was assessed via skewness, kurtosis and Kolmogorov–Smirnov tests. Analysis of variance was calculated to compare lead, waiting and service times between hospitals, and Kruskal Wallis to compare lead times by consultation type. IBM Statistical Package for Social Sciences version 30 was used for analysis. Table 1 provides a baseline for analysis in this write-up, where times beyond the stipulated were regarded as longer lead time, waiting, and service time, while those less were regarded as shorter times.
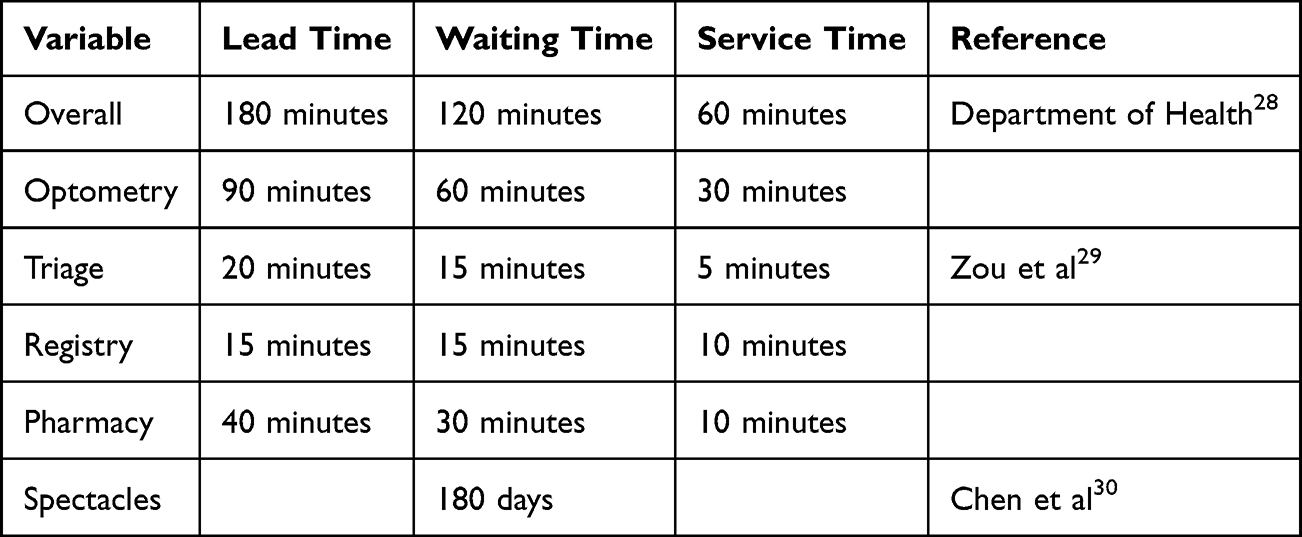 |
Table 1 Analysis Matrix for Lead Times |
Ethical Considerations
Ethical Clearance
The study complies with the Declaration of Helsinki. Ethical clearance was obtained from the University of Limpopo Turfloop Research Ethics Committee (Ref: TREC/208/2025:PG) before the study was initiated. After acquiring ethical clearance, the study was further registered and acquired gatekeeper permission from the National and Limpopo Department of Health. Further permissions were acquired from individual hospitals. Prior to participation, participants were informed of voluntary participation and their right to withdraw at any moment in the study process. Those who agreed to participate were required to provide written informed consent, and/or parental consent and assent were obtained for minors. Data was handled in compliance with the Department of Health’s and the HPCSA’s confidentiality requirements, retained exclusively by the research team, de-identified, and aggregated for reporting. Participants were informed of the risk or harm and measures put in place if any harm arose. No physical nor emotional was observed or reported.
Results
Hundred and thirty participants from the five district hospitals were tracked to document the lead and waiting times. Twenty-six participants were included from each hospital. Seventy-six (58.5%) were males, while 54 (41.4%) were females. Their mean age was 52.5 ± 27.0 years with minimum age of 2 years and maximum of 98 years. There was no significant difference (p = 0.468) of ages between females (52.7 ± 26.4 years) to males (52.3 ± 28.0 years). All participants were Black African.
Hospital Workflow
As part of the observation, porters were expected to move patients’ medical records form one service station to the next and this was said to improve the safety and confidentiality of patients’ medical records. Patients were not allowed to carry their records as they move between service points.
Figure 1 shows that participants attended the hospital for various reasons, with 65 (50.0%) for general eye health consultation, 33 (25.4%) consulted to collect eyedrops, 18 (13.8%) for review of their eye condition and 14 (10.8%) to collect their spectacles.
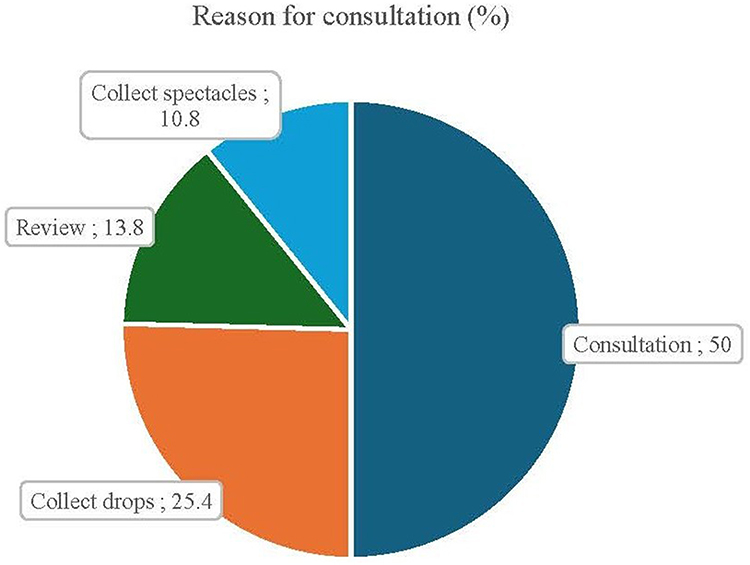 |
Figure 1 Sows the reasons for consultation. |
Overall Lead Times
Table 2 shows an overall average lead time of 255.6 ± 124.7 minutes recorded across the five district hospitals. Average lead times (in minutes) across the hospitals were recorded as 307.42 ± 165.54 at Letaba hospital, 265.38 ± 124.16 at Mokopane hospital, 249.92 ± 124.20 at St Ritas hospital, 245.73 ± 196.07 at Elim hospital, and 205.58 ± 74.37 at Seshego hospital. The lead times differed between hospitals, F (4, 126) = 1.79 (p = 0.017). The lead times differed according to the reason for consultation (p = 0.045).
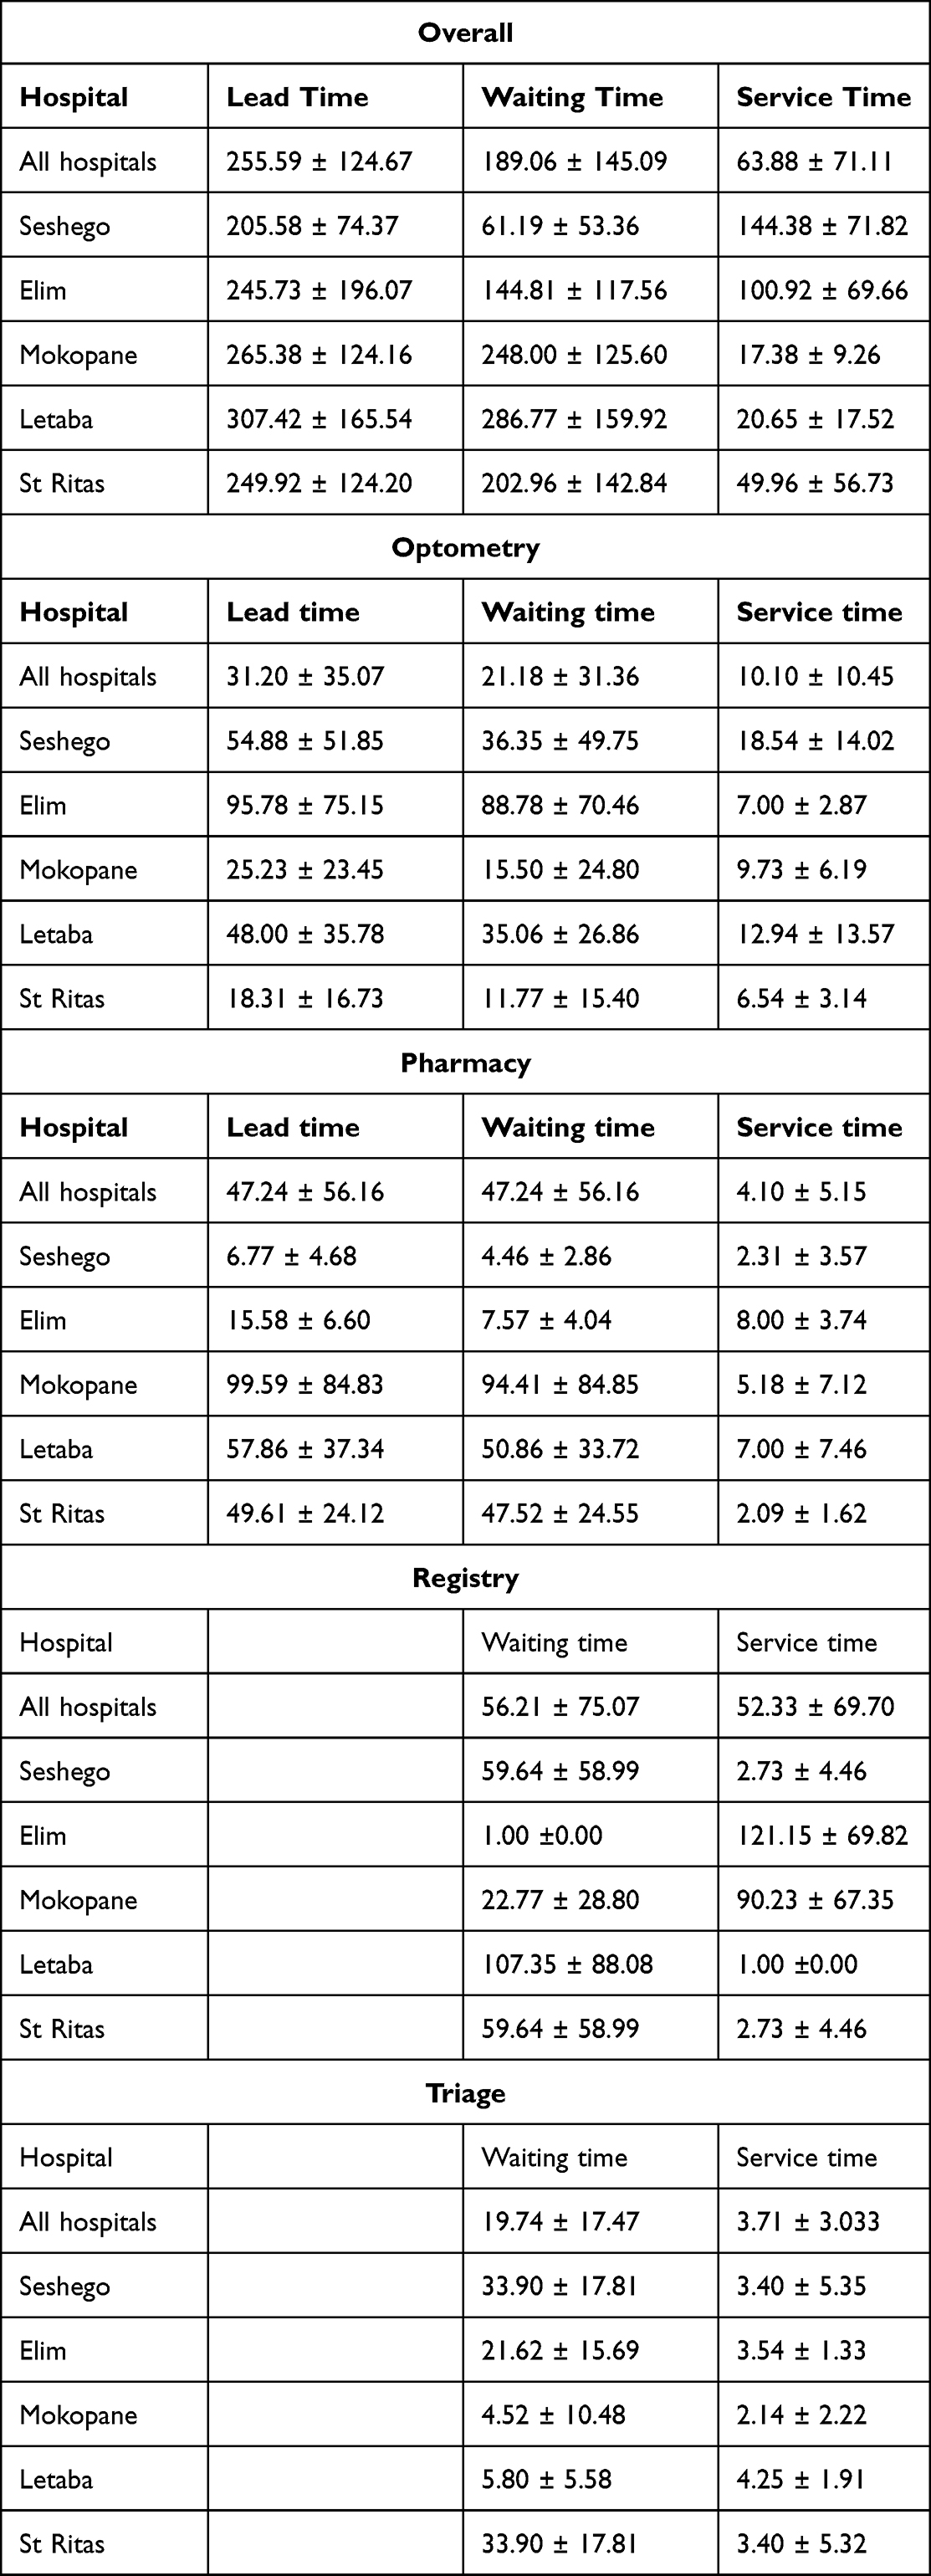 |
Table 2 Waiting Times (Minutes) |
Overall average waiting time (in minutes) of 189.1 ± 145.1 were recorded across the five district hospitals with an average of 286.77 ± 159.92 recorded at Letaba hospital, 248.00 ± 125.60 at Mokopane hospital, 202.96 ± 142.84 at St Ritas hospital, 144.81 ± 117.56 at Elim hospital and 61.19 ± 53.36 at Seshego hospital. The overall waiting time differed between hospitals, F (4, 126) = 13.41 (p < 0.001). The waiting times differed according to the reason for consultation (p = 0.015).
For service times (in minutes), an overall average of 63.9 ± 71.1 across the five district hospitals with an average of 144.38 ± 71.82 at Seshego hospital, 100.92 ± 69.66 at Elim hospital, 49.96 ± 56.73 at St Ritas hospital, 20.65 ± 17.52 at Letaba hospital, and 17.38 ± 9.26 at Mokopane hospital. Service times were different across hospitals F (4, 126) = 28.8 (p < 0.001). The service times differed according to the reason for consultation (p < 0.001).
Optometry Lead Times
As shown in Table 2, on overall patients spent an average of 31.20 ± 35.07 minutes at the optometry section where they waited for 21.18 ± 31.36 minutes and were serviced for 10.10 ± 10.45 minutes. Average waiting time (in minutes) of 88.78 ± 70.5 was recorded at Elim hospital, 36.35 ± 49.8 at Seshego hospital, 35.06 ± 26.86 at Letaba hospital, 15.50 ± 24.80 at Mokopane hospital and 11.77 ± 15.40 at St Ritas hospital. Service time (in minutes) of 18.54 ± 14.02 was recorded at Seshego hospital, 12.94 ± 13.57 at Letaba hospital, 9.73 ± 6.19 at Mokopane hospital, 7.00 ± 2.87 at Elim hospital and 6.54 ± 3.14 at St Ritas hospital. The overall lead times, F (4, 126) = 9.73 (p < 0.001), waiting times, F (4, 126) = 13.65 (p = 0.001) and process time, F (4, 126) = 7.22 (p = 0.0017) were significantly different across the five hospitals. The process times (p < 0.001) further differed based on the type of service offered.
Pharmacy Lead Times
From Table 2, the overall pharmacy unit lead time was 47.24 ± 56.16 minutes with waiting time of 47.24 ± 56.16 minutes and service time of 4.10 ± 5.15 minutes. Waiting time of 94.41 ± 84.85 minutes was recorded at Mokopane hospital, 50.86 ± 33.72 minutes at Letaba hospital, 47.52 ± 24.55 minutes at St Ritas, 7.57 ± 4.04 minutes at Elim hospital and 4.46 ± 2.86 minutes at Seshego hospital. Service time of 8.00 ± 3.74 minutes was recorded at Elim hospital, 7.00 ± 7.46 minutes at Letaba hospital, 5.18 ± 7.12 minutes at Mokopane hospital, 2.31 ± 3.57 minutes at Seshego.
Registry and Triage
Table 2 shows that the overall registry time was 56.21 ± 75.07 minutes waiting time and 52.33 ± 69.70 minutes services time, while in triage, the hospitals’ waiting time was 19.74 ± 17.47 minutes and service time was 3.71 ± 3.03 minutes.
Spectacle Collection Time
Table 3 shows a summary of spectacle waiting time from the five hospitals. The mean for the overall waiting time to receive spectacles was recorded as 121 ± 181.54 days. The average waiting time at Seshego hospital was 271 ± 20 days, 201 ± 211.39 days at Mokopane hospital, 166 ± 185.61 days at Letaba hospital, 29 ± 49.21 days at St. Rita’s, and 1 ± 4.32 days at Elim hospital.
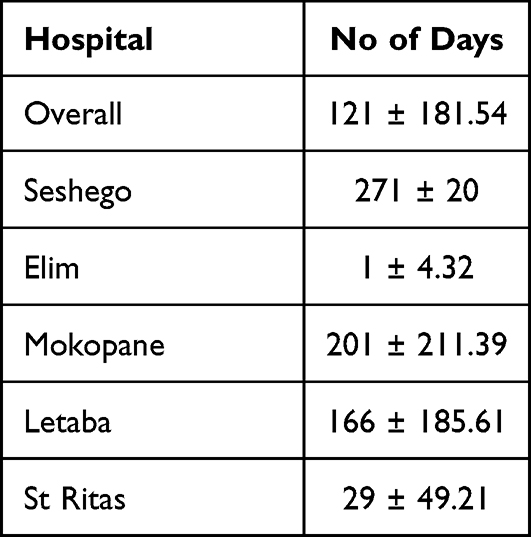 |
Table 3 Spectacle Collection Time |
Time Taken to Get an Ophthalmologist Appointment
The length of time for ophthalmic referrals at Letaba Hospital, Seshego Hospital, and St Ritas Hospital is directly influenced by the type of eye condition. To allow for hospital transportation and logistics, an appointment is scheduled within 48 hours if the patient arrives with an emergency, such as sudden visual loss, trauma, or a rapidly worsening condition. The appointment must be made within two days if the condition is semi-urgent but not an emergency (eg., urgent but stable). Referrals for well-known, treatable illnesses, including steady glaucoma, are planned within seven days. On the other hand, unless there is an emergency, in which case the referral is made right away, referrals at Mokopane Hospital are planned every Tuesday. Elim Hospital handles referrals the same day because they have an on-site ophthalmologist.
HReH, Facilities and Equipment
Table 4 shows that Elim hospital had 5 optometrists while all other hospitals had 3 optometrists each. All hospitals had an ophthalmic nurse except for Seshego hospital. Only Elim hospital had an ophthalmologist. Mokopane hospital had 3 consulting rooms, Elim and Letaba hospital had 2 each, and Seshego and St Ritas hospitals had 1 each. St Ritas, Letaba and Elim hospitals had optical laboratories.
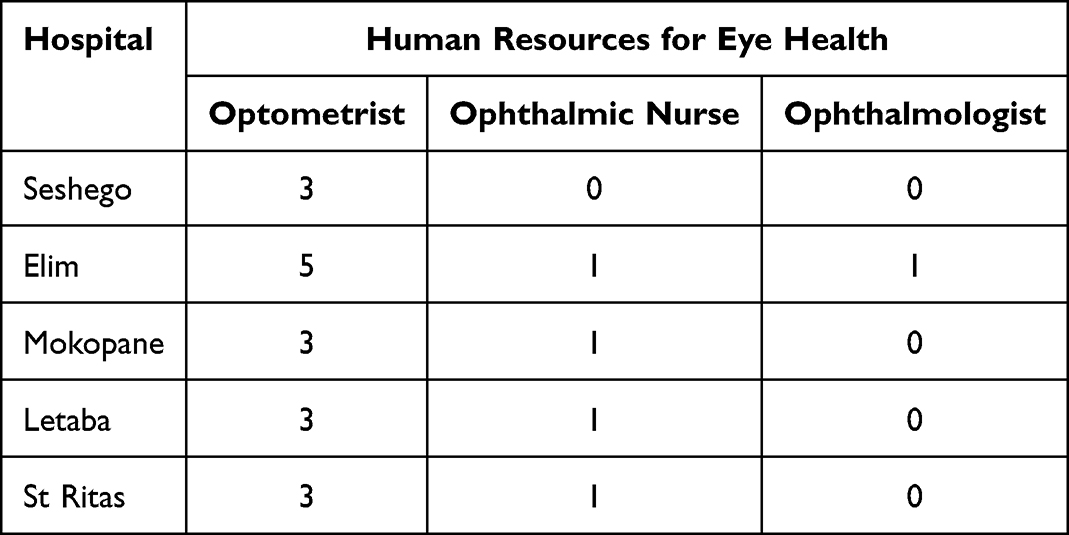 |
Table 4 Human Resources for Eye Health |
As shown in Table 5, there were three adequately equipped consulting rooms at Mokopane hospitals, 2 at Elim and Letaba hospitals and one each at St Ritas and Seshego hospitals. Additionally, Elim hospital had a fundus camera. Mokopane hospital had an arc perimeter, 1 stereoacuity test and 1 polarised glasses.
 |
Table 5 Optometry Equipment |
From Table 6, 60 (46.9%) of participants consulted for cataract management and 14 (10.9%) for glaucoma (see Table 6). Only nine (7.0%) needed refraction, while those with conjunctival and corneal conditions were also nine (7.0%) each.
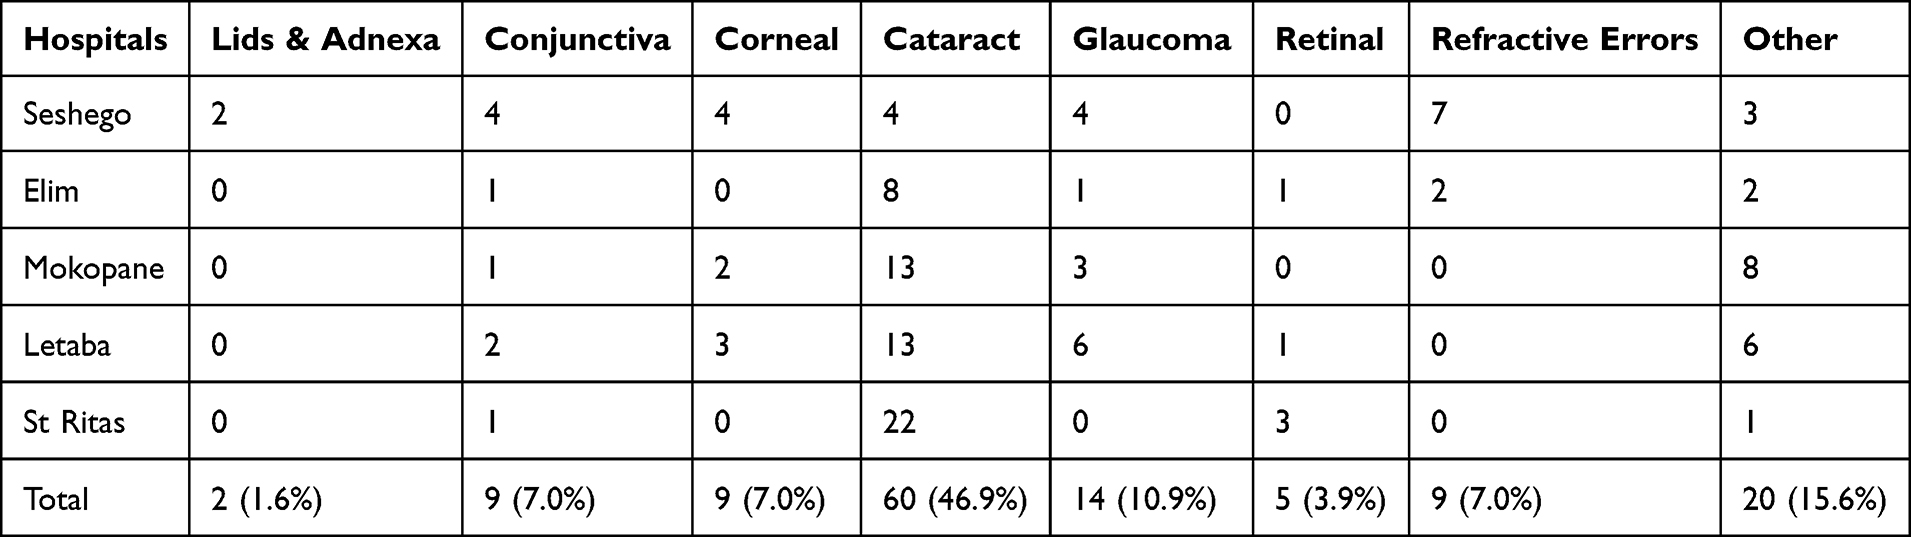 |
Table 6 Common Referred Conditions |
Discussion
The study aimed to evaluate the lead times in optometry services in selected public hospitals within Limpopo Province, South Africa. Some studies have shown that lead times, especially with longer waiting times, may lead to low patient satisfaction rate, poor quality of care, and health outcomes.31,32
Porters transporting patients’ medical records between service points help protect confidentiality and prevent loss, in line with ethical and legal requirements including POPIA and HPCSA guidelines.33 However, this practice may contribute to longer lead and waiting times, as each transfer introduces potential delays, especially in busy hospitals.34,35 Streamlining record transport or using electronic systems could reduce delays while maintaining confidentiality.
The study found an overall average lead time of 255.59 ± 124.67 minutes. This suggested that patients exceeded the recommended lead time by 75 minutes28 at a district hospital. Additionally, a variation (standard deviation) of 124.67 minutes was a concern. Regarding waiting times, patients took 189.06 ± 145.09 minutes which is 69 minutes more than the recommended 120 minutes for a district hospital with a possible 145.09 minutes variation. This waiting time is excessive and substantially exceeded the recommended limits. Timely access to services is a global and a national imperative which further aligns with the Ideal Realisation and Maintenance framework which aim to reduce long delays such as to improve clinical outcomes and increase the satisfaction ratings of patients on the public service.28
Though these times are longer based on the national standards, they however compare better with those in other countries where patients wait for over 2 to 4 hours at the OPD before been examined by a doctor.18 Of most concern was the recorded waiting time of 75 minutes to receive a patient record at registry. Biya et al18 further reported that patients at Jimma University facility in Ethiopia waited for 4.5 hours to see a doctor. Contrary to these findings, Oche and Adamu36 in a Nigerian-based study reported slightly lesser waiting times for OPDs. Longer waiting times have been reported in a number of public health service facilities in South Africa and are said attributed to low resources availability.37,38
According to Dehkordi et al39 and Ogaji et al,40 they have been reported to cause unwarranted negative perceptions about the public health service and further result in fewer follow-up visits. This challenge is further exacerbated by distances to these facilities where some patients especially in rural South Africa initially travel longer distances and back such as to access the service. While this suggests that they arrive longer after the operation times at outpatient departments, they also have to leave the hospital earlier to catch possible mode of transport while it is still available. The likelihood is that some may leave even before they are assisted hence becoming more frustrated, uncomfortable and less satisfied with the service. For some patients, the consequences may also be multiple fold with economic implications where they lose the entire day of work to access a service. Considering that most users of this service are on low-income bracket and are doing low skilled work,41 the consequences are significant.
Patients, who wait for a service for excessive amount of time especially those consulting with symptoms of pain and discomforts, are likely to report the lowest satisfaction rate, quality of life and clinical outcome.42
For the service time, the hospitals were almost compliant with an overlap of about 3 minutes. Only the variation of 71 minutes (standard deviation) which shows gross inconsistency across hospitals may need to be improved.
Overall Optometry Times
Commendable lead times of 31.20 ± 35.07 minutes were reported at the optometry unit which were shorter than the recommended 90 minutes. Though patient satisfaction was not part of this study, patients were more likely to report higher satisfaction ratings with waiting times of 21.18 ± 31.36 minutes which the study found. The findings by far surpass those in an Ethopian study which recorded 30 to 90 minutes waiting time at the optometry unit.18 Though this was inconsistent (p < 0.001) across hospitals ranging from 11.77 ± 15.40 to 88.78 ± 70.46 minutes, it could be attribute to differences in patient arrival times at the hospital, non-standardised service, un-even staff performances, and variations in workflow.38 Examples may exclude that in some hospitals like Elim, patients had to consult the ophthalmic nurse, optometrist and sometimes an ophthalmologist while in Seshego patient only consult with the optometrist only. In addition, patients at Elim hospital waited for their spectacles to be prepared.
Shorter service times of average 10.10 ± 10.45 minutes were recorded for optometry unit. These could firstly be attributed to the efficiency of staff at the unit.43 Of most importance, the type of service could have had a significant effect. Examples include that only 9% of participants required refraction which seems to take longer than other services.44 Almost half (46.9%) of the participants consulted for cataract review which take shorter times and another 10.9% consulted for glaucoma which also take reduced service times.
Overall Pharmacy Times
Lead times of 47.24 ± 56.16 minutes was recorded for the pharmacy unit. This recorded waiting time was longer as compared to similar studies in Malaysia which recorded 23.0 ± 11.00 minutes,45 32 minutes 53 seconds in Indonesia,46 and 38 ± 20 minutes recorded in Namibia.47 The longer waiting times and shorter service times may suggest problems with crowding and administrative processes48 and that these units do not only serve patients from the optometry unit but also serve all other OPD units. Que management, pre-processing prescriptions, automating prescriptions, and increasing staff may be explored to reduce waiting times.
For service times, which the current study recorded 4.10 ± 5.15 minutes, was shorter than the 17.09 minutes recorded in Afolabi & Erhun3 in Nigeria. This is commendable and aligns with the waiting times in institutions that adopted automated system such as the study by Alodan et al49 with an average of 3 minutes.
Overall Registry and Triage Time
In this study, registry processes exhibited substantially longer mean waiting (56.21 ± 75.07 minutes) and service times (52.33 ± 69.70 minutes) compared with triage, which had much shorter mean waiting (19.74 ± 17.47 minutes) and service times (3.71 ± 3.03 minutes). This suggests that administrative functions such as patient registration contribute to notable delays in early patient flow, consistent with studies showing that pre-triage and registration waits can meaningfully extend overall emergency department throughput times.50 In contrast, triage itself is designed to be a rapid clinical prioritization step, and although patients may still wait to be triaged, the active assessment duration is typically brief.51 Minimizing waiting times across both registry and triage is important because prolonged delays can reduce care quality and patient satisfaction and contribute to system inefficiency.
Waiting Period for Spectacles
Patients waited for 121 ± 181.54 days to receive spectacles due to various methods hospitals used to acquire the devices including a tendering system which takes long due to administrative processes. In other instances, the service is outsourced which may also have delays. Where this service was insourced, such as in Elim hospital, patients only waited for a day though this could be longer. This waiting times by far exceeded that reported in the study in KwaZulu-Natal.20 Contrary to the findings in this study, another study in KwaZulu-Natal province52 reported waiting times on six months which is similar to that in Mokopane hospital in this current study. Prolonged waiting times with lack of optical correction for patients with moderate to severe refractive errors increase the risk of injury and reduce the patient quality of life53 such as patient mobility, reading, schooling and work-related tasks. Some patients end up seeking this service from private practitioners hence incurring unwarranted and unaffordable cost.21
Securing a Referral to the Ophthalmologist
A turnaround time of 48 hours were reported across hospitals with alternative for emergency cases been treated immediately. These were commendable and was necessary to accommodate administrative processes. It further suggested an effective referral system. Irrespective of the systematic constraints, waiting times should be kept at minimum. Waiting times of over six months create an ethical dilemma such that spectacles prescriptions need to be renewed as they exceed the six months period.54
Strengths and Limitations of the Study
Lead time is the focus of this study since it is a crucial measure of patient satisfaction. This makes the study pertinent to enhancing the quality of care provided at public hospitals in Limpopo. There is a dearth of published information about optometry lead times, particularly in Limpopo. Thus, the study closes significant information gaps. The findings might not be representative of other provinces and only pertain to specific public hospitals. Furthermore, hospitals could have been included to enhance the validity of the findings.
Recommendations
Lead times currently exceeded targets by an average of 75 minutes, primarily due to registry bottlenecks. To address this, initiatives hospitals may deploy low-cost digital record solutions (eg., MomConnect-style SMS pre-registration), standardize fast-track folders for repeat cataract and glaucoma patients, and pilot these improvements in one hospital to reduce lead times by 30% within three months.
Although triage performance remains strong, waiting times were also 69 minutes above acceptable limits, driven by OPD crowding, rural travel, and drop-off challenges, and pharmacy queues. To improve flow, hospitals may introduce initiatives such as color-coded triage bands (red = immediate pain/urgent, green = routine), proven effective in minimizing over-triage and enhancing district hospital results.28 Inconsistent workflows, staffing shortages, an uneven mix of services, pharmacy congestion, and limited resources also cause ongoing delays. Although optometry consultations are relatively efficient (average 31 minutes), patients currently wait for an average of 121 days for spectacles. To tackle these issues, rolling out a standardized protocol across the province, allowing a single optometrist to manage straightforward cases independently, providing quarterly training on staff time tracking and workflow efficiency, opening dedicated afternoon refraction slots to increase service capacity, and carrying out monthly audits of patient arrival patterns so that rural appointments can be better staggered and crowding reduced.55
Conclusion
The purpose of this study was to assess lead times and wait times for optometry services in specific hospitals in the South African province of Limpopo, to determine the variables causing these delays, and to create evidence-based reform measures. The results show that waiting times for eye appointments and lead times for optometry services both surpass predetermined goals, indicating systemic bottlenecks in patient flow, administrative procedures, and resource distribution. The project has produced focused, evidence-based initiatives intended to increase operational effectiveness, improve patient experience, and decrease service delays by methodically evaluating these delays and their underlying causes. Tactics include staff workflow optimization, streamlined clinical pathways, structured triage systems, digital pre-registration, and data-driven scheduling enhancements, offer healthcare facilities a workable road map for reducing waiting times, improving care quality, and better serving patients. Future studies may focus on application of these tactics in optometry service to investigate their effectiveness in reducing waiting times.
Disclosure
The authors report no conflicts of interest in this work.
References
1. World Health Organization. World Health Organisation, “World report on vision,” 2019. World Health Organisation. 2019 [Cited February 24, 2026];214(14):180. Available from: https://iris.who.int/bitstream/handle/10665/328717/9789241516570-eng.pdf?sequence=18.
2. Du Toit R, Faal HB, Etya’Ale D, et al. Evidence for integrating eye health into primary health care in Africa: a health systems strengthening approach. BMC Health Serv Res. 2013;13(1). PMID: 23506686. doi:10.1186/1472-6963-13-102
3. Afolabi MO, Erhun WO. Patients\’ response to waiting time in an out-patient pharmacy in Nigeria. Tropical J Pharmaceut Res. 2005;2(2). doi:10.4314/TJPR.V2I2.14601
4. Huang-Lung J, Rai A, Duong A, et al. ‘Whatever the GP says, is what I’ll do’—A qualitative study of patient perspectives in accessing primary eye care for type 2 diabetes. Ophthalmic Physiol Optics. 2024;45(1):67. PMID: 39365256. doi:10.1111/OPO.13398
5. Limiri D. The impact of long wait times on patient health outcomes: the growing NHS crisis. Premier J Public Health. 2025. doi:10.70389/PJPH.100020
6. Burgos-Blasco B, Vidal-Villegas B, Yap TE, et al. Effects of COVID-19 pandemic on glaucoma appointment scheduling in a tertiary hospital in London, UK. Eur J Ophthalmol. 2024;34(1):204–14. PMID: 37097882. doi:10.1177/11206721231171704
7. Liu H, Chen C, Chen Z, Li Q, Li Q, Liu W. Factors associated with delayed first ophthalmological consultation for primary glaucoma: a qualitative interview study. Front Med. 2023;10. doi:10.3389/fmed.2023.1161980
8. Malaysia P. Lens-induced glaucoma, a collateral damage during COVID-19 Pandemic. Med Health. 2023;18(1):255–262. doi:10.17576/mh.2023.1801.24
9. Shakya R, Ahlawat R, Ahluwalia NS, Kuyyadiyil S, Jain B, Shah C. Reasons for delayed presentation for cataract surgery in patients of lens induced glaucoma–a questionnaire-based study at a tertiary eye care centre of central rural India. Ophthalmic Epidemiol. 2022;29(6):656–661. PMID: 34781811. doi:10.1080/09286586.2021.2002914
10. McMullen MJ, Netland PA. Lead time for appointment and the no-show rate in an ophthalmology clinic. Clin Ophthalmol. 2015;9:513–516. doi:10.2147/OPTH.S82151
11. Chiam M, Kunselman AR, Chen MC. Characteristics associated with new patient appointment no-shows at an academic ophthalmology department in the United States. Am J Ophthalmol. 2021;229:210–219. PMID: 33626367. doi:10.1016/j.ajo.2021.02.020
12. Lot LT, Sarantopoulos A, Min LL, Perales SR, de Boin IFSF, de Ataide EC. Using Lean tools to reduce patient waiting time. Leadership Health Services. 2018;31(3):343–351. PMID: 30016918. doi:10.1108/LHS-03-2018-0016
13. Popovic MM, Hurst M, Diemert LM, et al. A retrospective population-based analysis of wait times for cataract surgery in Ontario, Canada. CMAJ Open. 2023;11(2):E329–35. doi:10.9778/cmajo.20220035
14. Waterworth CJ, Marella M, O’Donovan J, Bright T, Dowell R, Bhutta MF. Barriers to access to ear and hearing care services in low- and middle- income countries: a scoping review. Glob Public Health. 2022;17(12):3869–3893. PMID: 35319345. doi:10.1080/17441692.2022.2053734
15. Dawkins B, Renwick C, Ensor T, Shinkins B, Jayne D, Meads D. What factors affect patients’ ability to access healthcare? An overview of systematic reviews. Tropical Med Int Health. 2021;26(10):1177–1188. PMID: 34219346. doi:10.1111/tmi.13651
16. OECD. Waiting times for health services: next in line. OECD Health Policy Studies. 2020. doi:10.1787/242E3C8C-EN
17. Olokoba LB, Durowade KA, Adepoju FG, Olokoba AB. Assessment of patients waiting and service times in the ophthalmology clinic of a public tertiary hospital in Nigeria. Ghana Med J. 2020;54(4):231–237. PMID: 33883771. doi:10.4314/GMJ.V54I4.5
18. Biya M, Gezahagn M, Birhanu B, Yitbarek K, Getachew N, Beyene W. Waiting time and its associated factors in patients presenting to outpatient departments at Public Hospitals of Jimma Zone, Southwest Ethiopia. BMC Health Serv Res. 2022;22(1):1–8. PMID: 35078474. doi:10.1186/S12913-022-07502-8/TABLES/4
19. Meshesha BR, Sibhatu MK, Beshir HM, et al. Access to surgical care in Ethiopia: a cross-sectional retrospective data review. BMC Health Serv Res. 2022;22(1):973. PMID: 35907955. doi:10.1186/S12913-022-08357-9/TABLES/8
20. Buthelezi LM, Van Staden D. Integrating eye health into policy: evidence for health systems strengthening in KwaZulu-Natal. African Vision Eye Health. 2020;79(1):1–10. doi:10.4102/AVEH.V79I1.549
21. Nkoana PMW, Mashige KP, Moodley VR. Strengthening keratoconus management systems in South African public sector facilities. African Vision Eye Health. 2024;83(1):1–11. doi:10.4102/AVEH.V83I1.832
22. Nkoana PMW, Moodley VR, Mashige KP. Keratoconic patient profile and management at public sector facilities in South Africa. African Vision Eye Health. 2023;82(1). doi:10.4102/AVEH.V82I1.780
23. CoGTA. CoGTA AR 17 11 20 16H40.cdr | enhanced reader. 2020.
24. Levy P, Lemeshow S. Sampling of populations: methods and applications. 2013 [Cited February 24, 2026]. Available from: https://books.google.co.za/books?hl=en&lr=&id=XU9ZmLe5k1IC&oi=fnd&pg=PA5&dq=(+Levy+and+Lemeshow,+2013).&ots=odcSC7RyXr&sig=OJQxtwjL7zHNdPUImgSishWtmVg.
25. Department of health. IDEAL HOSPITAL REALISATION AND MAINTENANCE FRAMEWORK MANUAL 2018 Draft (next version end Oct). 2018.
26. Etikan I. Comparison of convenience sampling and purposive sampling. Am J Theoret Appl Statis. 2016;5(1):1. doi:10.11648/J.AJTAS.20160501.11
27. Kadam P, Bhalerao S. Sample size calculation. Int J Ayurveda Res. 2010;1(1):55. PMID: 20532100. doi:10.4103/0974-7788.59946
28. Department of Health. National guideline on management of patient waiting time in clinics, community health centers and outpatients departments of public hospitals of South Africa; 2023.
29. Zou M, Ramjan L, Thompson K, Kabil G. Facilitators and barriers to triage efficiency in adult emergency departments: an integrative literature review. Australas Emerg Care. 2025. doi:10.1016/j.auec.2025.09.006
30. Chen X, Wu M, Yu C, et al. Slowing myopia progression with cylindrical annular refractive elements (CARE) spectacle lenses—Year 1 results from a 2-year prospective, multi-centre trial. Acta Ophthalmol. 2025;103(8):929–938. doi:10.1111/aos.16795
31. Elemoah D, Abeasi DA, Agyei FB, Sasemame ES, Akumiah PO. The waiting game: determinants and effects of OPD service delays in a Tertiary Health Facility. BMC Health Serv Res. 2025;25(1):1545. PMID: 41299405. doi:10.1186/S12913-025-13594-9/TABLES/5
32. Mbwogge M, Astbury N, Nkumbe HE, Bunce C, Bascaran C. Waiting time and patient satisfaction in a subspecialty eye hospital using a mobile data collection kit: pre-post quality improvement intervention. JMIRx Med. 2022;3(3):e34263. PMID: 37725529. doi:10.2196/34263
33. Department of Health. National standard operating procedure for filing archiving and disposal of patient records | department of health knowledge hub. Available from: https://knowledgehub.health.gov.za/elibrary/national-standard-operating-procedure-filing-archiving-and-disposal-patient-records.
34. Kwak JK. Analysis of the waiting time in clinic registration of patients with appointments and random walk-ins. Int J Envir Res Public Health. 2023;20(3):2635. PMID: 36767998. doi:10.3390/ijerph20032635
35. Hasibuan R. Hospital outpatient waiting time and patient satisfaction: an observational comparative study. Soc Med. 2025;18(2):141–152. doi:10.71164/socialmedicine.v18i2.2025.1611
36. Oche M, Adamu H. Determinants of patient waiting time in the general outpatient department of a tertiary health institution in North Western Nigeria. Ann Med Health Sci Res. 2013;3(4):588. PMID: 24380014. doi:10.4103/2141-9248.122123
37. Malematja DN, Nkosi EM, Nene SE. The impact of insufficient resources on the quality-of-service delivery at a primary healthcare clinic in Limpopo. Curationis. 2025;48(1):2696. PMID: 40336378. doi:10.4102/CURATIONIS.V48I1.2696
38. Nwagbara UI, Hlongwana KW, Chima SC. Mapping evidence on the factors contributing to long waiting times and interventions to reduce waiting times within primary health care facilities in South Africa: a scoping review. PLoS One. 2024;19(8):e0299253. PMID: 39167615. doi:10.1371/JOURNAL.PONE.0299253
39. Dehkordi FG, Torabizadeh C, Rakhshan M, Vizeshfar F. Barriers to ethical treatment of patients in clinical environments: a systematic narrative review. Health Sci Rep. 2024;7(5):e2008. PMID: 38698790. doi:10.1002/HSR2.2008
40. Ogaji DS, Mezie-Okoye MM. Waiting time and patient satisfaction: survey of patients seeking care at the general outpatient clinic of the University of Port Harcourt Teaching Hospital. Port Harcourt Med J. 2017;11(3):148–155. doi:10.60787/PHMJ.V11I3.133
41. Ntsoane MD, Oduntan OA. A review of factors influencing the utilization ofeye care services. African Vision Eye Health. 2010;69(4):182–192. doi:10.4102/AVEH.V69I4.143
42. Chan J, Poon S, Lawrence-Jones A, et al. Patient experiences of waiting for orthopaedic care and priorities for ‘waiting well’: a qualitative study in a London NHS trust. Archiv Public Health. 2025;83(1):95. PMID: 40197335. doi:10.1186/S13690-025-01578-4
43. Thandrayen K, Saloojee H. Appendix H Quality of care offered to children attending primary health care clinics in Johannesburg.South African J Child Health. 2010;4(3):73–77.
44. Carpena-Torres C, Batres L, Serramito M, Carracedo G. Repeatability of subjective refraction in different age groups. Photonics. 2024;11(7):634. doi:10.3390/PHOTONICS11070634
45. Fahrurazi FE, Ibrahim NH, Mafauzy NM, Wan Ismail WNA, Mohamed Rusli SS. Factors affecting waiting time in Outpatient Pharmacy at Hospital Raja Perempuan Zainab II (HRPZ II). J Pharmacy. 2022;2(1):1–7. doi:10.31436/JOP.V2I1.105
46. Ika Christianti I, Yusri E. Issue: 6. Int J Res Rev. 2025;12(6). doi:10.52403/ijrr.20250680
47. Magesa E, Hanyanya J, Erraso W. Patient’s satisfaction at outpatient pharmacy department in Intermediate Hospital Oshakati, Oshana region, Namibia. GSC Biol Pharmaceut Sci. 2021;14(2). doi:10.30574/GSCBPS.2021.14.2.0040
48. Xie Z, Or C. Associations between waiting times, service times, and patient satisfaction in an endocrinology outpatient department: a time study and questionnaire survey. Inquiry. 2017;54:0046958017739527. PMID: 29161947. doi:10.1177/0046958017739527
49. Alodan A, Alalshaikh G, Alqasabi H, Alomran S, Abdelhadi A, Alkhayyal B. Studying the efficiency of waiting time in outpatient pharmacy. MethodsX. 2020;7:100913. PMID: 32461924. doi:10.1016/J.MEX.2020.100913
50. Betz M, Stempien J, Trevidi S, Bryce R. A determination of emergency department pre-triage times in patients not arriving by ambulance compared to widely used guideline recommendations. Canadian J Emerg Med. 2017;19(4):265–270. PMID: 27917744. doi:10.1017/CEM.2016.398
51. Yuzeng S, Hui LL. Improving the wait time to triage at the emergency department. BMJ Open Qual. 2020;9(1):e000708. PMID: 32019749. doi:10.1136/BMJOQ-2019-000708
52. Mosololi R, Sukati V, Nkoana P. Availability of eye care services and management strategies for ocular conditions in the uMgungundlovu District, KwaZulu-Natal. Clin Optom. 2025;17:383–397. doi:10.2147/OPTO.S543461
53. Dai M, Ouyang Y. Global, regional, and national burden of refraction disorders: findings from the global burden of disease study 2021 and projections to 2050. BMC Public Health. 2025;25(1):1247. PMID: 40175971. doi:10.1186/S12889-025-22440-W
54. HPCSA. BOARD NOTICE 98 OF 2020. 2020 [Cited December 7, 2025]. Available from: www.gpwonline.co.za.
55. Maake ME, Moodley VR. An evaluation of the public sector optometric service provided within the health districts in KwaZulu-Natal, South Africa. African Vision Eye Health. 2018;77(1). doi:10.4102/AVEH.V77I1.407
 © 2026 The Author(s). This work is published and licensed by Dove Medical Press Limited. The
full terms of this license are available at https://www.dovepress.com/terms
and incorporate the Creative Commons Attribution
- Non Commercial (unported, 4.0) License.
By accessing the work you hereby accept the Terms. Non-commercial uses of the work are permitted
without any further permission from Dove Medical Press Limited, provided the work is properly
attributed. For permission for commercial use of this work, please see paragraphs 4.2 and 5 of our Terms.
© 2026 The Author(s). This work is published and licensed by Dove Medical Press Limited. The
full terms of this license are available at https://www.dovepress.com/terms
and incorporate the Creative Commons Attribution
- Non Commercial (unported, 4.0) License.
By accessing the work you hereby accept the Terms. Non-commercial uses of the work are permitted
without any further permission from Dove Medical Press Limited, provided the work is properly
attributed. For permission for commercial use of this work, please see paragraphs 4.2 and 5 of our Terms.