Back to Journals » Clinical Ophthalmology » Volume 13
Large-scale assessment of needs in low vision individuals using the Aira assistive technology
Authors Nguyen BJ, Chen WS, Chen AJ, Utt A, Hill E, Apgar R, Chao DL
Received 14 May 2019
Accepted for publication 29 July 2019
Published 20 September 2019 Volume 2019:13 Pages 1853—1868
DOI https://doi.org/10.2147/OPTH.S215658
Checked for plagiarism Yes
Review by Single anonymous peer review
Peer reviewer comments 2
Editor who approved publication: Dr Scott Fraser
Brian J Nguyen,1,2 William S Chen,3 Allison J Chen,1 Andrew Utt,4 Emily Hill,4 Ryan Apgar,5 Daniel L Chao1,2
1Shiley Eye Institute, University of California San Diego, La Jolla, CA, USA; 2University of California San Diego, School of Medicine, La Jolla, CA, USA; 3Yale School of Medicine, New Haven, CT, USA; 4Aira Tech Corp, La Jolla, CA, USA; 5University of New England, College of Osteopathic Medicine, Biddeford, ME, USA
Correspondence: Daniel L Chao
Shiley Eye Institute, University of California San Diego, 9415 Campus Point Drive, La Jolla, CA 92093, USA
Tel +1 858 534 6290
Fax +1 619 543 1975
Email [email protected]
Purpose: To systematically evaluate the needs of low vision individuals through call data obtained through the Aira assistive technology system.
Patients and methods: Aira (Aira Tech Corporation, La Jolla, CA, USA) is an on-demand assistive wearable technology designed for individuals with low vision. The user wears glasses with an integrated front-facing video camera that connects with a remote human agent who assists the user with the specified task. Call types, temporal characteristics, and duration of call were compared by gender and vision status (low vision, light perception, and blind). Chi-square tests, t-tests, ANOVA, linear regression and Poisson regression analyses were performed.
Results: 878 subscribers placed 10,022 total calls (4759 female, 5263 male) over 3 months. The most common categories were reading (35%), navigation (33%), and home management (16%). The distribution of categories (χ2=49.3, p<0.001), duration (t=−7.59, p<0.0001) and time of call (χ2=37.4, p<0.001) differed by gender. The distribution of categories (χ2=61, p<0.001), duration (F=13.7, p<0.0001), and time of call (χ2=36.9, p<0.001) differed by vision status. Blind [adjusted IRR=1.68 (95% CI: 1.56–1.79)] and light perception users [adjusted IRR=1.43 (95% CI: 1.32–1.53)] had increased usage compared to low vision users. Women had higher usage than men [adjusted IRR=1.09 (95% CI: 1.04–1.13)].
Conclusion: To our knowledge, this is the first large-scale needs assessment of 878 low vision individuals over 10,022 calls. The most common categories were reading, navigation, and home management. Distribution of call types, duration, and time of call differed significantly by gender and vision status. Blind and light perception users had higher usage rates than those with low vision. Women had higher usage rates than men. This large-scale needs analysis of low vision individuals provides insight into utilization patterns across varying levels of vision loss and gender, which will guide future evolutions of assistive technology by tailoring future hardware and software upgrades.
Keywords: wearable technology, low vision, assistive technology, device design
Introduction
Low vision and irreversible blindness are disabling conditions with multiple etiologies including acquired pathologic processes such as chronic diabetic retinopathy, trauma, glaucoma, and retinal detachment as well as congenital disorders such as Leber congenital amaurosis, and retinitis pigmentosa. Visual disability affects over 250 million people worldwide with 36 million completely blind, resulting in extensive social, economic, and psychological deficits.1 In the United States, visual disability is one of ten leading reported disabilities of adults aged 18 and older.2 With current population trends moving towards a more geriatric distribution and the continued high presence of chronic diseases affecting vision including diabetes, prevalence of disabling ophthalmologic disease is estimated to double by 2050.3 The economic burden for visual impairment in the United States for those aged 40 and older is estimated at 35 billion dollars with 8 billion from productivity losses.4
In irreversible severe visual impairment, a variety of low vision assistive aids are available including guide dogs, white canes, Braille, and digital magnifiers to improve daily function. These aids have a high specificity in the tasks they are able to participate in – for example, white canes are designed for navigation but are unable to provide assistance in reading, a domain governed by Braille and digital magnifiers. While a number of tools are available for low vision individuals, our understanding of the needs of this patient population is still poorly understood. For instance, there has been no systematic analysis of the needs of these low vision individuals. In addition, whether demographic characteristics such as gender or the degree of vision loss (hand motions, light perception, no light perception) affect the needs of low vision individuals is unknown. Such data could serve to better direct the development of future low vision aids as well as public health policies to aid this large cohort of individuals.
Aira (https://aira.io/, Aira Tech Corporation, La Jolla, CA) is an on-demand assistive wearable technology designed for the severely visually impaired.5 Serving as an “augmented reality” conduit for those with severe vision impairment, the user wears glasses with a video camera mounted that, when activated, livestreams to an “agent” who assists the user in the specified task without any predetermined specificity. The agent’s module consists of both the livestream and applications such as maps that provide further real-time tracking (Figure 1). Once the call is placed, the user demographics, nature of call, and call characteristics are recorded in internal Aira records.
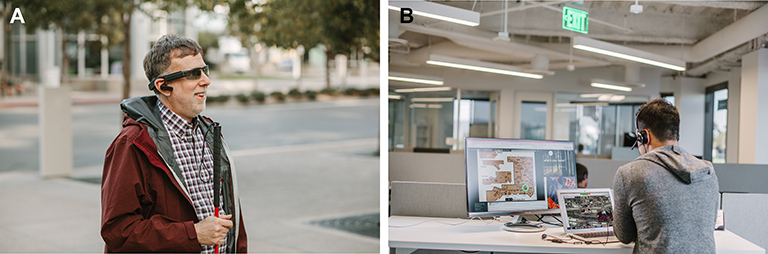 |
Figure 1 (A) A low vision person using Aira to connect to an (B) agent who is using a software dashboard comprised of the wearable device’s live video stream, as well as additional applications that assist with task coordination. |
In this study, we utilize call data from the Aira system to systematically analyze the needs of low vision individuals. Because this system is complementary to the patient’s current low vision aids (e.g., guide dogs, canes, etc.), this study provides real-world data and valuable insight into needs that are not being addressed with current low vision aids. As Aira is a subscription-based assistive technology, the population in this study may not reflect the low vision population as a whole due to financial limitations, technologic literacy, and satisfaction with current visual aids. As there have been no studies to date examining the types of assistance that those with low vision require, especially when categorized by demographic information such as gender and vision status, the purpose of this retrospective cross-sectional study is to evaluate the content and characteristics of calls by low vision individuals using the Aira system.
Methods
Patients
Individuals, also termed Aira “explorers,” who purchased a subscription to the Aira system who placed calls from October 1, 2017 to December 31, 2017 were included. The inclusion criteria were: a) vision impairment defined as visual acuity of better eye <20/200 and b) age 18 and older. Demographic data including gender, current assistive devices, etc., were self-reported on initial intake. This HIPAA compliant study was approved by the University of California, San Diego Institutional Review Board and was conducted in accordance with the principles of the Declaration of Helsinki. Due to the retrospective nature of this study, the Institutional Review Board did not require all participants to provide written informed consent. All individuals depicted in images provided written informed consent for the image to be published.
Categorization
Patients were categorized dichotomously by gender and trichotomously by self-reported visual acuity of the better eye: low vision, light perception, and blind. Temporal call characteristics were recorded including duration of the call, time of day, and day of week.
Duration of call was grouped into short (<3 mins), medium (3–9 mins), and long (>9 mins) categories in descriptive analysis. Time of day was categorized into morning (3:00AM-11:59AM PDT), afternoon (12:00PM-4:59PM PDT), and evening (5:00PM-12:00AM PDT). Calls were grouped into the following 9 categories: reading, navigation, home management, social, shopping, instructions, employment assistance, the arts, and family. Calls were categorized by the agent who answered the call. There was an opportunity to include a secondary category, but agents were not required to fill this section. Definitions were as follows:
Reading: reading non-accessible items, identifying Medicare card numbers.
Navigation: traveling from point A to B indoors or outdoors, locating which train to board in the absence of signs.
Home management: cleaning, organizing closets, sorting through food expiration dates.
Social: meeting with friends, looking for people, weddings, etc.
Shopping: looking for items in a store, color or size identification, paying for items or checkout process, etc.
Instructions: cooking with directions, homework with instructions, furniture assembly.
Employment assistance: reading non-accessible slide presentations, assistance during meetings and speaker engagements.
The Arts: description of movies, theatre, museums, art events, etc.
Family: checking on kids at playground, finding parents at nursing home.
Statistical Analysis
Descriptive statistics, such as frequencies and percentages, were used to describe the call categories, duration of time, and time of day and week by both gender and vision status. Call characteristics were evaluated using 2-sided t-tests for continuous variables and chi-square tests for categorical variables. For continuous variables that were grouped into categories for analyses (e.g., duration of time), t-tests (for gender comparison) and one-way ANOVA (for vision status comparison) were performed for the original continuous variable and chi-square tests were performed for their grouped categories. Post-hoc pairwise comparisons of mean duration of call time by vision status were performed with Tukey HSD correction for multiple pairwise comparisons. Linear regression modeling was utilized to assess duration by gender, vision level, and category. Poisson regression was used to estimate Aira usage rates by gender and vision status. Statistical tests were performed using Stata SE (StataCorp, College Station, TX).
Results
Patient Demographics and Call Categorization
Over the 3-month period, a total of 10,022 calls were placed by 878 subscribers and recorded. Current assistive devices used by these subscribers were recorded: white cane (64%), guide dog (21%), both white cane and guide dog (13%), other device (1%), and none (2%). Calls by women comprised 48% (n=4759) of calls, and calls by men comprised 53% (n=5263). Calls by blind, light perception, and low vision users comprised 59%, 29%, and 12%, respectively. Navigation calls were made both outdoors (60.7%) and indoors (39.3%). Rates of task completion as defined by the user ranged from 73.0% (employment assistance) to 91.7% (reading) (Figure 2) without a difference in rates of task completion (χ2=250.7632, p<0.0001).
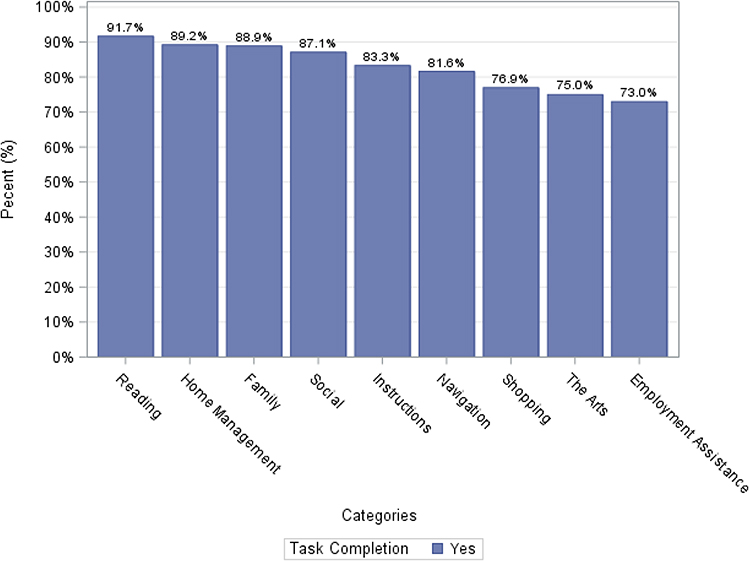 |
Figure 2 Distribution of categories by task success rate. |
Distribution of call categories differed between women and men
The distribution of call categories differed by gender (χ2=49.3, p<0.001; Figure 3). The top 3 categories for women were reading (35%), navigation (31%), and home management (17%). The top 3 categories for men were navigation (35%), reading (35%), and home management (16%). The lowest category was family (0.2%) for both women and men. Among all of the call categories, the percentage of navigation (31% vs 35%, p<0.0001), social (7.6% vs 5.7%, p=0.0002), shopping (6.4% vs 5.1%, p=0.0052), and the arts (0.5% vs 0.2%, p=0.0052), are significantly different between women and men.
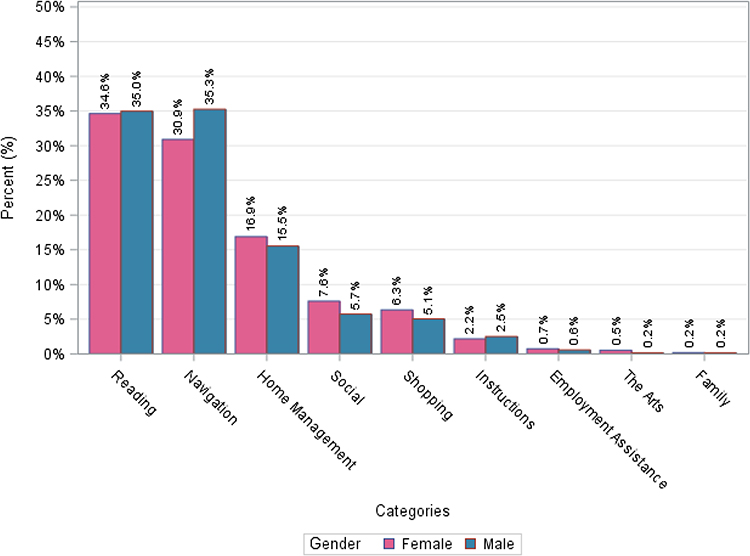 |
Figure 3 Distribution of call categories by gender. |
Duration of calls differed between women and men
Duration of calls differed by gender: calls by women were on average 10 mins and 18 s long (SD 11 mins 41 s) whereas those by men averaged 8 mins 40 s (SD 9 mins 54 s) (t=−7.59, p<0.001). The distribution of grouped time duration categories (short, medium, long) also differed by gender (χ2=37.4, p<0.001; Figure 4).
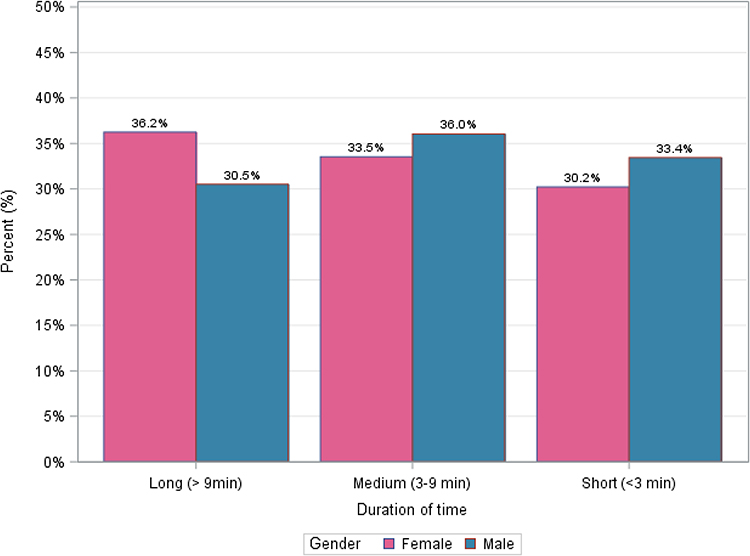 |
Figure 4 Call duration by gender. |
Time of day, but not day of week, differed between women and men
Calls by men and women occurred most in the morning and least in the evening with slightly different distributions (χ2=8.49, p=0.039; Figure 5). Calls by men and women occurred most during the weekday and did not differ in distribution between weekday versus weekend (χ2=0.82, p=0.367; Figure 6).
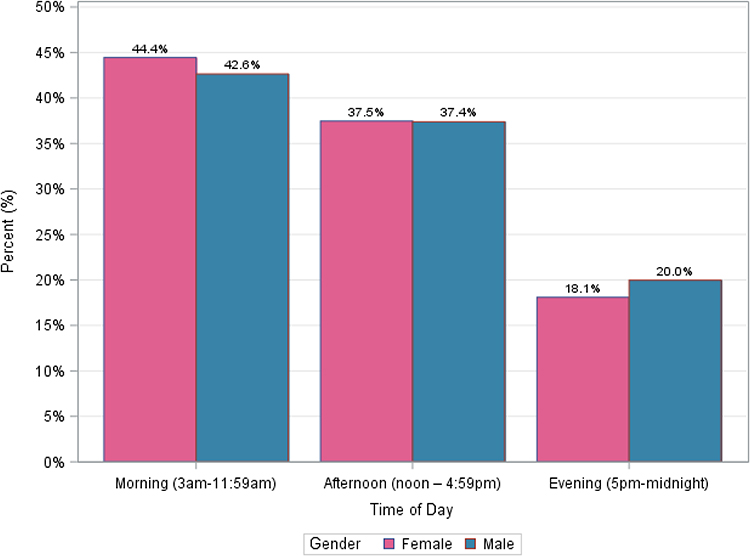 |
Figure 5 Call time of day by gender. |
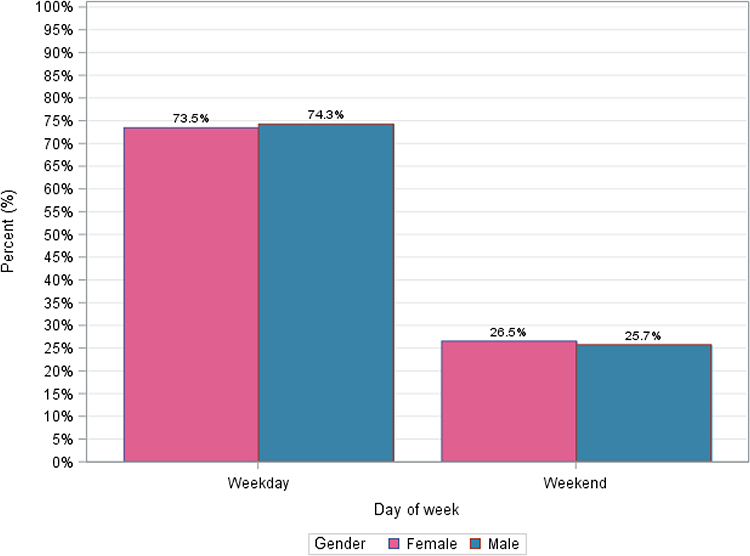 |
Figure 6 Call day of week by gender. |
Distribution of call categories differed by vision status
The distribution of call categories differed by vision status (χ2=61, p<0.001; Figure 7). The top 3 categories for calls by blind users were navigation (35%), reading (34%), and home management (16%). The top 3 categories for calls by light perception users were reading (35%), navigation (33%), and home management (16%). The top 3 categories for calls by low vision users were reading (41%), navigation (26%), and home management (15%). The lowest category was family (0.2%) for all three groups (ranged from 0.1% to 0.2%). Among all of the call categories, the percentage of reading (p<0.0001), navigation (p<0.0001), shopping (p=0.0012), and instructions (p=0.022), are significantly different among these three groups.
 |
Figure 7 Distribution of call categories by vision status. |
Duration of calls differed between each vision status
Duration of calls differed by vision status (F=13.7, p<0.0001; Figure 8). The mean duration of calls by blind, light perception, and low vision users were 9 mins 44 s (SD 11 mins 3 s), 9 mins 7 s (SD 10 mins 24 s), and 8 mins 1 s (SD 9 mins 48 s), respectively. Post-hoc pairwise comparisons of mean call duration with Tukey HSD correction for multiple pairwise comparisons revealed that each pair of vision levels revealed significant differences in mean time duration: calls by blind users were longer than those by both light perception users (p=0.028) and low vision users (p<0.001), and calls by light perception users were longer than those by low vision users (p=0.009).
 |
Figure 8 Call duration by vision level. |
Time of day, but not day of week, differed between vision levels
The distribution of time of day usage (i.e., morning, afternoon, evening) differed by users with different vision statuses (χ2=36.9, p<0.001; Figure 9). Calls by blind and light perception users occurred most in the morning and least in the evening whereas calls by low vision users occurred most in the afternoon and least in the evening. Calls by all three vision statuses occurred most during the weekday and did not differ in distribution between weekday and weekend (χ2=3.7, p=0.16; Figure 10).
 |
Figure 9 Call time of day by vision level. |
 |
Figure 10 Call day of week by vision level. |
Women and blind users had higher usage rates and duration within their respective categories
Women users placed more calls than men: the number of calls by women and men by vision category are illustrated in Tables 1–3 and Figures 11–13. The median number of calls is 10 for women and 9 for men. The maximum number of calls is 161 for women and 246 for men (Table 1, Figure 11). For vision status, the median number of calls for blind, light perception and low vision are 10, 8, and 6, respectively (Table 2, Figure 12). The maximum number of calls for blind, light perception and low vision are 246, 119, and 64, respectively (Table 2, Figure 12). Poisson regression to estimate usage rates by gender and vision status demonstrated that women users had significantly higher usage rates than men [adjusted incident rate ratio: 1.09 (95% CI: 1.04–1.13)], and that blind users [adjusted IRR: 1.68 (95% CI: 1.56–1.79)] and light perception users [adjusted IRR: 1.43 (95% CI: 1.32–1.53)] had significantly higher usage rates compared to low vision users (Table 4). When adjusted for each strata of vision level and gender, a multiple linear regression model for duration yielded the greatest effect size by female callers (parameter estimate [PE]=110.08, p<0.0001). Of the vision categories, blind users had the greatest effect (PE=−45.67, p=0.0163). Low vision users had the most negative effect on call duration (PE=−152.40, p<0.0001).
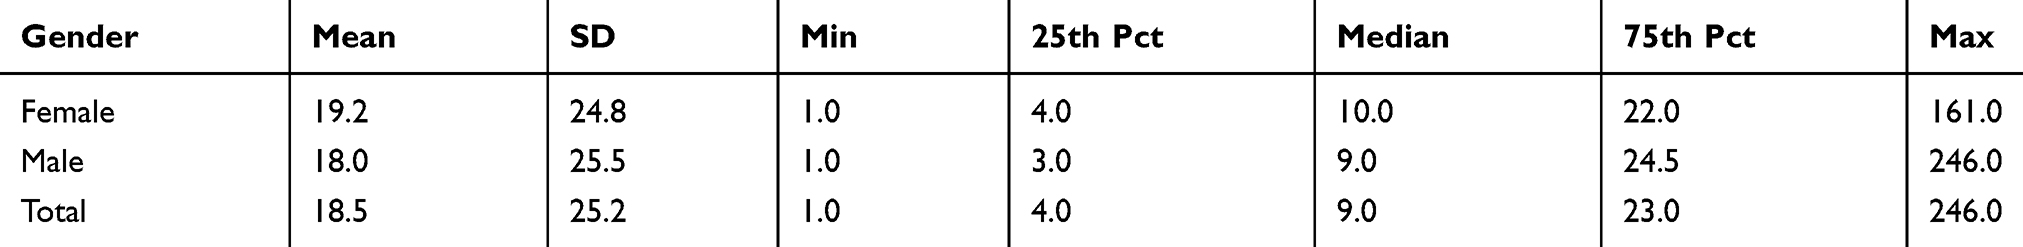 |
Table 1 Number of calls by gender |
 |
Table 2 Number of calls by vision status |
 |
Table 3 Number of calls by gender and vision status |
 |
Table 4 Poisson regression to estimate the usage rates by gender and vision status |
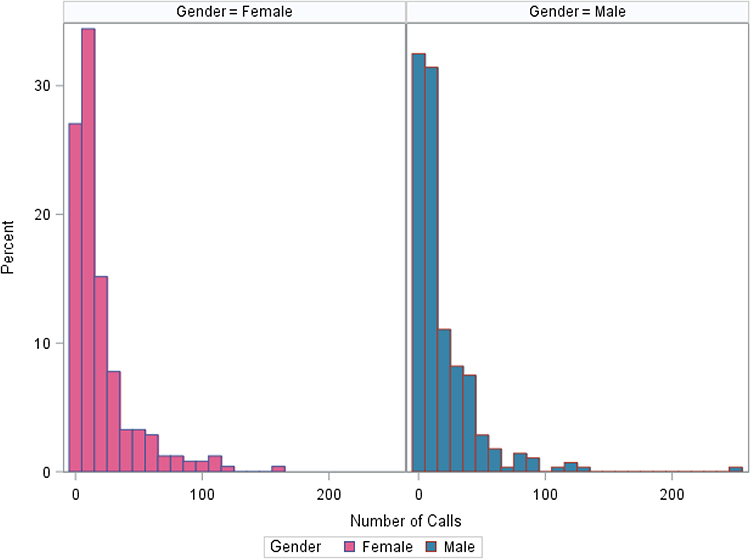 |
Figure 11 Number of calls by gender. |
 |
Figure 12 Number of calls by vision status. |
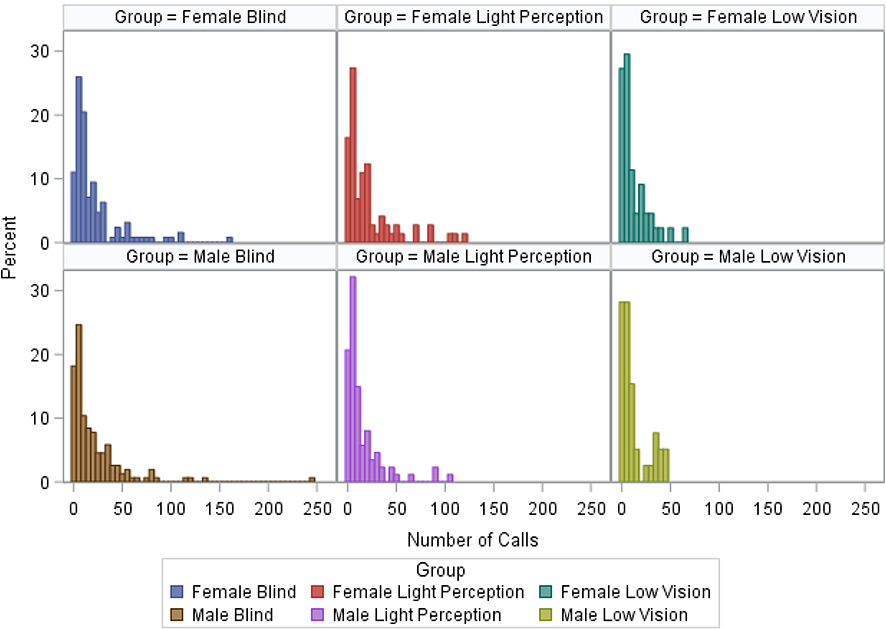 |
Figure 13 Number of calls by vision status and gender. |
Time of day and duration differed between each category
The distribution of time of day usage differed by each category (χ2=340.4, p<0.0001). Each category had the most calls in the morning and least in the evenings except for Instructions, Shopping, and Social categories, which displayed peaks during the afternoon. The latter three categories’ second most frequent time frame was in the morning. Duration of calls differed by category (F=41.12, p<0.0001). The category mean durations in decreasing order were as follows: the arts (19 mins 9 s), employment assistance (15 mins 7 s), shopping (13 mins 38 s), instructions (12 mins 20 s), navigation (10 mins 24 s), social (9 mins 33 s), home management (8 mins 49 s), reading (7 mins 38 s), family (6 mins 17 s). A multiple linear regression model for duration yielded the greatest effect size for the arts (PE=585.74, p<0.0001) followed by employment assistance (PE=344.24, p<0.0001). The model yielded the most negative effect size for family (PE=−188.14, p=0.2192) followed by reading (PE=−163.61, p<0.0001).
Number of navigation calls did not differ by assistive device usage
Number of navigation calls did not differ by assistive device usage (F=1.17566, p=0.321019). The mean number of navigation calls by white cane, guide dog, both, other, and none were 8.37 (SD 14.35), 9.60 (SD 11.11), 7.66 (SD 8.44), 3.20 (SD 2.68), 18.40 (SD 14.54), respectively. Post-hoc pairwise comparisons of mean call duration with Tukey HSD correction for multiple pairwise comparisons were not calculated due to insignificant F-ratio.
Discussion
Understanding the needs of individuals with low vision is critical to developing the next generation of low vision aids. As there are currently no large scale studies documenting the needs of the low vision population, data from the Aira assistive technology system provide a unique resource to delve into understanding the real-world needs and behaviors of low vision individuals at a highly granular level. As the Aira system serves as an adjunct to the patient’s current visual aids, it can truly capture the gaps not being met by current low vision aids such as in navigation and reading. The large amount of data encompassing call times, locations, assistance categories as well as demographic information such as gender and vision level essentially provides a clinical registry of low vision individuals, which is not available through any other resource.
This study assessed the distribution of assistive needs of individuals with severe visual impairment through the Aira system. Over the 10,022 total calls, the distributions of assistance categories, duration, and time of day of call were significantly different by gender and by vision status. Blind and light perception callers had higher usage rates than low vision callers. Women had higher usage rates than men. Across all categories, there was no significant difference in task completion rates. One caveat is that some of these differences while statistically significant are relatively modest. Further work is needed to determine whether some of these differences are clinically significant. Assessment and characterization of the needs of those with vision impairment may provide future improvement in services offered in assistive technology for those living with visual disability.
To our knowledge, there are few studies quantifying the types of assistance required by those with visual impairment, though the plethora of available and investigative technology may serve as surrogate descriptions of needs. Brezin et al describe types of real-time live assistance required by those with vision impairment including washing, dressing, cutting food, assistance with drinking, drinking and eating prepared meals, going to the lavatory, getting out of bed, rising from chairs, mobility on one level, climbing stairs, using the elevator, walking outside, shopping, preparing meals, housework, paperwork, transportation, using the phone, and taking medicines. After adjusting for age, number of additional subjects in household, and number of comorbidities, the authors concluded that across 16,945 subjects, as vision quality decreased from no vision problems, to other vision problems, to low vision, and finally to blindness, there was significantly increased odds and percentage of requiring assistance (p<0.001) across all aforementioned assistance types. Furthermore, the top 3 utilized assistances for the blind by percentage of all blind subjects were paperwork (100%), shopping (100%), and transportation (87%). The top 3 utilized assistances for those with low vision by percentage of all low vision subjects were paperwork (65%), housework (35%), and shopping (22%).6 Our study confirms this finding of differing requirements of assistance based on vision status as well as generally what the three leading categories of assistance were: reading, navigation, and home management.
Of the categories described in this study, most available technologies revolve around reading and navigation assistance, which both consistently represented the largest share of calls made by each gender and each vision status in this study. Currently, a variety of low vision assistive devices are available to enhance navigation including guide dogs and white canes. These assistive devices rely upon the remaining senses to serve as substitutes for vision, for example converting the tactile sensation of braille for reading and auditory traffic signals for directing. Enhancements to visually impaired navigation have involved the addition of ultrasonic sensors, optical or laser technology, infrared transmitters, and computer vision.7 For example, Intoer (Kr-Vision, Hangzhou, China) utilizes semantic segmentation through convolutional neural networks to create acoustic coding of the environment of the user.8 With the RealSense R200 sensor (Intel Corporation, Santa Clara, CA), its depth of field and angle has been enhanced by combining infrared and RGB-depth sensors.9 Overall this processing strategy has allowed the glasses to reduce both latency and computational power, thus allowing for learned specific auditory signaling for real-time feedback to the user. While some studies have been performed to evaluate the utility of navigation aids,10,11 none have used methods that have been specifically validated for low vision individuals. Moreover, there was no difference in number of navigation calls in those using white cane, guide dog, both, other, and none. The fact that navigation is still a predominant category for Aira users across all surveyed assistive device types suggests that current navigation aids may not be completely fulfilling the needs of low vision users. Further studies exploring the exact nature of the navigation needs of Aira users may provide further insight into the specific unmet needs of low vision individuals for navigation.
Reading assistive technology has long revolved around optical character recognition (OCR), magnifiers, and Braille.12 A plethora of devices have been developed with magnification capabilities up to 24x with varying degrees and combinations of ancillary services including OCR (text-to-speech), product identification (through bar codes or QR codes) and object recognition (through machine learning). (Table 5) These magnification-focused devices are limited by requiring their users to have residual vision. Other devices that provide the range of the aforementioned ancillary services without magnification functionality do not require any level of intact vision (Table 5). Furthermore, native operating systems Android OS (Google, Mountain View, CA) and iOS (Apple Inc., Cupertino, CA) allow for integrated accessibility functions such as magnification, OCR, high contrast or color inverted display, and virtual assistance. Virtual assistants including Siri (Apple Inc., Cupertino, CA), Google Assistant (Google, Mountain View, CA), and Amazon Alexa (Amazon.com, Inc., Seattle, WA) allow for actions such as phone calls, reading and replying to messages, navigation to be accomplished without requiring vision-tactile commands. In contrast to focused application provided by the plethora of reading assistive technology and OCR devices of either dictating the words on the page or enhancing residual vision for reading, Aira provides a “human factor” to rapidly expand beyond the simple task prescribed to OCR devices. For example, if a low vision individual was in an art gallery with an OCR device, the descriptive text on the placard would be able to relay the history and background of the art piece. However, Aira provides the opportunity to extend the user experience beyond the written and invites the user to imagine the art itself through verbal descriptions of the human agent at Aira. Therefore, although many technologies have been available for reading and navigation, the observation that reading is leading category of assistance through the Aira system suggests those areas are not being adequately addressed with current technologies on the market.
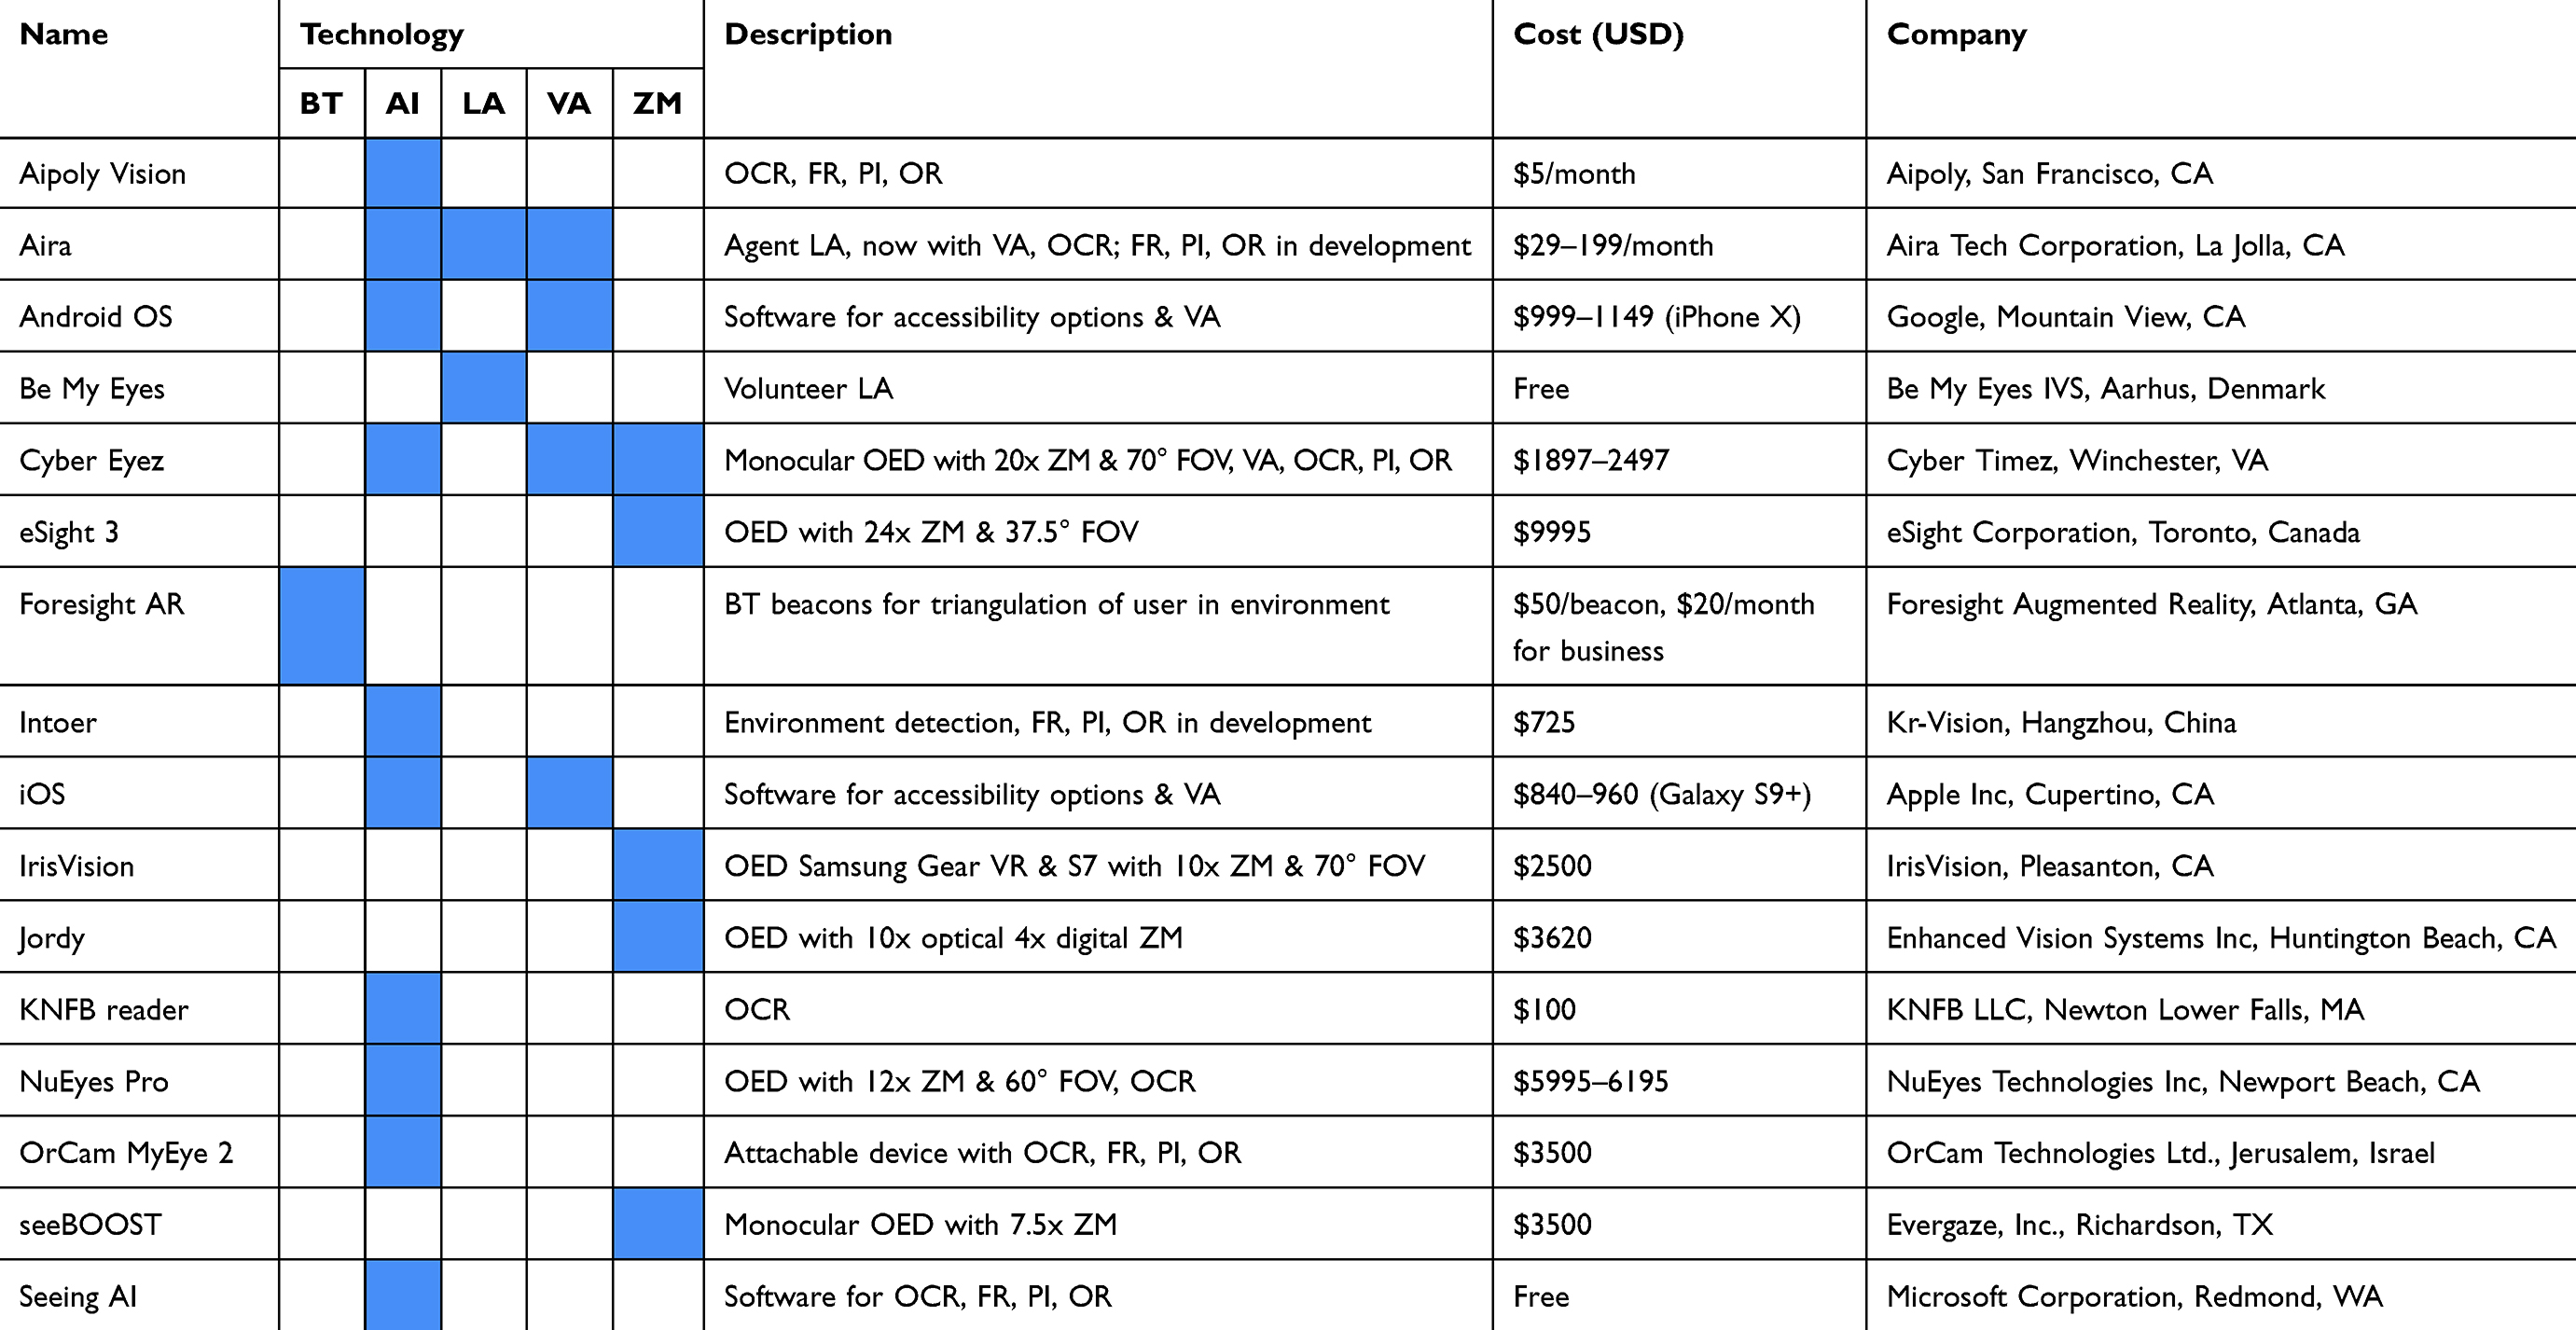 |
Table 5 Brief summary of currently available assistive technologies |
Currently, there is little literature investigating how needs differ by gender in low vision individuals. In general, women have been reported to utilize more health care services than men13–16 and report more functional and physical disability when compared to men.17,18 In a study of 872 seniors with vision impairment and depression by Rovner & Ganguli, women [adjusted OR=1.9 (95% CI: 1.4–2.7)] were more likely to report impairment in activities of daily living.19 Women subsequently have significantly higher utilization rates of assistance from aids, devices, or persons for their activities of daily living as shown in a study by Murtagh & Hubert of 1,348 seniors.16 In our study, we comparably observe that the usage rates of women as 1.09 times the usage rates for men. Similar to many prior studies showing higher assistance usage by women likely related to higher reports of disability, our study shows higher usage rates by women when compared to men.
Within the categories, there was a significant difference in category distribution by gender for shopping, social, arts, and navigation. Female individuals had higher category utilization of social, shopping, and the arts, which may be explained by the Murtagh & Hubert study where women were shown to have higher utilization of social support,16 which is more central to social, shopping, and the arts.
In Figures 11–13, these utilization patterns are visualized into a positive-skew pattern suggesting most users place around 10–20 calls with some outlier users creating a tail on the histogram. This study provides insight into the use patterns of both genders, allowing for future optimization of services to symmetrically improve the quality of life of the visually impaired.
In this study, higher usage rates were also found in blind and light perception callers when compared to low vision users. In a study of 16,945 French subjects by Brezin et al, participants were sub-categorized into blind, low vision, other vision problem, and no vision problem.6 After adjustment for age, the percentage of blind (38%), low vision (10%), and normal vision (8%) subjects who required assistance was significantly different (p<0.001). After adjustment for age, number of household occupants, and comorbidities, blind subjects required significantly more paid services than those with low vision, other vision problem, or no vision problem. Furthermore, the use of assistive devices increased as visual status decreased from no vision problem to blindness (p<0.001).6 This comprehensive epidemiologic study is concordant with our findings that worsening vision status increased the usage rate of Aira with blind users calling 1.68 times and light perception users calling 1.43 times compared to low vision users. Interestingly in this study, compared to those with normal vision, visually impaired individuals reported more handicaps after adjustment for age (p<0.001), which may explain higher service utilization rates, though the statistics described above were adjusted for the number of comorbidities.6 The same group studied 31,548 French subjects and concluded the annual nonmedical costs of blind and low vision and showed the annual cost per subject was higher in the blind (€15,679) when compared to those with low vision (€7242).20 In a separate study by Frick et al of 77,511 American adults, the annual cost per subject was significantly higher in blind adults [$2157 (95% CI: 860–3454)] when compared to visually impaired adults [$1037 (95% CI: 559–1514)] after controlling for sex, race, education, insurance status, age, diabetes, hypertension, income, and family size.21 These findings by Lafuma et al and Frick et al, confirm our findings that as vision level worsened, mean duration of time of calls increased, which may serve as a surrogate marker of utilization and total costs of the service, as the subscription levels are based on minutes used. This information could be useful for defining policies and degree of visual aid assistance based on vision.
To our knowledge, this is the only study that has attempted to characterize the assistive needs of those living with low vision with additional analysis by gender and vision status. An exploratory study has demonstrated improvement in quality of life by a validated low vision questionnaire after 3 months of use of the Aira system.22 Currently, the only other application that utilizes human assistance is through volunteers for those with low vision through the free Be My Eyes application (Be My Eyes IVS, Aarhus, Denmark). This system uses the native camera device of smartphones to establish a real-time video chat between the low vision user and the volunteer assistance. This technology is limited, however, by its reliance on volunteers who are not formally trained and validated and its single function of human assistance. The Be My Eyes website lists 10 common requests, and when applied to our categorization, 3 were related to shopping, 2 navigation, 2 reading, 2 home management, and 1 arts. It will be interesting to see how further advances in technology may augment the current Aira platform. Currently, artificial intelligence through a general suite of services through Amazon (Amazon.com, Inc., Seattle, WA) has been incorporated and is being developed for Aira including text recognition, facial recognition, and object identification. In addition, the subscription base and number of calls have grown substantially since this data has been collected-there are thousands of users with over 45,000 calls between April 1, 2018 and June 30, 2018. Future studies investigating this larger database can help confirm these initial observations as well as provide additional insight into the behavior of these individuals.
Strengths of the study include the availability of a large amount of call data, as well as multiple quantifiable metrics. Subjects were not formally enrolled during the study, so calls were recorded sequentially without any exclusions. Therefore, this data set is representative of the general population of Aira users. In addition, as the Aira system is an adjunct to the patient’s existing vision aids, it can help to identify needs, which are not met by current visual aids. There are multiple limitations to this study. Given the large-scale nature of the study, it is difficult to understand, at the individual level, why some calls were longer and if there were multiple requests within one call. There was an opportunity to include a secondary category, but agents were not required to fill this section, so interpreting this data would not be reliable. Further, the Aira explorer population may not reflect the low vision population as a whole for a number of reasons. 1) These are individuals who have the financial resources for the subscription as well as the technologic literacy to operate the device. 2) Individuals currently satisfied with their current visual aids would not choose to enroll in the Aira services. Geographically, these are Aira subscribers in the United States of America, Canada, and Australia. However, this pool of data represents the first large-scale needs assessment with over 10,000 calls over 800 low vision individuals. Future studies are needed to examine larger datasets as the number of Aira explorers has grown to the low thousands with over 45,000 calls within the past 3 months. Furthermore, future studies would benefit from analyzing the changes in distribution, if any, in call categorization and utilization by gender and vision level in the context of AI integration.
In conclusion, this study is one of the first large-scale studies to assess the real-world needs of low vision individuals. We demonstrate that the distribution of call types, duration, and time of day call placed varied significantly by both gender and vision status. This demonstrates that data from the Aira assistive technology database may provide valuable insights into the needs and limitations of men and women living with varying degrees of visual impairment. Further studies tailored toward identifying the various facets of daily vision demands will continue to provide further guidance towards meeting the visual needs of the low vision population.
Acknowledgments
Financial support: Daniel Chao is supported as a scholar on a K12 grant from the NEI 1K12EY024225-01A1 (Bethesda, MD). The funding organization had no role in the design or conduct of this research.
Disclosure
Andrew Utt and Emily Hill are employees at Aira; none of the other authors have a financial interest in Aira; Aira did not provide any funding for the project and did not have input in the analysis and writing of the manuscript. Dr Brian Jonathan Nguyen has nothing to disclose. Mr William Chen has nothing to disclose. Dr Allison J Chen has nothing to disclose. Mr Andrew Utt reports salary from Aira, outside the submitted work. Ms Emily Hill reports salary from Aira, during the conduct of the study. Mr Ryan Apgar has nothing to disclose. Dr Daniel Chao reports personal fees from Recens Medical, personal fees from DTx Pharma, personal fees from Zilia Health, personal fees from Visgenx, outside the submitted work. The authors report no other conflicts of interest in this work.
References
1. Bourne RRA, Flaxman SR, Braithwaite T, et al. Magnitude, temporal trends, and projections of the global prevalence of blindness and distance and near vision impairment: a systematic review and meta-analysis. Lancet Glob Health. 2017;5(9):e888–e897. doi:10.1016/S2214-109X(17)30293-0
2. Control CfD, Prevention. Prevalence of disabilities and associated health conditions among adults – United States, 1999. Morb Mortal Wkly Rep. 2001;50(7):120.
3. Varma R, Vajaranant TS, Burkemper B, et al. Visual impairment and blindness in adults in the United States: demographic and geographic variations from 2015 to 2050. JAMA Ophthalmol. 2016;134(7):802–809. doi:10.1001/jamaophthalmol.2016.1284
4. Rein DB, Zhang P, Wirth KE, et al. The economic burden of major adult visual disorders in the United States. Arch Ophthalmol. 2006;124(12):1754–1760. doi:10.1001/archopht.124.12.1754
5. Aira. How It Works. Aira; v; 2018.
6. Brézin AP, Lafuma A, Fagnani F, Mesbah M, Berdeaux G. Prevalence and burden of self-reported blindness, low vision, and visual impairment in the French community: a nationwide survey. Arch Ophthalmol. 2005;123(8):1117–1124. doi:10.1001/archopht.123.8.1117
7. Giudice NA, Legge GE. Blind navigation and the role of technology. In: The Engineering Handbook of Smart Technology for Aging, Disability, and Independence. 2008:479–500.
8. Yang K, Wang K, Bergasa LM, et al. Unifying terrain awareness for the visually impaired through real-time semantic segmentation. Sensors. 2018;18(5):E1506. doi:10.3390/s18051506
9. Yang K, Wang K, Hu W, Bai J. Expanding the detection of traversable area with RealSense for the visually impaired. Sensors. 2016;16(11):195. doi:10.3390/s16122100
10. Lee CL, Chen CY, Sung PC, Lu SY. Assessment of a simple obstacle detection device for the visually impaired. Appl Ergon. 2014;45(4):817–824. doi:10.1016/j.apergo.2013.10.012
11. Roentgen UR, Gelderblom GJ, de Witte LP. User evaluation of two electronic mobility aids for persons who are visually impaired: a quasi-experimental study using a standardized mobility course. Assist Technol. 2012;24(2):110–120. doi:10.1080/10400435.2012.659794
12. Moore E, Dickson MB. Working Effectively with People Who are Blind or Visually Impaired. 2010.
13. Redondo-Sendino Á, Guallar-Castillón P, Banegas JR, Rodríguez-Artalejo F. Gender differences in the utilization of health-care services among the older adult population of Spain. BMC Public Health. 2006;6(1):155. doi:10.1186/1471-2458-6-155
14. Kandrack M-A, Grant KR, Segall A. Gender differences in health related behaviour: some unanswered questions. Soc Sci Med. 1991;32(5):579–590. doi:10.1016/0277-9536(91)90293-l
15. Verbrugge LM, Wingard DL, Features Submission HC. Sex differentials in health and mortality. Women Health. 1987;12(2):103–145. doi:10.1300/J013v12n02_07
16. Murtagh KN, Hubert HB. Gender differences in physical disability among an elderly cohort. Am J Public Health. 2004;94(8):1406–1411. doi:10.2105/ajph.94.8.1406
17. Penning MJ, Strain LA. Gender differences in disability, assistance, and subjective well-being in later life. J Gerontol. 1994;49(4):S202–S208. doi:10.1093/geronj/49.4.S202
18. Beckett LA, Brock DB, Lemke JH, et al. Analysis of change in self-reported physical function among older persons in four population studies. Am J Epidemiol. 1996;143(8):766–778. doi:10.1093/oxfordjournals.aje.a008814
19. Rovner BW, Ganguli M. Depression and disability associated with impaired vision: the MoVies Project. J Am Geriatr Soc. 1998;46(5):617–619. doi:10.1111/j.1532-5415.1998.tb01080.x
20. Lafuma A, Brezin A, Fagnani F, Mimaud V, Mesbah M, Berdeaux G. Nonmedical economic consequences attributable to visual impairment. Eur J Health Econ. 2006;7(3):158–164. doi:10.1007/s10198-006-0346-1
21. Frick KD, Gower EW, Kempen JH, Wolff JL. Economic impact of visual impairment and blindness in the United States. Arch Ophthalmol. 2007;125(4):544–550. doi:10.1001/archopht.125.4.544
22. Nguyen BJ, Kim Y, Park K, et al. Improvement in patient reported quality of life outcomes in severely visually impaired individuals using the Aira assistive technology system. Transl Vis Sci Technol. 2018;7(5):30. doi:10.1167/tvst.7.4.7
 © 2019 The Author(s). This work is published and licensed by Dove Medical Press Limited. The
full terms of this license are available at https://www.dovepress.com/terms
and incorporate the Creative Commons Attribution
- Non Commercial (unported, 3.0) License.
By accessing the work you hereby accept the Terms. Non-commercial uses of the work are permitted
without any further permission from Dove Medical Press Limited, provided the work is properly
attributed. For permission for commercial use of this work, please see paragraphs 4.2 and 5 of our Terms.
© 2019 The Author(s). This work is published and licensed by Dove Medical Press Limited. The
full terms of this license are available at https://www.dovepress.com/terms
and incorporate the Creative Commons Attribution
- Non Commercial (unported, 3.0) License.
By accessing the work you hereby accept the Terms. Non-commercial uses of the work are permitted
without any further permission from Dove Medical Press Limited, provided the work is properly
attributed. For permission for commercial use of this work, please see paragraphs 4.2 and 5 of our Terms.