Back to Journals » Clinical, Cosmetic and Investigational Dermatology » Volume 19
JAK Activation Drives MED15-Associated Melanocyte Dysfunction in Vitiligo Beyond Immune Cells
Authors Wu J ![]() , Ren Y, Cui J, He M
, Ren Y, Cui J, He M ![]() , Zhang X, Li D, Zhang N
, Zhang X, Li D, Zhang N
Received 4 March 2026
Accepted for publication 30 May 2026
Published 8 June 2026 Volume 2026:19 605625
DOI https://doi.org/10.2147/CCID.S605625
Checked for plagiarism Yes
Review by Single anonymous peer review
Peer reviewer comments 3
Editor who approved publication: Dr Monica K. Li
Jize Wu,1,2,* Yijia Ren,3,* Jiahao Cui,3 Mingjie He,3 Xiaoyu Zhang,4 Dingding Li,1 Na Zhang5
1Scientific Research Management Section, Zhoukou Central Hospital, Zhoukou, Henan, People’s Republic of China; 2First Clinical Medical College, Zhengzhou University, Zhengzhou, Henan, People’s Republic of China; 3Dermatology, First Affiliated Hospital of Zhengzhou University, Zhengzhou, Henan, People’s Republic of China; 4Department of Pathophysiology, School of Basic Medical Sciences, Zhengzhou University, Zhengzhou, Henan, People’s Republic of China; 5Dermatology, Zhoukou Central Hospital, Zhoukou, Henan, People’s Republic of China
*These authors contributed equally to this work
Correspondence: Dingding Li, Scientific Research Management Section, Zhoukou Central Hospital, No. 26, East Section of Renmin Road, Chuanhui District, Zhoukou, Henan, People’s Republic of China, Email [email protected] Na Zhang, Dermatology, Zhoukou Central Hospital, No. 26, East Section of Renmin Road, Chuanhui District, Zhoukou, Henan, People’s Republic of China, Email [email protected]
Background: Vitiligo is an autoimmune disorder characterized by selective melanocyte loss, largely driven by interferon-gamma (IFN-γ)-induced Janus kinase/signal transducers and activators of transcription (JAK–STAT) activation. While the immune aspects of JAK–STAT signaling are well-documented, its downstream transcriptional mediators within melanocytes remain incompletely understood.
Methods: We integrated multi-omics analyses, including cross-tissue and single-tissue transcriptome-wide association studies (TWAS), conditional and joint analysis (COJO), and summary data-based Mendelian randomization (SMR), using genome-wide association study (GWAS) data comprising 391 vitiligo cases and 465,673 controls. These were combined with single-cell RNA sequencing (scRNA-seq) data from 15 samples (10 vitiligo lesions and 5 healthy controls) and in vitro functional assays to identify causal JAK-responsive genes associated with vitiligo.
Results: Mediator complex subunit 15 (MED15) emerged as a robust gene associated with increased vitiligo risk (significance thresholds were set at P < 0.05, with False Discovery Rate [FDR] corrections detailed in Supplementary Data). Single-cell transcriptomic data revealed significant upregulation of MED15 in melanocytes from lesional skin, positively correlated with STAT1 expression and enrichment of the JAK–STAT pathway. Functional assays confirmed that MED15 overexpression profoundly inhibited melanocyte proliferation and suppressed intrinsic melanin synthesis, both of which were significantly reversed by JAK inhibition with Ruxolitinib. Furthermore, dual-luciferase reporter assays confirmed that MED15 is a direct transcriptional target of STAT1, governed by upstream JAK signaling.
Conclusion: MED15 functions as a JAK-responsive transcriptional cofactor contributing to melanocyte proliferation and melanogenesis dysfunction in vitiligo. These findings establish a direct STAT1–MED15 transcriptional axis driving melanocyte injury, offering new insights into transcriptional mechanisms and potential therapeutic targets. MED15 may represent a complementary therapeutic target alongside JAK inhibition.
Keywords: vitiligo, JAK–STAT signaling, MED15, melanocyte, TWAS, single-cell RNA-seq
Introduction
Vitiligo is a common acquired depigmenting disorder characterized by the selective loss of functional melanocytes,1 leading to well-demarcated white macules and patches on the skin. It affects approximately 0.5–2% of the global population and imposes a substantial psychosocial burden on affected individuals.2 Although the precise etiology of vitiligo is multifactorial, accumulating evidence supports an autoimmune basis, in which interferon-γ (IFN-γ)–driven inflammation and activation of the JAK–STAT signaling pathway play central roles in mediating melanocyte destruction.3 In the vitiligo microenvironment, CD8⁺ T cell-derived IFN-γ exerts dual pathogenic effects. It not only enhances CXCL10–CXCR3 chemotaxis to promote further immune infiltration,4–6 but also triggers severe intracellular stress directly within melanocytes. Activation of the JAK-STAT axis in these cells induces senescence, structural damage, and apoptosis, while actively suppressing melanogenesis. The clinical efficacy of JAK inhibitors in repigmentation further highlights the importance of this pathway in vitiligo pathogenesis.7
Despite recognition of JAK signaling as a pathogenic driver, the downstream transcriptional mediators and cellular consequences of JAK activation in melanocytes remain poorly understood. Genome-wide association studies (GWAS) have identified numerous vitiligo susceptibility loci involved in immune regulation and melanocyte function,8–10 yet most lie in non-coding regions, making it difficult to pinpoint causal genes. Transcriptome-wide association studies (TWAS) provide an integrative framework that links genetic variation to gene expression, allowing the identification of genes whose expression mediates disease risk.11 However, a major challenge is that skin tissue eQTL reference panels measure expression from a bulk mixture of resident cell types, in which melanocytes represent only a minor fraction. To overcome this, bulk TWAS signals can be systematically integrated with high-resolution single-cell RNA-sequencing (scRNA-seq). This integrative multi-omics approach successfully deconvolutes the bulk tissue mixture, allowing for the precise identification of melanocyte-specific causal genes that might otherwise be masked in conventional bulk analyses.
Given the established role of JAK activation in melanocyte stress, we hypothesized that specific transcriptional cofactors are induced downstream of JAK signaling to mediate cell injury. One such candidate is the Mediator complex subunit 15 (MED15). As a core component of the Mediator complex, MED15 bridges sequence-specific transcription factors—including the STAT family—to RNA polymerase II, thereby coordinating targeted gene expression. While its specific role in melanocyte biology was previously uncharted, MED15 is fundamentally involved in cellular stress responses, lipid metabolism, and immune-related transcriptional reprogramming. This makes it a highly plausible candidate for translating inflammatory JAK-STAT signals into melanocyte dysfunction.
In this study, we aimed to systematically identify and functionally validate JAK-responsive genes involved in vitiligo pathogenesis. We conducted cross-tissue and single-tissue TWAS using UTMOST and FUSION, followed by conditional and joint analysis (COJO) and summary data–based Mendelian randomization (SMR) to prioritize independent causal signals. By integrating these robust genetic findings with vitiligo scRNA-seq datasets, we sought to map these signals to specific cell populations. Finally, through extensive in vitro functional assays and promoter-level validation in melanocytes, we aimed to establish the direct molecular axis linking JAK activation to MED15-driven melanocyte depletion and melanogenesis failure.
Methods
Transcriptome-Wide Association Study (TWAS)
Data Sources and Overall Design
A transcriptome-wide association study (TWAS) was conducted to identify potential candidate genes associated with vitiligo susceptibility. TWAS integrates genome-wide association study (GWAS) summary statistics with expression quantitative trait loci (eQTL) reference panels to infer gene-level associations based on genotype–expression correlations. The overall analytical framework comprised three complementary components: (1) cross-tissue association analysis using UTMOST; (2) single-tissue validation using FUSION; and (3) conditional and joint analysis (COJO) to test signal independence.
GWAS Summary Statistics
Vitiligo GWAS summary statistics were obtained from the FinnGen Release 12 (R12) cohort,12 a large population-based biobank encompassing millions of genetic variants. The dataset comprised 391 vitiligo cases and 465,673 healthy controls. Variants lacking rs identifiers, with minor allele frequency (MAF) < 0.01, or with imputation quality (INFO) < 0.8 were excluded. All variants were aligned to the GRCh37/hg19 reference genome, and only autosomal single-nucleotide polymorphisms (SNPs) were retained to ensure consistency with the eQTL reference panels.
Cross-Tissue TWAS Using UTMOST
Cross-tissue TWAS was performed using the Unified Test for Molecular Signatures (UTMOST) framework.13 This model simultaneously estimates both shared and tissue-specific eQTL effects across multiple tissues. Gene-expression prediction models were trained on GTEx v8 data covering 49 human tissues, including both sun-exposed and non-sun-exposed skin. For each gene, single-tissue TWAS statistics were first computed and then combined using the generalized Berk–Jones framework to obtain a unified gene-level association score. Genes with P < 0.05 were considered suggestive and were retained for downstream analyses. To rigorously account for multiple testing in genome-wide analyses, False Discovery Rate (FDR) corrections were subsequently applied, and the fully adjusted results are detailed in the Supplementary Tables.
Single-Tissue Validation Using FUSION
To validate the cross-tissue findings, a single-tissue TWAS was conducted using FUSION (Functional Summary-based Imputation).14 FUSION integrates GWAS summary statistics, linkage disequilibrium (LD) reference data, and pre-computed expression weights to evaluate tissue-specific gene–trait associations.
The inputs included: (1) the FinnGen R12 vitiligo GWAS dataset; (2) European LD reference data from the 1000 Genomes Project; and (3) skin-tissue expression weight files from GTEx v8. Genes showing consistent directionality and statistical significance (P < 0.05) in both UTMOST and FUSION analyses were regarded as validated.
Conditional and Joint Analysis (COJO)
To determine whether TWAS-identified genes represented independent association signals, conditional and joint analyses were performed using the FUSION–COJO framework.15 Within each genomic region, the TWAS association of a target gene was re-evaluated while controlling for the predicted expression of other significant genes in the same locus. Genes that remained significant after conditioning were defined as “jointly significant”, whereas those that lost significance were defined as “marginally significant”.This procedure helped disentangle overlapping signals and prioritize potentially causal genes.
Summary Data–Based Mendelian Randomization (SMR)
To further explore causal relationships between gene expression and vitiligo risk, a summary data–based Mendelian randomization (SMR) analysis was performed.16
eQTL data from GTEx v8 skin tissues served as the exposure, and vitiligo GWAS data from FinnGen R12 served as the outcome. Analyses were conducted using SMR v1.3.1, assessing associations between eQTL-driven expression levels and disease susceptibility.
The HEIDI (Heterogeneity in Dependent Instruments) test was used to distinguish pleiotropic from linkage effects. Results were visualized through scatter plots and forest plots to display genome-wide gene-level associations.
Single-Cell Transcriptomic Validation
Data Acquisition
To validate the key genes identified through TWAS, publicly available single-cell RNA-sequencing (scRNA-seq) data were obtained from the Genome Sequence Archive (GSA) under accession number PRJCA006797.17 All participants were from the same ethnic background. Vitiligo biopsies (3 × 3 mm2) were collected from the junction between depigmented lesions and adjacent non-lesional skin from multiple body sites, including the arm, face, back, neck, vulva, buttock, scalp, shoulder, and waist, while matched samples from healthy donors served as controls.
Data Processing, Clustering, and Annotation
Single-cell data processing was performed using the Seurat (v4.4.0) R package.18
Quality-control criteria included:
- 200–7000 detected genes per cell;
- total unique molecular identifiers (UMIs) > 1000 per cell; and
- mitochondrial transcript fraction < 20%.
Batch effects were corrected using Harmony.
Cells were clustered using the FindNeighbors and FindClusters functions and annotated into eight major cell populations based on canonical markers and reference annotations from the original study. Dimensionality reduction for visualization was performed using the nonlinear RunUMAP algorithm.19 Differential expression analysis was carried out with FindAllMarkers, applying an adjusted P < 0.05 and |log2 fold change| ≥ 0.25 as significance thresholds.
Visualization and Gene-Expression Analysis
Violin and box plots were generated using ggplot2, ggpubr, and ggbeeswarm to visualize gene-expression differences among cell types and between groups. Between-group comparisons were assessed using the Wilcoxon rank-sum test. Melanocyte subsets were further examined to characterize cell-type-specific expression changes relevant to vitiligo.
Pathway Enrichment Analysis
Gene-set enrichment analysis (GSEA) was conducted using the clusterProfiler and msigdbr R packages.20,21 Differentially expressed genes were ranked by average log2 fold change and compared against the MSigDB C2 collection, with a particular focus on the KEGG JAK–STAT signaling pathway. Significance was defined as P < 0.05 after Benjamini–Hochberg correction.
MC-1 Cell Overexpression Validation
To further investigate the functional role of MED15 in melanocyte biology, an overexpression plasmid (OE) encoding MED15 was constructed and transfected into MC-1 melanocytes. Cells were divided into three experimental groups: vector control (Mock), MED15-overexpression (OE), and OE + Ruxolitinib. For the pharmacological rescue group, transfected cells were treated with Ruxolitinib at an exact concentration of 1 μM.
To determine the optimal expression window and cellular response, total RNA was extracted at 48 h post-transfection and treatment, and MED15 expression levels were quantified by quantitative PCR (qPCR) using three technical replicates per group. Concurrently, cell-proliferative activity was continuously monitored using the CCK-8 assay at 0, 24, 48, and 72 h post-treatment. The CCK-8 assay was performed with six technical replicates (wells) per group to systematically assess the dynamic effects of MED15 overexpression and targeted JAK-pathway inhibition. All experiments in this study were conducted in three independent biological replicates.
Melanin Content Assay
To evaluate the functional impact of MED15 on melanogenesis independent of cell proliferation changes, an intracellular melanin content assay was performed using the NaOH lysis method with protein normalization. MC-1 melanocytes were seeded into 6-well plates at a density of 2 × 10⁵ cells/well and divided into three groups: Mock, MED15-overexpression (OE), and OE + Ruxolitinib. After 48 h of treatment, cells were harvested by trypsinization and washed with cold PBS. To account for variances in cell number, the cell suspension was strictly aliquoted: 10% of the suspension was lysed to determine the total protein concentration using a BCA Protein Assay Kit, while the remaining 90% was utilized for melanin extraction.
The cell pellets for melanin extraction were resuspended in 200 μL of 1 mol/L NaOH solution containing 10% DMSO and incubated at 80°C for 1 h with intermittent vortexing to fully solubilize the melanin. Following centrifugation at 12,000 rpm for 5 min to remove cellular debris, 150 μL of the clarified supernatant was transferred to a 96-well plate. The absorbance was measured at 405 nm using a microplate reader. The relative melanin content was calculated by normalizing the melanin absorbance value to the corresponding total protein concentration of each sample, and the results were expressed as a percentage relative to the Mock group. All experiments in this study were conducted in three independent biological replicates.
Dual-Luciferase Reporter Assay
To determine the direct transcriptional regulation of MED15 by STAT1, a dual-luciferase reporter assay was conducted. The wild-type (WT) promoter region of the human MED15 gene, containing the putative STAT1 binding motif, was synthesized and cloned into the pGL3-basic vector (Promega) to generate the pGL3-MED15-WT reporter plasmid. Concurrently, a mutant reporter plasmid (pGL3-MED15-Mut) was constructed by deleting the specific STAT1 binding sequence. MC-1 melanocytes were seeded in 24-well plates and co-transfected with either the WT or Mutant reporter plasmids, alongside a STAT1 overexpression plasmid (or empty vector), and the pRL-TK Renilla luciferase internal control plasmid using Lipofectamine 3000 (Invitrogen). For the inhibition assay, transfected cells were treated with 1 μM Ruxolitinib. After 48 h of incubation, the cells were lysed, and the luciferase activities were measured using the Dual-Luciferase Reporter Assay System (Promega) according to the manufacturer’s protocol. The relative luciferase activity was calculated by normalizing the Firefly luciferase activity to the Renilla luciferase internal control. All experiments in this study were conducted in three independent biological replicates.
Caspase-3/7 Activity Assay for Apoptosis
To determine whether the reduction in cell viability was associated with apoptosis, Caspase-3/7 activity was measured using the UA-Glo® Caspase 3/7 Assay kit (U-A Biotech, China), according to the manufacturer’s instructions. Briefly, MC-1 melanocytes were cultured in 96-well plates and subjected to the aforementioned transfections and Ruxolitinib (1 μM) treatments. After 48 h of incubation, the Caspase-3/7 assay reagent was added to each well and incubated at room temperature in the dark for 1 h. The luminescence was then recorded using a microplate reader. Caspase-3/7 activity was normalized to the total protein concentration and expressed as a fold change relative to the Mock control group. This assay was performed in three independent biological replicates, with three technical replicates per group.
Results
Integrative TWAS, COJO, and SMR Analyses Identified MED15 as a JAK-Related Risk Gene for Vitiligo
To systematically identify candidate genes associated with vitiligo risk, we performed integrative transcriptome-wide association analyses (TWAS) using both UTMOST and FUSION frameworks. The cross-tissue and single-tissue analyses identified several genes that reached nominal significance (P < 0.05), with four genes, APOL4, MED15, USP40, and ARSJ, remaining significant after conditional and joint (COJO) validation (Table 1). These genes therefore represent independent TWAS signals potentially contributing to vitiligo susceptibility.
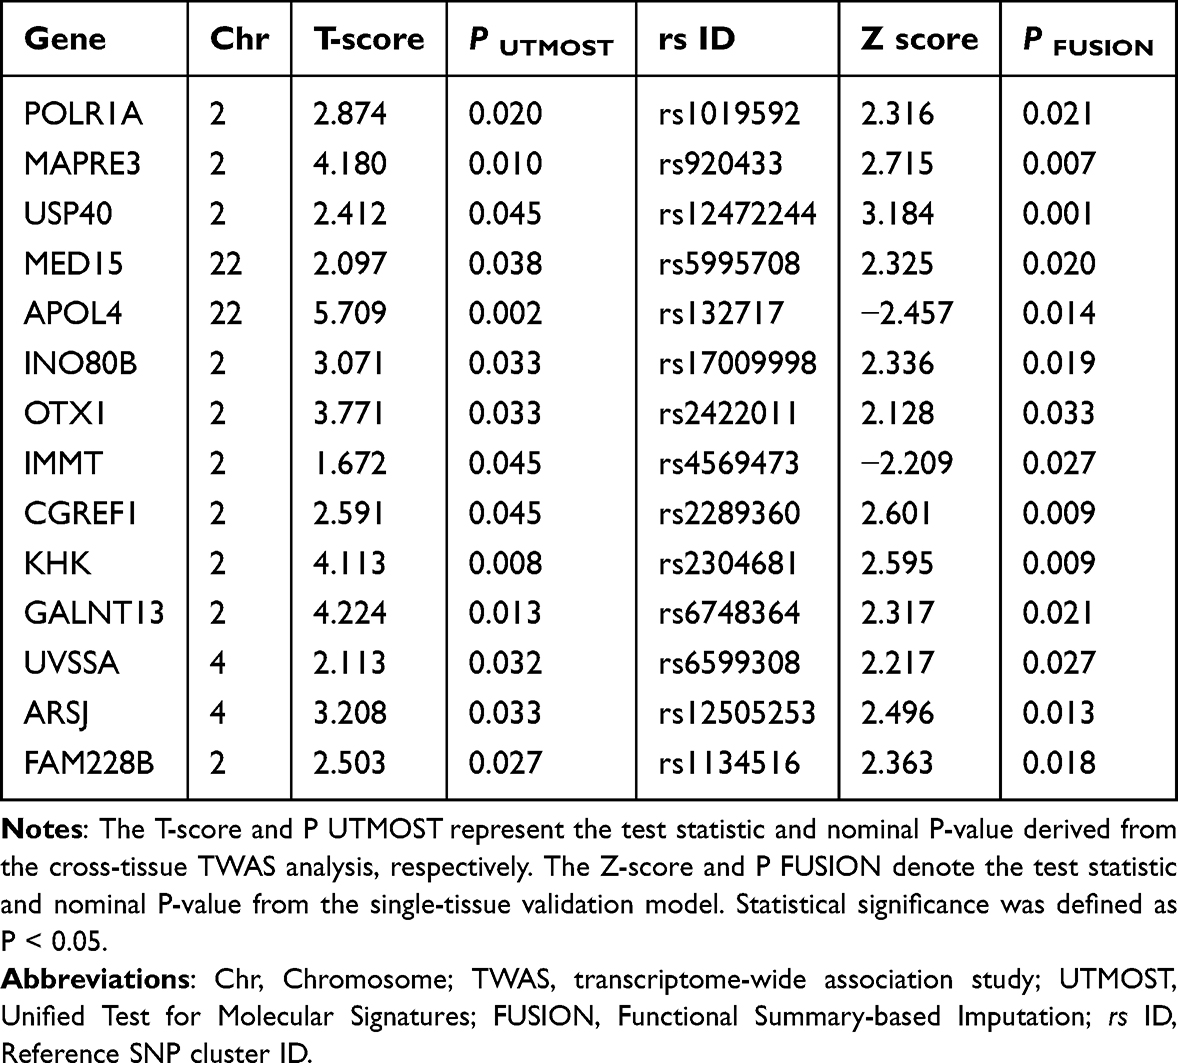 |
Table 1 Significant Genes for Vitiligo Risk in Cross-Tissue TWAS Analysis and Single-Tissue Validation |
A dual-axis scatter plot revealed a strong concordance between UTMOST T-scores and FUSION Z-scores across multiple genes (Figure 1A). The bubble size represents −log10(P-FUSION), and color indicates the Z-score direction. Several genes, including MED15, USP40, and ARSJ, exhibited consistent positive associations in both models. The complete lists of genes showing nominal significance (P < 0.05) in the cross-tissue and single-tissue TWAS analyses are provided in Tables S1 and S2, respectively.
 |
Figure 1 Integrative TWAS, COJO, and SMR analyses identifying MED15 as a JAK-related risk gene for vitiligo. (A) Dual-axis scatter plot showing concordance between UTMOST T-scores and FUSION Z-scores across multiple genes. The bubble size represents −log10(P-FUSION), and color indicates the Z-score direction. (B) Conditional and joint (COJO) analyses demonstrating genes retaining significant associations after adjustment for regional linkage disequilibrium. (C) An UpSet plot demonstrating that MED15 was among the overlapping significant genes jointly detected by both UTMOST and FUSION. (D) Scatter plots of SMR analyses revealing concordant eQTL–GWAS effect sizes for APOL4, MED15, and USP40. (E) Forest plot visualization showing that MED15 and USP40 conferred increased risk, whereas APOL4 exhibited a protective association. (F) SMR locus plots displaying the regional colocalization patterns for APOL4, MED15, and USP40. |
Subsequent conditional and joint (COJO) analyses were conducted to evaluate the independence of these signals. Four genes—APOL4, MED15, USP40, and ARSJ—retained significant associations after adjustment for regional linkage disequilibrium, confirming their independent effects (Figure 1B). The detailed summary of conditional and joint analyses confirming independent association signals is presented in Table S3.
An UpSet plot demonstrated that MED15 was among the overlapping significant genes jointly detected by both UTMOST and FUSION (Figure 1C).
To further assess the causality between gene expression and vitiligo risk, we performed summary-data–based Mendelian randomization (SMR) analyses integrating eQTL and GWAS summary statistics. Scatter plots revealed concordant eQTL–GWAS effect sizes for APOL4, MED15, and USP40, suggesting shared genetic regulation across loci (Figure 1D).
Forest plot visualization showed that MED15 and USP40 conferred increased risk (odds ratio > 1), whereas APOL4 exhibited a protective association (odds ratio < 1) (Figure 1E).
Finally, SMR locus plots displayed the regional colocalization patterns for these three genes, showing strong eQTL–GWAS overlap within ±500 kb windows around their transcription start sites (Figure 1F). Comprehensive SMR statistics for the three prioritized genes (APOL4, MED15, and USP40) are summarized in Table S4.
Single-Cell Transcriptomic and Experimental Validation Identified MED15 as a JAK-Responsive Gene
To validate the transcriptomic findings from TWAS at the cellular level, we analyzed a single-cell RNA sequencing (scRNA-seq) dataset (GSA: PRJCA006797) derived from lesional and non-lesional skin of vitiligo patients as well as healthy controls. As shown in Figure 2A and B, the integrated UMAP embedding revealed eight major skin cell populations, including keratinocytes, melanocytes, fibroblasts, endothelial cells, and immune cell subsets. The identities of these clusters were confirmed by canonical marker expression (Figure 2C). Cellular composition analysis demonstrated that vitiligo lesions were characterized by an increased proportion of T cells and a decreased proportion of melanocytes compared with normal skin (Figure 2D).
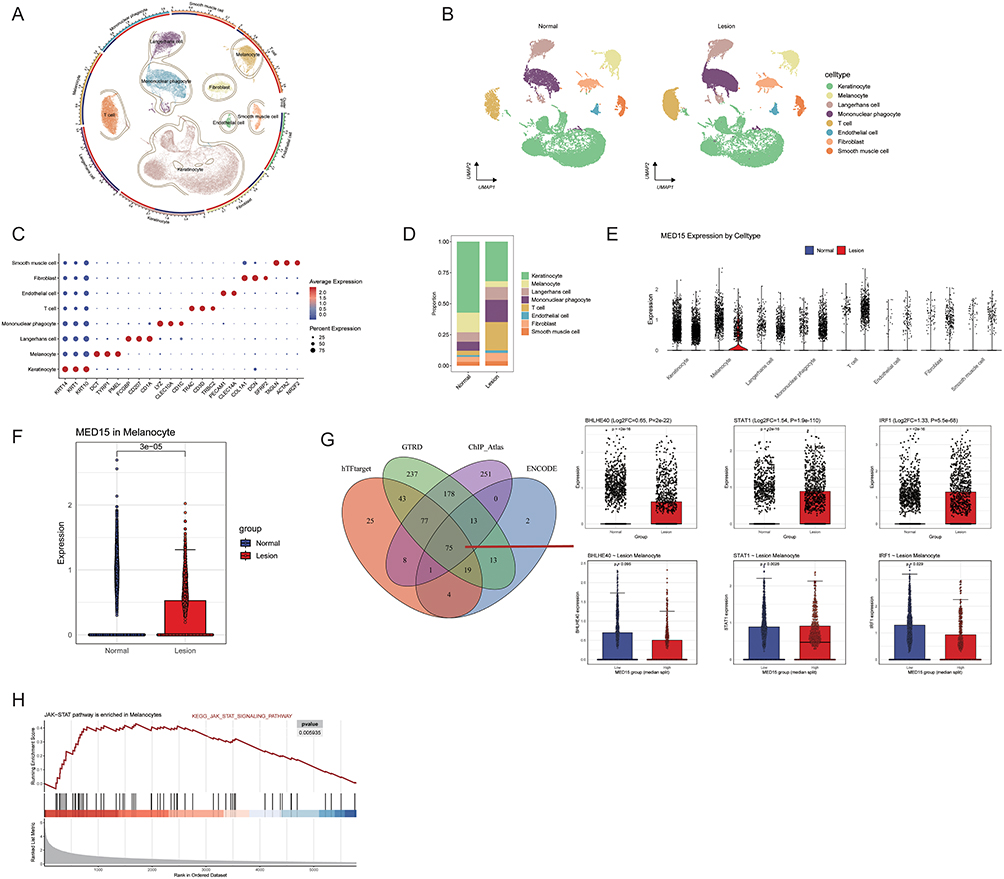 |
Figure 2 Single-cell transcriptomic and experimental validation of MED15 as a JAK-responsive gene. (A and B) Integrated UMAP embedding revealing eight major skin cell populations in normal and lesional skin. (C) Dot plot of canonical marker expression confirming cell cluster identities. (D) Cellular composition analysis demonstrating cell type proportions, with vitiligo lesions characterized by an increased proportion of T cells and a decreased proportion of melanocytes. (E and F) Violin plots showing MED15 is predominantly enriched in melanocytes and significantly upregulated in lesional samples relative to normal controls. (G) Correlation analysis revealing a positive association between MED15 and STAT1 within melanocytes of vitiligo lesions. (H) Gene set enrichment analysis (GSEA) demonstrating significant enrichment of the JAK-STAT signaling pathway in melanocytes with high MED15 expression. |
Expression profiling across all cell types showed that MED15 was predominantly enriched in melanocytes and was significantly upregulated in lesional samples relative to normal controls (Figure 2E and F). Integrated transcription factor target prediction using hTFtarget, ChIP-Atlas, GTRD, and ENCODE databases identified 75 potential upstream regulators of MED15. Among these, three transcription factors exhibited notably higher expression in melanocytes from lesional skin. Correlation analysis revealed that MED15 expression was positively associated only with STAT1 within melanocytes of vitiligo lesions (Figure 2G), suggesting that STAT1 may serve as a key upstream transcriptional regulator of MED15. Gene set enrichment analysis (GSEA) further demonstrated that the JAK–STAT signaling pathway was significantly enriched in melanocytes with high MED15 expression (Figure 2H).
To experimentally validate these observations, MED15 was overexpressed in MC-1 melanocytes with or without the JAK inhibitor Ruxolitinib. Quantitative PCR confirmed substantial MED15 upregulation in the overexpression group. Notably, while Ruxolitinib does not directly inhibit the constitutive plasmid promoter, it partially attenuated the overall MED15 mRNA levels (Figure 3A), likely by blocking the endogenous STAT1-driven positive feedback loop. Functionally, MED15 overexpression markedly reduced melanocyte proliferative activity, while Ruxolitinib treatment partially restored cell viability (Figure 3B).
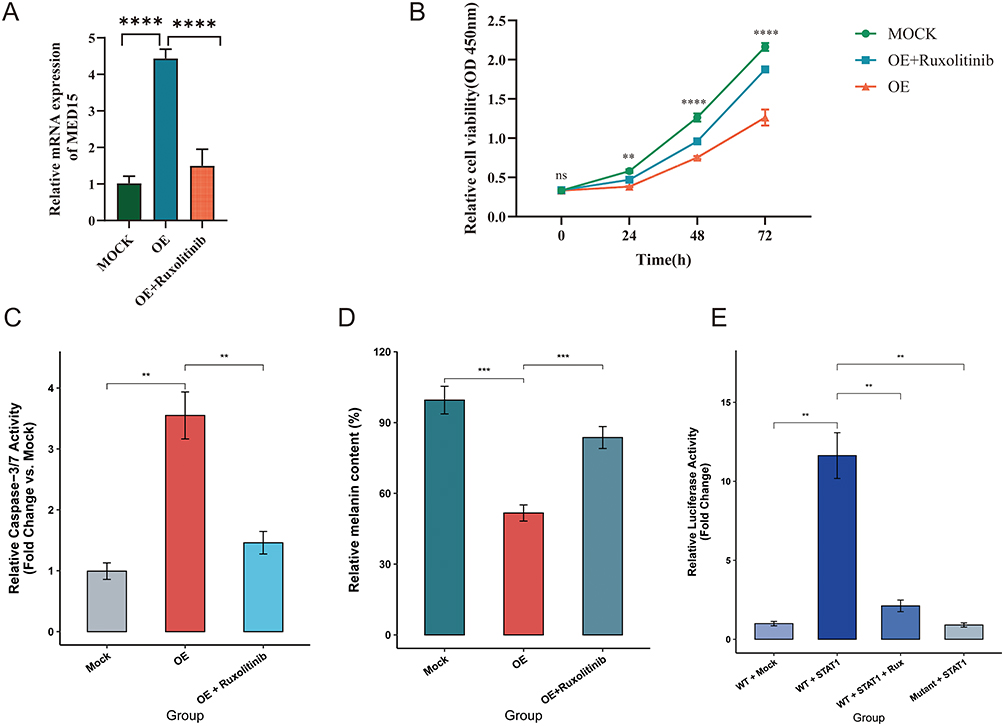 |
Figure 3 The STAT1–MED15 axis mediates melanocyte apoptosis and melanogenesis dysfunction. (A) Quantitative PCR results confirming MED15 upregulation in the overexpression (OE) group and partial attenuation of mRNA levels by Ruxolitinib treatment. (B) CCK-8 assay results showing MED15 overexpression markedly reduced melanocyte proliferative activity, while Ruxolitinib treatment partially restored cell viability. (C) Relative Caspase-3/7 activity. MED15 OE induced significant apoptosis, which was abrogated by Ruxolitinib. (D) Protein-normalized relative melanin content. MED15 OE impaired melanogenesis, and this defect was partially rescued by Ruxolitinib. (E) Dual-luciferase reporter assay. STAT1 directly transactivated the wild-type (WT) MED15 promoter, an effect completely abolished by either promoter mutation (Mut) or Ruxolitinib treatment. Data are shown as mean ± SD (n = 3). ns, not significant;**p < 0.01, *** p < 0.001, **** p < 0.0001 by one-way ANOVA with Tukey’s post-hoc test. |
To further elucidate whether the reduced melanocyte viability was driven by apoptosis, we assessed the intracellular Caspase-3/7 activity. Consistent with the CCK-8 results, MED15 overexpression triggered a profound pro-apoptotic response, evidenced by a highly significant increase in Caspase-3/7 activity compared to the Mock group (Figure 3C, P < 0.01). Strikingly, blocking the upstream JAK signaling with Ruxolitinib effectively abrogated this apoptotic cascade, returning Caspase-3/7 activity to near-basal levels (P < 0.01). This indicates that the JAK-STAT1-MED15 axis actively drives melanocyte depletion through the induction of apoptosis.
Furthermore, to determine whether the MED15-induced melanocyte dysfunction extends beyond proliferative inhibition to strictly impair melanogenesis, we quantified intracellular melanin content with total protein normalization. Consistent with the functional decline observed in vitiligo, overexpression of MED15 significantly impaired the melanogenic capacity of MC-1 cells, resulting in a marked reduction of relative melanin content to approximately 52% of the control level (Figure 3D, P < 0.001). Crucially, targeted blockade of the JAK pathway with Ruxolitinib partially but significantly rescued this functional deficit, restoring melanin synthesis to approximately 84% of the basal level (P < 0.01). These normalized data confirm that MED15 actively drives melanocyte functional impairment, and its detrimental effects on pigmentation can be therapeutically mitigated by JAK inhibition.
STAT1 Directly Transactivates the MED15 Promoter in a JAK-Dependent Manner
While our transcriptomic and cellular assays indicated that the JAK-STAT axis acts upstream of MED15, we sought to definitively confirm whether STAT1 directly regulates MED15 transcription. As shown in Figure 3E, overexpression of STAT1 resulted in a robust, multi-fold increase in the luciferase activity driven by the wild-type MED15 promoter (P < 0.01). Crucially, site-directed mutagenesis of the putative STAT1 binding site within the promoter completely abolished this transcriptional activation, returning the luciferase signal to baseline levels. Furthermore, the robust activation of the wild-type promoter was significantly abrogated when cells were treated with the JAK1/2 inhibitor Ruxolitinib (P < 0.01). Collectively, these dual-luciferase reporter results provide unequivocal molecular evidence that MED15 is a direct transcriptional target of STAT1, and that this physical DNA-binding interaction is strictly governed by the upstream JAK signaling cascade.
Discussion
In this study, we combined multi-omics association analyses, single-cell transcriptomics, and functional validation to identify MED15 as a downstream effector of the JAK–STAT pathway that contributes to melanocyte dysfunction in vitiligo. Cross-tissue and single-tissue TWAS, together with COJO and SMR analyses, consistently highlighted MED15 as a gene whose expression is genetically linked to vitiligo susceptibility. Single-cell RNA-sequencing confirmed that MED15 is predominantly expressed in melanocytes and significantly upregulated in lesional skin. Correlation analysis revealed a positive association between MED15 and STAT1, implicating STAT1 as a potential upstream transcriptional regulator. Functional experiments further demonstrated that MED15 overexpression reduced melanocyte proliferation and triggered significant apoptosis (as evidenced by elevated Caspase-3/7 activity), while JAK inhibition by Ruxolitinib intercepted upstream STAT1 activation and effectively protected cells from apoptotic death.
Importantly, by employing a strictly protein-normalized melanin assay, we confirmed that MED15 overexpression profoundly suppresses the intrinsic melanogenic capacity of individual melanocytes, rather than merely reducing the total cell pool through anti-proliferative effects. This provides direct functional evidence linking the JAK-STAT1-MED15 axis to the loss of pigmentation in vitiligo.
Mechanistically, MED15 encodes a Mediator complex subunit that bridges transcription factors and RNA polymerase II, thereby coordinating gene expression in response to extracellular stimuli (22–24). Aberrant activation of the JAK–STAT pathway can promote inflammatory transcriptional reprogramming, and our findings extend this paradigm to melanocytes. Notably, our dual-luciferase reporter assay provided the missing mechanistic link by demonstrating that STAT1 physically binds to the specific motif within the MED15 promoter. The complete abolishment of promoter activity upon targeted mutation, coupled with the potent suppression achieved by Ruxolitinib, solidifies a direct “JAK-STAT1-MED15” transcriptional axis. This finding robustly explains the aberrant MED15 elevation observed in vitiligo lesional melanocytes and offers a precise molecular rationale for the intracellular therapeutic efficacy of JAK inhibitors.
From a translational perspective, these results emphasize the importance of integrating genetic and single-cell data to uncover melanocyte-intrinsic mechanisms in vitiligo, complementing previous studies that primarily focused on immune dysregulation. MED15 may serve as a biomarker reflecting JAK–STAT pathway activation. Crucially, MED15 may represent a complementary therapeutic target alongside JAK inhibition to enhance clinical repigmentation. Nevertheless, our findings are subject to several limitations. First, while we applied FDR corrections in our Supplementary Data, the reliance on nominal significance thresholds in the initial TWAS screening warrants cautious interpretation. Second, there is inherent population specificity in our multi-omics integration, as the GWAS data (FinnGen) was derived from a European-ancestry cohort, whereas the scRNA-seq validation dataset was of Asian origin. Third, our functional assays relied on the immortalized MC-1 cell line rather than primary human melanocytes, which may not perfectly fully recapitulate the in vivo microenvironment. Crucially, while our current data establish a strong association and a plausible pathogenic pathway, they do not definitively prove the ultimate direction of control in patients. Future studies employing in vivo models, primary melanocytes, direct IFN-γ stimulation assays, and MED15 knockdown rescue experiments are warranted to fully establish the causal chain and explore whether modulating MED15-dependent transcription could provide additional therapeutic benefits.
Data Sharing Statement
The datasets analyzed during the current study are available in the Mendeley Data repository (DOI: 10.17632/9m9t4xxg8b.1). The data supporting the findings of this study are publicly accessible and can be retrieved from the repository.
Ethics Declaration
The original studies under which the public datasets were collected received appropriate ethical approval and patient informed consent. As this study relies entirely on the secondary analysis of non-harmful, non-sensitive data from open, legal databases, it is exempt from new ethical review as per Article 32 of the Measures for Ethical Review of Life Science and Medical Research Involving Human Beings (National Science and Technology Ethics Committee, China).
Disclosure
The authors report no conflicts of interest in this work.
References
1. Bergqvist C, Ezzedine K. Vitiligo: a review. Dermatology. 2020;236(6):571–11. doi:10.1159/000506103
2. Alikhan A, Felsten LM, Daly M, Petronic-Rosic V. Vitiligo: a comprehensive overview Part I. Introduction, epidemiology, quality of life, diagnosis, differential diagnosis, associations, histopathology, etiology, and work-up. J Am Acad Dermatol. 2011;65(3):473–491. doi:10.1016/j.jaad.2010.11.061
3. Qi F, Liu F, Gao L. Janus kinase inhibitors in the treatment of vitiligo: a review. Front Immunol. 2021;12:790125. doi:10.3389/fimmu.2021.790125
4. Rashighi M, Agarwal P, Richmond JM, et al. CXCL10 is critical for the progression and maintenance of depigmentation in a mouse model of vitiligo. Sci Transl Med. 2014;6(223):223ra23. doi:10.1126/scitranslmed.3007811
5. Rashighi M, Harris JE. Interfering with the IFN-γ/CXCL10 pathway to develop new targeted treatments for vitiligo. Ann Transl Med. 2015;3(21):343. doi:10.3978/j.issn.2305-5839.2015.11.36
6. Liu H, Wang Y, Le Q, Tong J, Wang H. The IFN-γ-CXCL9/CXCL10-CXCR3 axis in vitiligo: pathological mechanism and treatment. Eur J Immunol. 2024;54(4):e2250281. doi:10.1002/eji.202250281
7. Ferreira C, King B, Torres T. JAK inhibitors for the treatment of vitiligo: current evidence and emerging therapeutic potential. Drugs. 2025;85(12):1521–1534. doi:10.1007/s40265-025-02246-1
8. Shen C, Gao J, Sheng Y, et al. Genetic susceptibility to vitiligo: GWAS approaches for identifying vitiligo susceptibility genes and loci. Front Genet. 2016;7:3. doi:10.3389/fgene.2016.00003
9. Jin Y, Andersen G, Yorgov D, et al. Genome-wide association studies of autoimmune vitiligo identify 23 new risk loci and highlight key pathways and regulatory variants. Nat Genet. 2016;48(11):1418–1424. doi:10.1038/ng.3680
10. Jin Y, Birlea SA, Fain PR, et al. Genome-wide association analyses identify 13 new susceptibility loci for generalized vitiligo. Nat Genet. 2012;44(6):676–680. doi:10.1038/ng.2272
11. Mai J, Lu M, Gao Q, Zeng J, Xiao J. Transcriptome-wide association studies: recent advances in methods, applications and available databases. Commun Biol. 2023;6(1):899. doi:10.1038/s42003-023-05279-y
12. Kurki MI, Karjalainen J, Palta P, et al. FinnGen provides genetic insights from a well-phenotyped isolated population. Nature. 2023;613(7944):508–518. doi:10.1038/s41586-022-05473-8
13. Hu Y, Li M, Lu Q, et al. A statistical framework for cross-tissue transcriptome-wide association analysis. Nat Genet. 2019;51(3):568–576. doi:10.1038/s41588-019-0345-7
14. Gusev A, Ko A, Shi H, et al. Integrative approaches for large-scale transcriptome-wide association studies. Nat Genet. 2016;48(3):245–252. doi:10.1038/ng.3506
15. Yang J, Ferreira T, Morris AP, et al. Conditional and joint multiple-SNP analysis of GWAS summary statistics identifies additional variants influencing complex traits. Nat Genet. 2012;44(4):
16. Zhu Z, Zhang F, Hu H, et al. Integration of summary data from GWAS and eQTL studies predicts complex trait gene targets. Nat Genet. 2016;48(5):481–487. doi:10.1038/ng.3538
17. Xu Z, Chen D, Hu Y, et al. Anatomically distinct fibroblast subsets determine skin autoimmune patterns. Nature. 2022;601(7891):118–124. doi:10.1038/s41586-021-04221-8
18. Hao Y, Hao S, Andersen-Nissen E, et al. Integrated analysis of multimodal single-cell data. Cell. 2021;184(13):3573–3587.e29. doi:10.1016/j.cell.2021.04.048
19. Korsunsky I, Millard N, Fan J, et al. Fast, sensitive and accurate integration of single-cell data with Harmony. Nat Methods. 2019;16(12):1289–1296. doi:10.1038/s41592-019-0619-0
20. Yu G, Wang LG, Han Y, He QY. clusterProfiler: an R package for comparing biological themes among gene clusters. OMICS. 2012;16(5):284–287. doi:10.1089/omi.2011.0118
21. Liberzon A, Birger C, Thorvaldsdóttir H, Ghandi M, Mesirov JP, Tamayo P. The molecular signatures database (MSigDB) hallmark gene set collection. Cell Syst. 2015;1(6):417–425. doi:10.1016/j.cels.2015.12.004
 © 2026 The Author(s). This work is published and licensed by Dove Medical Press Limited. The
full terms of this license are available at https://www.dovepress.com/terms
and incorporate the Creative Commons Attribution
- Non Commercial (unported, 4.0) License.
By accessing the work you hereby accept the Terms. Non-commercial uses of the work are permitted
without any further permission from Dove Medical Press Limited, provided the work is properly
attributed. For permission for commercial use of this work, please see paragraphs 4.2 and 5 of our Terms.
© 2026 The Author(s). This work is published and licensed by Dove Medical Press Limited. The
full terms of this license are available at https://www.dovepress.com/terms
and incorporate the Creative Commons Attribution
- Non Commercial (unported, 4.0) License.
By accessing the work you hereby accept the Terms. Non-commercial uses of the work are permitted
without any further permission from Dove Medical Press Limited, provided the work is properly
attributed. For permission for commercial use of this work, please see paragraphs 4.2 and 5 of our Terms.