Back to Journals » International Journal of Nanomedicine » Volume 16
Investigating Halloysite Nanotubes as a Potential Platform for Oral Modified Delivery of Different BCS Class Drugs: Characterization, Optimization, and Evaluation of Drug Release Kinetics
Authors Husain T ![]() , Shoaib MH
, Shoaib MH ![]() , Ahmed FR, Yousuf RI
, Ahmed FR, Yousuf RI ![]() , Farooqi S
, Farooqi S ![]() , Siddiqui F, Imtiaz MS, Maboos M, Jabeen S
, Siddiqui F, Imtiaz MS, Maboos M, Jabeen S
Received 1 January 2021
Accepted for publication 17 February 2021
Published 1 March 2021 Volume 2021:16 Pages 1725—1741
DOI https://doi.org/10.2147/IJN.S299261
Checked for plagiarism Yes
Review by Single anonymous peer review
Peer reviewer comments 3
Editor who approved publication: Dr Thomas Webster
Tazeen Husain, Muhammad Harris Shoaib, Farrukh Rafiq Ahmed, Rabia Ismail Yousuf, Sadaf Farooqi, Fahad Siddiqui, Muhammad Suleman Imtiaz, Madiha Maboos, Sabahat Jabeen
Department of Pharmaceutics, Faculty of Pharmacy and Pharmaceutical Sciences, University of Karachi, Karachi, 75270, Pakistan
Correspondence: Muhammad Harris Shoaib; Farrukh Rafiq Ahmed
Department of Pharmaceutics, Faculty of Pharmacy and Pharmaceutical Sciences, University of Karachi, Karachi, 75270, Pakistan
Email [email protected]; [email protected]
Purpose: This study systematically investigated the potential of four model drugs (verapamil HCl, flurbiprofen, atenolol, and furosemide), each belonging to a different class of Biopharmaceutics Classification Systems (BCS) to be developed into oral modified release dosage forms after loading with halloysite nanotubes (HNTs).
Methods: The drugs were studied for their loading (mass gain %) by varying solvent system, method, pH, and ratios of loading into the nanotubes using D-optimal split-plot design with the help of Design Expert software. Drug-loaded halloysites were characterized by XRD, DTA, FTIR, SEM, and HPLC-UV-based assay procedures. Dissolution studies were also performed in dissolution media with pH 1.2, 4.5, and 6.8. Moreover, the optimized samples were evaluated under stress stability conditions for determining prospects for the development of oral dosage forms.
Results: As confirmed with the results of XRD and DTA, the drugs were found to be converted into amorphous form after loading with halloysite (HNTs). The drugs were loaded in the range of ∼ 7– 9% for the four drugs, with agitation providing satisfactory and equivalent loading as compared to vacuum plus agitation based reported methods. FTIR results revealed either only weak electrostatic (verapamil HCl and flurbiprofen) or no interaction with the surface structure of the HNTs. The dissolution profiling depicted significantly retarded release of drugs with Fickian diffusion from a polydisperse system as a model that suits well for the development of oral dosage forms. HPLC-UV-based assay indicated that except furosemide (BCS class IV), the other three drugs are quite suitable for development for oral dosage forms.
Conclusion: The four drugs investigated undergo phase transformation with HNTs. While agitation is an optimum method for loading drugs with various physicochemical attributes into HNTs; solvent system, loading ratios and pH play an important role in the loading efficiency respective to the drug properties. The study supports the capability of developing HNT-based modified release oral dosage forms for drugs with high solubility.
Keywords: halloysite nanotubes, HNT, biopharmaceutics classification system, drug release kinetics, verapamil HCl, flurbiprofen, atenolol, furosemide, XRD, DTA, FTIR, SEM
Introduction
Halloysite (Al2Si2O5(OH)4.nH2O) is a concentrically arranged bi-layered (1:1) aluminosilicate clay that is chemically similar to kaolin. A principal type of the clay particles is constituted of a hollow tubular structure in the submicrometer range (500–1000 nm) with a negatively charged silica outer surface and positively charged alumina lumen over the physiologically relevant pH range of 2–8.1 This tubular sub-micro- and nanostructure with a luminal diameter of 5–100 nm has high aspect (length to diameter) ratio, typically in the range of 10–15, with 14–46.8% mesoporous surface.2 Moreover, halloysite nanotubes have a relatively low density (2.14–2.59 g/cm3) as compared to other clay minerals owing to a large luminal space of 10.7–39%, due to which the density is also relatively low.3
Potential applications of HNTs as a drug delivery vehicle have been widely researched.4–9 In addition, the HNTs are reportedly biocompatible especially pertaining to their delivery from the oral route of administration.10,11 Therefore, HNTs-polymer nano-composites show great promise as drug containers.12,13 The drug-loaded HNTs-polymer composites have been formulated as powders, suspensions, and a fibrous scaffold, with many possible functions in drug/DNA delivery. Drug release from the HNTs can last thirty to one hundred times longer than the drug alone or in other carriers. Adding a polymer coating to the drug-loaded HNTs further retards the drug release.2
While many research groups have so far reported various studies on the potential applications of halloysite nanotubes as a novel drug delivery platform for different categories of drugs, very limited literature is available covering the systematic investigations of this material to build its case for a commercially viable oral drug delivery platform.8,14–18 Quite earlier, we had already demonstrated that HNTs are biocompatible concerning usage as an excipient for oral dosage forms by examining its in-vitro cytotoxicity and cytogenetic toxicity.11 In a relatively recent detailed investigation, we have also shown that HNTs can be used as a commercially viable multifunctional excipient for directly compressible immediate release dosage forms.19
The objective of the current study is to systematically characterize and investigate the drug release modifying potential of halloysite using design-of-experiment approach for 4 drugs, each representing a different class of the Biopharmaceutics Classification System (BCS). In the current study, firstly, the design of experiment (DoE) approach was used to statistically evaluate the influence of physicochemical factors, such as solubility and pH, and process parameters such as solvent conditions and method on the loading profile of the drugs.20 The four BCS representative drugs used in the study were verapamil HCl (class I), flurbiprofen (Class II), atenolol (class III), and furosemide (class IV).20–26 These drugs were selected based on their physicochemical characteristics, thermal and aqueous stability, and suitable dose. Scanning electron microscopy (SEM), Fourier transform infrared (FTIR) spectroscopy and X-ray diffraction (XRD) analysis were performed to characterize drug-loaded halloysite nanotubes (HNTs). Furthermore, the drug-release kinetics were studied and analyzed to determine the empirical and mechanistic profile of the respective drugs of each BCS class. Finally, a content assay of the drug-loaded HNTs was also performed to determine compliance with the compendial requirements that strongly help make a case for the development of commercially viable dosage forms. Through this study, we expect to provide a framework for selecting drugs for future pre-formulation studies dealing with development of halloysite nanotubes (HNTs) based oral dosage forms.
Materials and Methods
Materials
Halloysite nanotubes were generously gifted by New Zealand China Clays Ltd (New Zealand). Verapamil hydrochloride and furosemide were kindly supplied by The Searle Company, Pakistan, whereas flurbiprofen and atenolol were provided by the Asian Continental, Pakistan, and ATCO Laboratories, respectively. Hydrochloric acid, sodium hydroxide, potassium dihydrogen phosphate, methanol, and ethanol were all procured from Sigma Aldrich, Darmstadt, Germany.
Design of Experiments
An extensive literature survey8,27–33 yielded four important parameters to be studied for their impact on drug loading. Since the parameters were both categoric and numeric, with continuous and discrete values, the D-optimal split-plot design was chosen to explore their effect on the response. Numeric factors, ratio (designated “a”) and pH (designated as “b”), and categoric factors, method (designated as “c”), and solvent (designated “d”) were investigated with percent weight gain as the response (see Table 1). The design generated 38 runs for each drug. A variable-response relationship was investigated using the quadratic model, and model significance was estimated by ANOVA (Restricted Maximum Likelihood [REML]; the level of significance, p≤0.05). The coefficient of determination (r2) values approaching unity indicated a close-fitting of the model. 3D response surface plots described the relationship between the variables and the effect on response.34,35
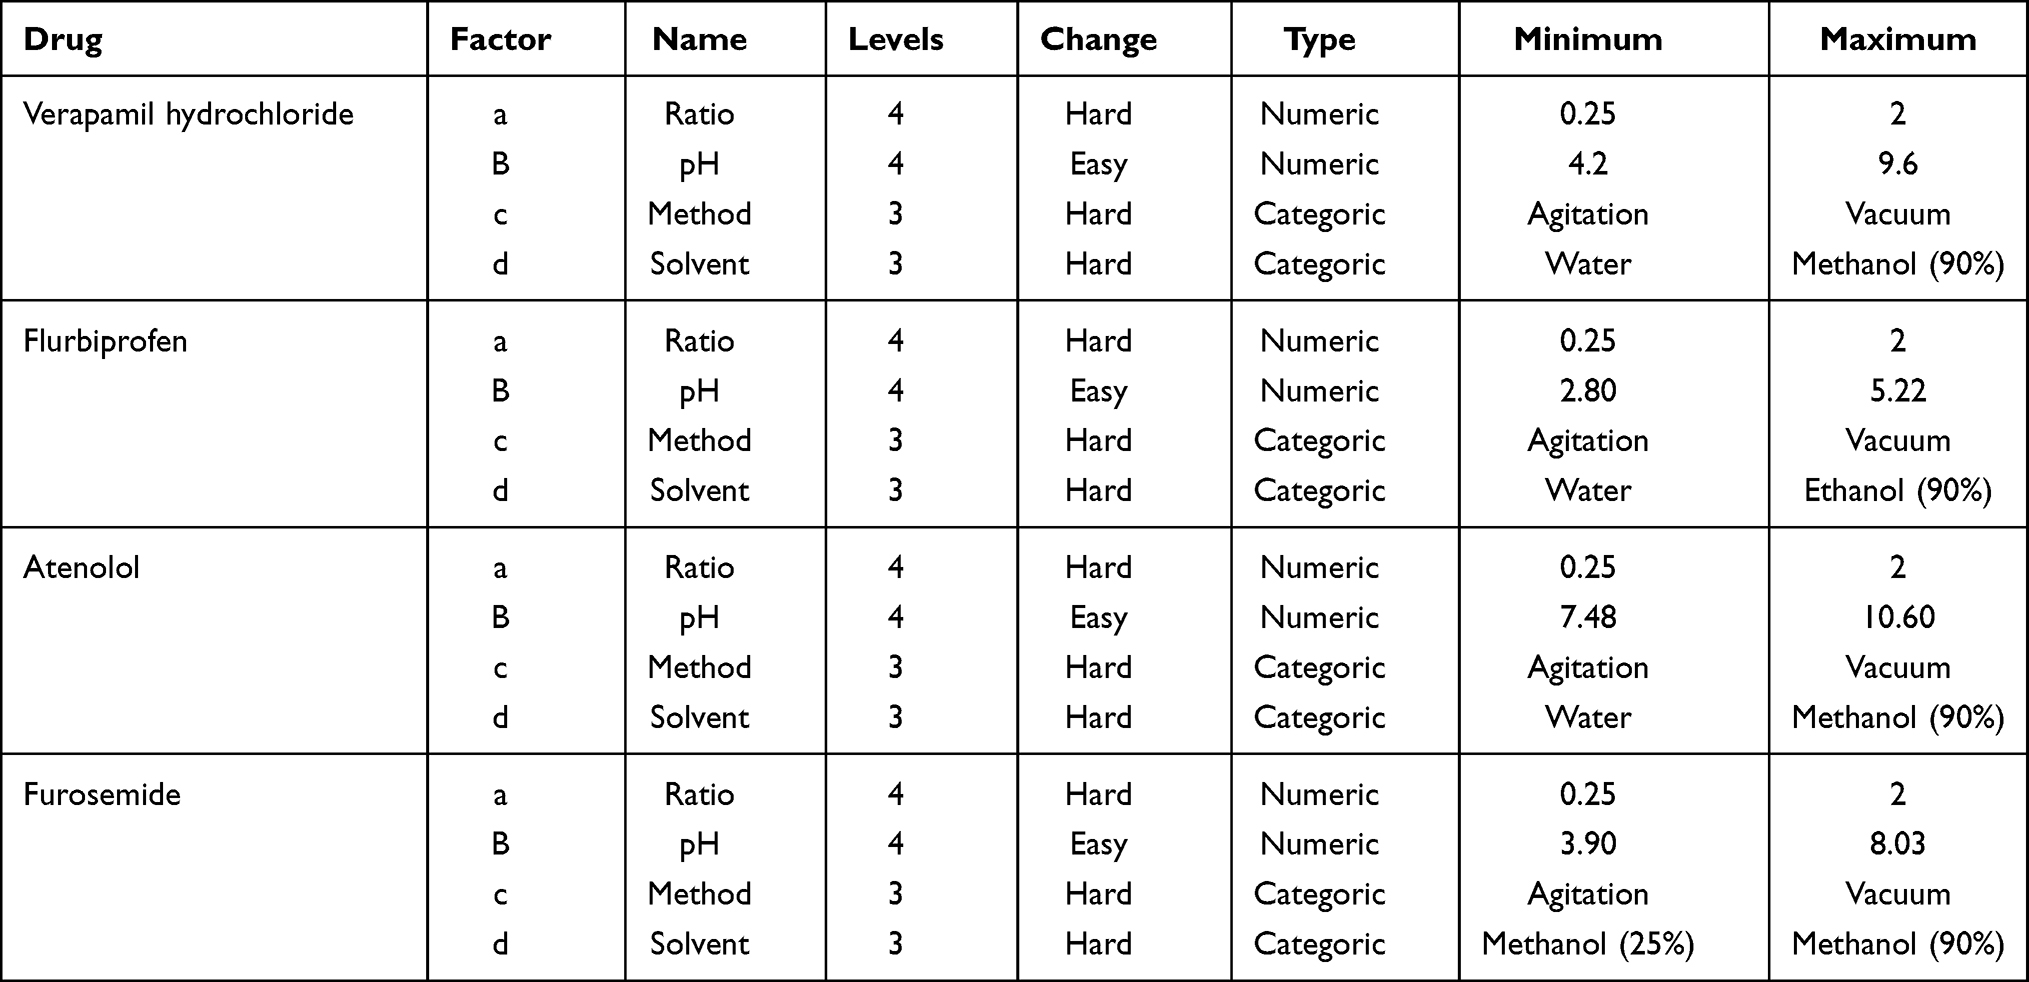 |
Table 1 Summary of Design Variables and Conditions for Drug-Loading Optimization Experiments |
Factors
Three different types of procedures were used for the loading of drugs inside halloysite nanotubes. (1) Impregnation technique (vacuum), (2) agitation, and (3) vacuum application followed by agitation were applied separately for the loading of drugs. In the impregnation technique, the vacuum of −30 mm of Hg was applied in three cycles of thirty minutes each.27 The samples were then filtered using a vacuum filtration assembly fitted with a 0.22µ filter and washed thrice before being placed overnight in a conventional oven for drying at 50ᵒC. Samples prepared by agitation were placed in an agitator for 24 hours at 250 rpm. The samples were then treated as described earlier, while samples prepared by a combination of the previous two methods first underwent vacuum procedure and were then agitated for 24 hours prior to filtration and drying. In each case, the initial mass of the halloysite was 3g. Halloysite used for drug loading was sieved prior to use but did not undergo any chemical pre-treatment.
The solvent system used varies depending on the solubility of each drug. For verapamil hydrochloride and atenolol, distilled water, 45:55 (%) and 90:10 (%) of methanol co-solvent with water were used each. For flurbiprofen, distilled water, ethanol, and water mixtures of 45:55 (%) and 90:10 (%) were used. For furosemide, 25%, 67.5%, and 90% methanol in water were used.
Four pH conditions were studied for each drug depending on its pKa value. pH values equalling pKa, pKa+1, pKa-1, and unaltered pH of drug solution were investigated for impact on the response.
The impact of ratios of “drug to HNT” on response was studied. For this purpose, four ratios of drug to HNTs (0.25:1, 0.5:1, 1:1, and 2:1) were used for drug-loading procedures.
Optimization
Experimental runs as described by Design Expert were carried out for each drug and numerical optimization was performed from the results obtained to ascertain the ideal process conditions to achieve a maximum possible response. See Table 2 for the optimization constraints applied for achieving maximum response. One-way ANOVA was used as a validation tool, and a p-value (<0.05 and <0.1) was used to define the significant variables. The best-fit equation describing the model were also generated.
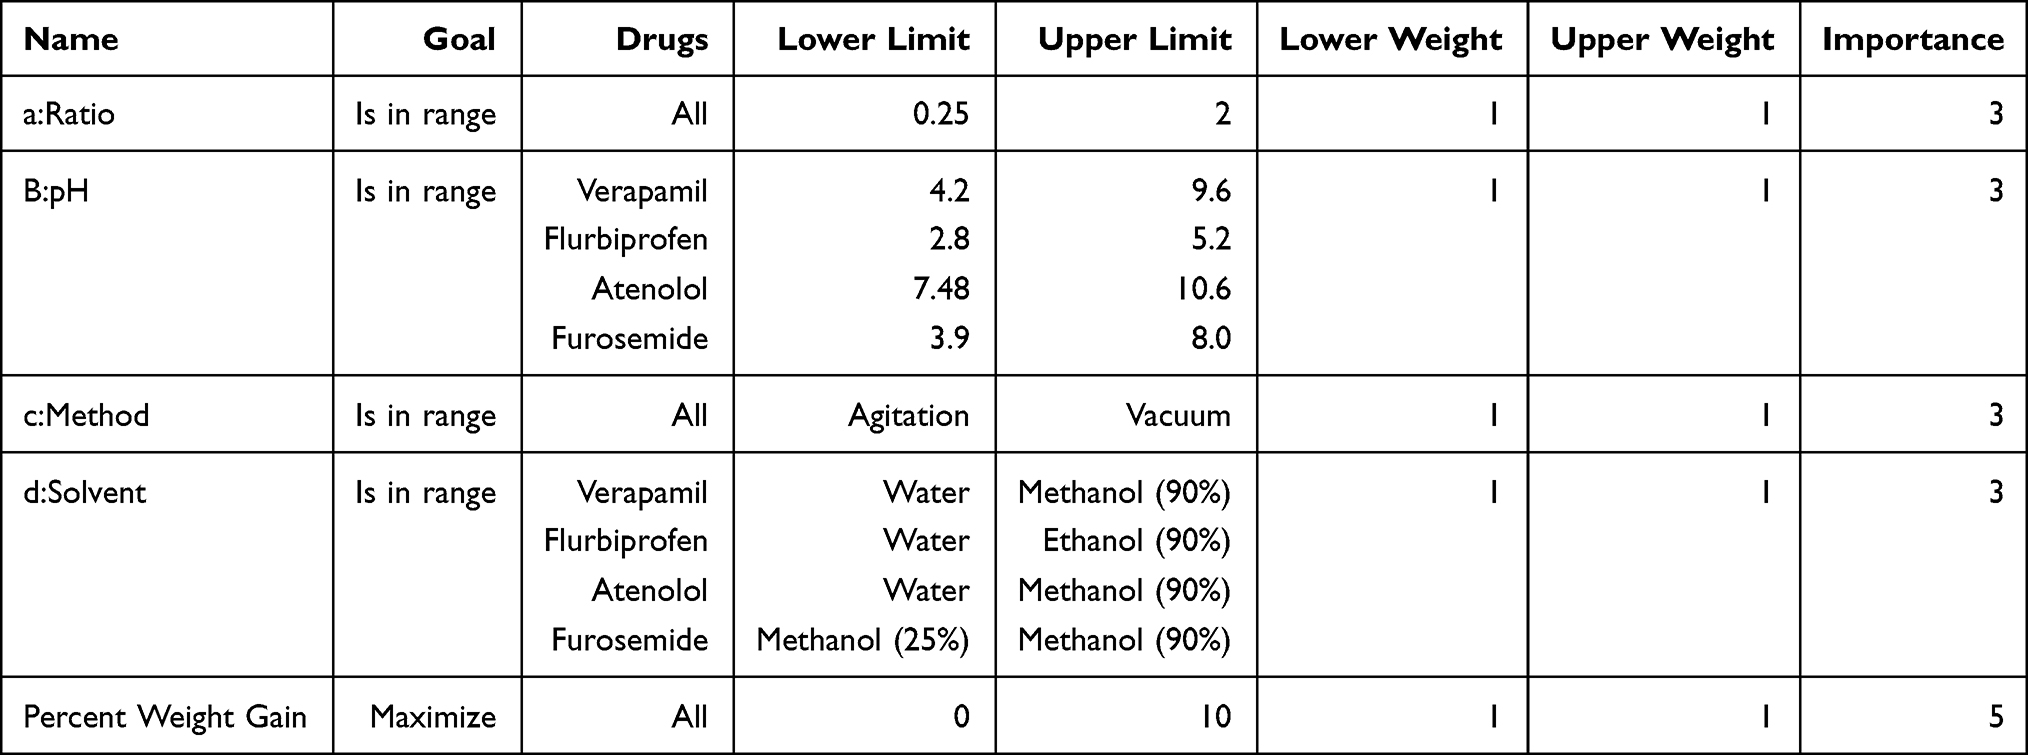 |
Table 2 Design Constraints for Variable Optimization Procedures for Drug-Loaded HNTs |
Response Variable
Mean weight gain (%) in triplicate was set as the response for the variables. Since samples were filtered and washed at the end of loading, any increase in weight is expected to be due to the presence of drug loaded inside the nanotubes.
Characterization of Drug-Loaded Halloysite Nanotubes
X-Ray Diffraction (XRD) Analysis
X-ray diffraction (XRD) data were obtained using a JOEL JDX-3532 diffractometer (JOEL, Japan). Powdered samples were scanned from 5° to 70° 2θ with an accelerating voltage of 20–40 kV and a current of 40 mA. The X-ray radiation source was Cu K-alpha with a scanning speed of 1°/minute. Powder samples were mounted on the XRD glass slide with stick backing of double-sided transparent tape.
Dynamic Thermal Analysis (DTA)
Dynamic Thermal Analysis was performed using a differential TG/DTA instrument (Pyris Diamond TG/DTA) by Perkin Elmers (USA). Approximately ~5 mg of samples were placed for isothermal DTA in the range of 40°C to 600°C with an increment of 10°C/min. The exposure to samples was shifted to nitrogen with a flow rate of 20 mL/min. The responses were recorded as microVolts (µV) with respect to exposed temperature (°C).
Fourier Transform Infrared (FTIR) Spectroscopy
FTIR spectra were recorded using a Nicolet Avatar 330 FT-IR (Thermo-Nicolet) along with OMNIC software for data analysis. Powdered samples were spread over the observation lens and scanned from 600 to 4000 cm−1.
Scanning Electron Microscopy
Visualization of nanotubes, pristine and drug-loaded, was done using a scanning electron microscope (JSM-6380A, JOEL, Japan). Samples were placed on the aluminum stud and sputter-coated with gold up to 250°A using auto coater (JFC-1500; JOEL) and examined under SEM at an accelerating voltage of 20 kV.
Dissolution Studies
Drug dissolution studies from powder samples were performed in 900 mL dissolution media (0.1N HCl pH 1.2, phosphate buffer pH 4.5, and phosphate buffer pH 6.8) using USP apparatus 1 (Erweka DT600, GmbH, Huesenstamm, Germany). Dissolution profiles were obtained using the procedure described by Levis and Deasy.32 Drug-loaded HNT samples were first placed in empty, unused teabags and sealed at the open end before being placed in baskets of the dissolution apparatus. Samples were withdrawn at 0.08, 0.25, 0.5, 0.75, 1, 2, 4, 6, 8, and 12 hours and were subsequently analyzed using UV-visible spectrophotometer UV-1800, Shimadzu Corporation, Kyoto, Japan at appropriate wavelengths (USP) for each drug. The experiments were carried out in triplicate.
Release Kinetics and Mechanism
Data obtained from dissolution studies were analyzed using excel based add-in software DDSolver to determine the release kinetics of the drugs in the media.36 The first 60% of the drug release data were analyzed.
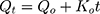
Zero-order release is described as being time dependent. Where Qo and Qt denote the initial amount of drug and amount of drug released at time t, and Ko is the rate constant.37,38
First-order drug release is concentration dependent. Hence, as time increases and the concentration of drug in dosage form decreases, the rate of release also decreases.
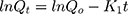
Qo and Qt denote the initial amount of drug and amount of drug released at time t, and Ko is the rate constant.37,38

This model states that the amount of drug released (Qt) is proportional to the square root of time t, with KH being the rate constant.37,38
This model is more useful for studying matrix systems and is more descriptive.

It describes the fraction of drug dissolved m as a function of time t, where the scale parameter α defines the timescale, and β describes the type of curve. Ti represents the latency time of release.37,38
This model can be used to describe drug release when release is limited by the rate of dissolution and where the surface area of the dosage form decreases gradually over time without any change in the shape of the formulation.
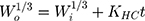
Where Wo and Wi represent the initial and final amount of drug in the system at time t and KHC.37,38
This model describes the release mechanism from planes, cylinders, and spheres as being either Fickian, anomalous, case I, or super case II, depending on the value of release exponent n.

Mt and M∞ denote the amount of drug released at time t and the amount of drug at equilibrium, and K is the release constant.37,38
This is based on the Higuchi model, and best describes drug release from spherical matrices.
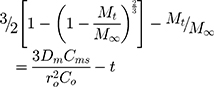
Where Mt is the amount of drug released at time t, M∞ is the amount released at an indefinite time; Dm is diffusion coefficient, Cms is drug solubility in the matric, and Co is the initial concentration of drug in the matrix. A modification of this equation for non-homogeneous matrices is

where Df is the diffusion coefficient, Cfs is the drug solubility in the liquid receptor, τ is the tortuosity factor of the capillary system, and ε is the porosity of the matrix.37,38
This model calculates the degree to which relaxational and diffusional mechanisms contribute to an anomalous drug release process.
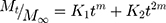
Where m, K1, and K2 are constants, Mt is the amount of drug released at time t, M∞ is the amount released at indefinite time.37,38
Content Assay
Pharmacopoeial methods were employed for determining content assay for each drug, and samples were prepared in triplicates. Sample preparation in each instance was modified such that for every 10mg of the drug in halloysite, 100mL of solvent was taken. The samples were then agitated for 24hrs at 250rpm before being centrifuged and filtered to separate the supernatant from which test samples were subsequently made. The details on the mobile phase and chromatographic conditions can be found in the Supplementary Methodology section of the Supplementary materials (see Supplementary Sections 1.1, 1.2, 1.3, and 1.4).39,40
Stability Evaluation
The stability evaluation of the optimized drug-loaded HNTs samples (n = 3) were subjected to long-term (12 months) stress stability (40°C ± 2; 75% RH ± 5) testing without packaging material in a stability chamber (NuAire, Plymouth, MN, USA).40,41 The samples were periodically removed 3, 6, and 12 months, and assay of the samples was performed using the methodology described in detail above (see Content Assay). The shelf-life of the products were calculated by using Minitab 17 software (Minitab, Pennsylvania, US)
Results and Discussion
Factors Affecting Drug Loading and Optimization
Four drugs (verapamil HCl, flurbiprofen, atenolol, and furosemide) belonging to each class of “Biopharmaceutics Classification System” (BCS) were loaded in halloysite nanotubes after following the procedure described in the methodology section whereby four factors (loading method, solvent system, pH and drug to HNTs ratio) were studied for their effect on drug loading (weight gain [%]) and their significance was evaluated (D-optimal split-plot design; see Tables S1–S8 in the Supplementary materials).
Among the two categoric factors studied (loading method and solvent systems), agitation alone for 24 h at 250 rpm was found sufficient for verapamil HCl, atenolol, and furosemide as compared to vacuum assisted approach (impregnation), and only in the case of flurbiprofen, vacuum-based impregnation followed by agitation for 24 h was found to be a relatively better method for maximum loading. This contrasts with the reported methods where the impregnation (vacuum) technique is widely used.1,13,29,31 It may be attributed to HNTs luminal dia. of ~15–50 nm whereby enough capillary pressure (~100–180 atm in water) is exerted to pull drug solutions inside.13 Moreover, Tan et al have also estimated that around 200 atm capillary pressure is produced by halloysite nanotubes with a luminal dia. of 7 nm.42
Verapamil HCl
As a BCS class 1 drug, verapamil HCl exhibited the highest loading efficiency (weight gain; ~7.03% at pH 4.2 and drug to HNT ratio of 1:4) in HNTs with water being the solvent, however, it was statistically insignificant as compared to other solvent conditions (methanol: water [45:55], [90:10]). Moreover, the projected weight gain was found to be ~9% at pH 4.2 and ratio of 1.125 through response surface evaluation (see Figure 1A). The two numeric factors (pH and loading ratio) were found to have an interaction whereby the pH significantly (p <0.05) influenced the drug loading in HNTs at lower drug to HNTs ratio (1:4) (see Table S5). Since the nature of drug is weakly basic (pKa = 8.7), it is likely that the lower pH values (higher degree of ionization of drug) for loading were more facilitative in intercalation with anionic silica surfaces of the nanotubes.43 Thus, enabling significant loading difference at lower loading ratios which were in marked contrast to conditions at the higher drug to HNTs ratio (2:1) where more drug availability per sample of nanotubes might have contributed and masked the differential effect. Overall, the solvent system (p < 0.1) and the pH (p <0.05) were found to influence the loading with a high level of interaction with other factors, and therefore among various models applied, a quadratic model (R2 = 0.87) (see Equation S1) was computed and found optimum to describe the relationship.
 |
Figure 1 3D response surface plots of weight gain (%) by halloysite nanotubes after drug loading at various drug-HNT ratios, pH values, methods* and solvent systems*. (A) Verapamil HCl, (B) flurbiprofen, (C) atenolol and (D) furosemide (*Optimum). |
Optimization of the categoric and numeric factors yielded the highest desirability (0.934) for drug to HNTs loading ratio of 1.24, distilled water as a loading medium with pH of 4.2 and 24 h agitation at 250 rpm as loading procedure (see Figure S1A). The computed highest expectation of drug loading and weight gain was found to be 9.24%, which was further confirmed experimentally. The mean weight gain (%) after experimentation in triplicate was found 9.32 ± 0.94% (CI 95%).
Flurbiprofen
Flurbiprofen is a BCS class II weakly acidic drug (pKa = 4.22).44 It exhibited the highest loading (8.603%) in an ethanol-water mixture (90:10) (see Figure 1B). Although the response (weight gain) was found to be affected by nearly all the factors except pH with some degree of interaction, the two significant factors were determined to be the ratio (p <0.05) and method of loading (p <0.1), whereby an equal proportion of drug and HNTs were found better for optimized loading (see Table S6). Although flurbiprofen is a weakly anionic drug, its overall solubility in aqueous solutions is significantly low as compared to organic solvents.45 Veerabadran et al have also suggested that the relatively hydrophobic drugs are better loaded in the HNTs with volatile solvents.8,44 In this regard, the pH has a very little role to play particularly in the case of flurbiprofen, where the solvent with a maximum loading of the drug was almost organic (90%). Among the various models applied, a quadratic model (R2 = 0.88) (see Equation S2) was found appropriate to describe the relationship between various factors and response.
Optimization through numerical approach yielded the highest desirability (1.00) (see Figure S1B) for a drug to HNTs loading ratio of 1.125, ethanol: water (90:10) mixture as being the solvent with pH of 4.8 and vacuum-assisted loading followed by 24 h of agitation at 250 rpm. The computed weight gain estimation of 8.828% was further confirmed by conducting experiments in triplicate, and the resultant weight gain was found to be 8.741± 0.958 (CI 95%).
Atenolol
Atenolol is a hydrophilic, weakly basic drug (pKa = 9.6) that belongs to BCS class III.46–49 However, it is highly soluble in methanol as well, and the use of a solvent system containing methanol: water (90:10) was found to create a larger concentration gradient due to the volatile nature of methanol and thus promoted higher drug loading.8 Except for the factor of pH, which had an overall interactive significance on the response, all other factors such as the ratio of drug to HNTs (p <0.01), method of loading (p <0.05), and solvent system (p <0.05) were found to significantly affect the loading of atenolol in HNTs (see Table S7). The most interesting finding here was the fact the, unlike the previous two drugs, the highest atenolol to HNTs loading ratio (2:1) was found to have the highest (weight gain 8.652%) drug loading at pH of 10.6 and solvent as methanol: water (90:10) (see Figure 1C). Again a quadratic model (R2 = 0.91) (see Equation S3) was found most suitable to discuss the relationship between various factors and response properly.
Numerical optimization for the highest weight gain (%) yielded the highest desirability (1.00) (see Figure S1C) for a procedure involving drug to HNTs loading ratio of 2:1, methanol: water (90:10) mixture as being the solvent with pH of 7.6 and 24 h of agitation at 250 rpm. The computed weight gain estimation of 8.672% was further confirmed by conducting experiments in triplicate, and the resultant weight gain was found to be 8.596± 1.284 (CI 95%).
Furosemide
Furosemide is a hydrophobic, weakly acidic drug (pKa = 3.9) that belongs to BCS class IV.50 The drug is slightly soluble in water (0.0731 mg/mL) and soluble in methanol.50 Among all the factors studied, a drug to HNTs ratio was found to be most significant (p <0.05) followed by pH (p <0.1) (see Table S8). The highest weight gain of ~8.70% was achieved for 2:1 drug to HNTs ratio with 90:10 methanol: water being the solvent at a pH of 8.0 (see Figure 1D). However, for most of the other cases the weight gain did not go beyond 5.25%.
During optimization procedure, maximum desirability of 0.882 with a highest weight gain of 8.16% (see Figure S1D) was determined for a drug to HNTs ratio of 2:1, methanol:water (90:10) as a solvent with pH of 8.0 and simple method of agitation employed for 24h at 250 rpm. The experimental confirmation, however, resulted in a weight gain of only 8.05± 1.134% (CI 95%). As before, a quadratic equation (see Equation S4) best described the relationship between factors and response.
Characterization of Drug-Loaded Halloysite
X-Ray Diffraction (XRD) Analysis
X-ray diffraction analysis revealed that the halloysite nanotubes (HNTs) were largely present in nanotubular form as suggested from the characteristic peak at 20° 2θ51 (see XRD spectra in Figure 2). Moreover, the nanotubes were in a dehydrated state as evident from the peak at 12.10° 2Ɵ (basal spacing of mesoporous structure in nanotubes; 7.35A°) and absence of a sharp peak at ~8.76° 2Ɵ which is otherwise suggestive of the hydrated status of the nanotubes.4
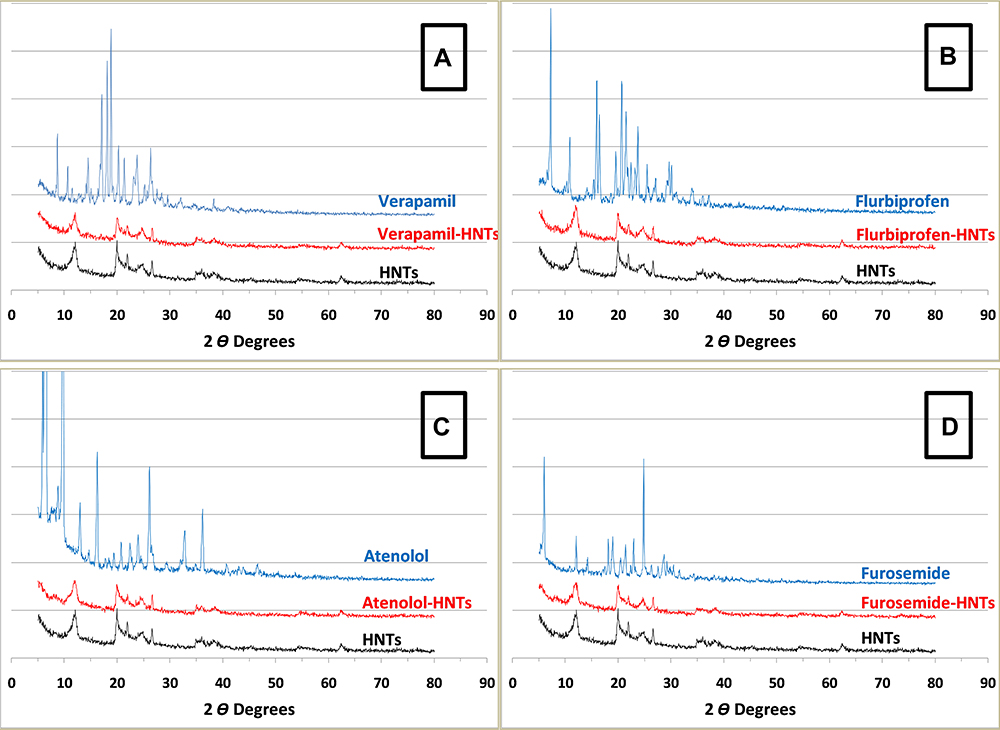 |
Figure 2 XRD plots of (A) unaltered halloysite, pristine verapamil hydrochloride and drug-loaded HNTs, (B) unaltered halloysite, pristine flurbiprofen and drug-loadedHNTs, (C) unaltered halloysite, pristine atenolol and drug-loaded HNTs and (D) unaltered halloysite, pristine furosemide and drug-loaded HNTs. |
The X-ray diffraction analysis of the drug-loaded halloysite nanotubes demonstrated that the drug material in all four instances was actually transformed into an amorphous state (owing to the wet loading procedure and possible adsorption of the drug onto their surfaces of nanotubes) since the characteristic peaks for the pure drugs were absent in the XRD plots of the drug-loaded composites (see Figure 2 showing HNTs, drug and drug-loaded nanotubes (a) verapamil, (b) flurbiprofen, (c) atenolol, (d) furosemide). These drugs (verapamil HCl, flurbiprofen, atenolol, and furosemide) have also been reported for physical process induced phase transformations.52–55 This transformation was further confirmed experimentally by dynamic thermal analysis (DTA) of the samples (see next section). This is similar to the finding observed with some of the earlier reported cases of drugs loaded into HNTs.42,56–58 Moreover, in all four instances of drug-loaded halloysite nanotubes, the full-width half-maxima (FWHM) of the characteristic peak at 12.10° 2Ɵ (d-spacing ~7.3 A°) was increased with stretch to both sides, suggesting a non-uniform strain between the concentric inter-layers of silica and alumina. This is likely due to the mesoporous presence of the drugs in the composite samples. A similar phenomenon was also observed for the characteristic peak of the luminal structure of the nanotubes at 20° 2Ɵ (d-spacing ~4.44 A°). Furthermore, the intensities of all the diffracted characteristic peaks were decreased in the drug-loaded composites, likely due to adsorption of the amorphous layer of the drug material on the surface and lumen of the nanotubes, as is also evident in SEM analysis (see Scanning Electron Microscopy (SEM)).
Dynamic Thermal Analysis (DTA)
Dynamic thermal analysis (DTA) was undertaken to confirm the phase conversion of the drug samples after loading into halloysite nanotubes (HNTs). The DTA graph of HNTs depicted the same thermal behavior as reported in the literature (see Figure 3). The DTA graph of verapamil HCl shows a sharp endothermic peak starting at 142°C, correspondings to its melting point. In the case of the verapamil loaded HNTs, a small endothermic bend was observed at around 90–110°C corresponding to the glass transition suggestive for the phase transformation of the drug after loading in HNTs. Moreover, in the pure drug, two exothermic events are also evident first at ~288–366°C corresponding to recrystallization before final decomposition starting at ~446°C. The composite displayed its fused recrystallization-decomposition peak starting at ~254°C.53
 |
Figure 3 DTA plots of (A) unaltered halloysite, pristine verapamil hydrochloride and drug-loaded HNTs, (B) unaltered halloysite, pristine flurbiprofen and drug-loaded HNTs, (C) unaltered halloysite, pristine atenolol and drug-loaded HNTs and (D) unaltered halloysite, pristine furosemide and drug-loaded HNTs. |
In the second case of flurbiprofen, the pure drug showed melting behavior at ~117°C, followed by decomposition at ~289°C. In the composite, the drug was again confirmed to have its phase transformed since no evident melting peak was observed. In contrast, a smooth curve with endothermic differential from ~64°C to 86°C and then exothermic differential from ~96°C to 271°C in comparison to pure halloysite was evident, indicative of the amorphous form of the drug.55
In the case of atenolol, the pure drug exhibited melting at 153°C followed by two exothermic events staring at 286°C and then 302°C that could be indicative of recrystallization followed by decomposition. In the composite, small differential endothermic bending occurred at 91°C. It is again suggestive of the drug-loaded into nanotubes undergoing glass transition instead of sharp melting due to phase transformation.52
Pristine furosemide exhibited a very brief but sharp melting at 210°C followed by decomposition at 215°C. These events were not observed in the composite materials and, similar to atenolol, loaded furosemide HNTs exhibited first an endothermal differential from 57°C to 78°C and then an exothermal differential from 89°C onwards, again suggestive of the phase transformation of the drug in the composites.54
Fourier Transform Infrared (FTIR) Spectroscopy
Samples of pristine and drug-loaded HNTs were analyzed using FTIR to detect any interactions in the latter (see Table 3). FTIR spectrum of HNTs exhibited two bands at 3696 cm−1 and 3621 cm−1, attributable to OH bending in the aluminol group. OH, bending vibrations can be observed at 3643 cm−1 and 1652 cm−1. Peaks at 1033 cm−1 and 1091 cm−1 indicated Si-O-Si stretching vibrations30 (see Figure S2–1A).
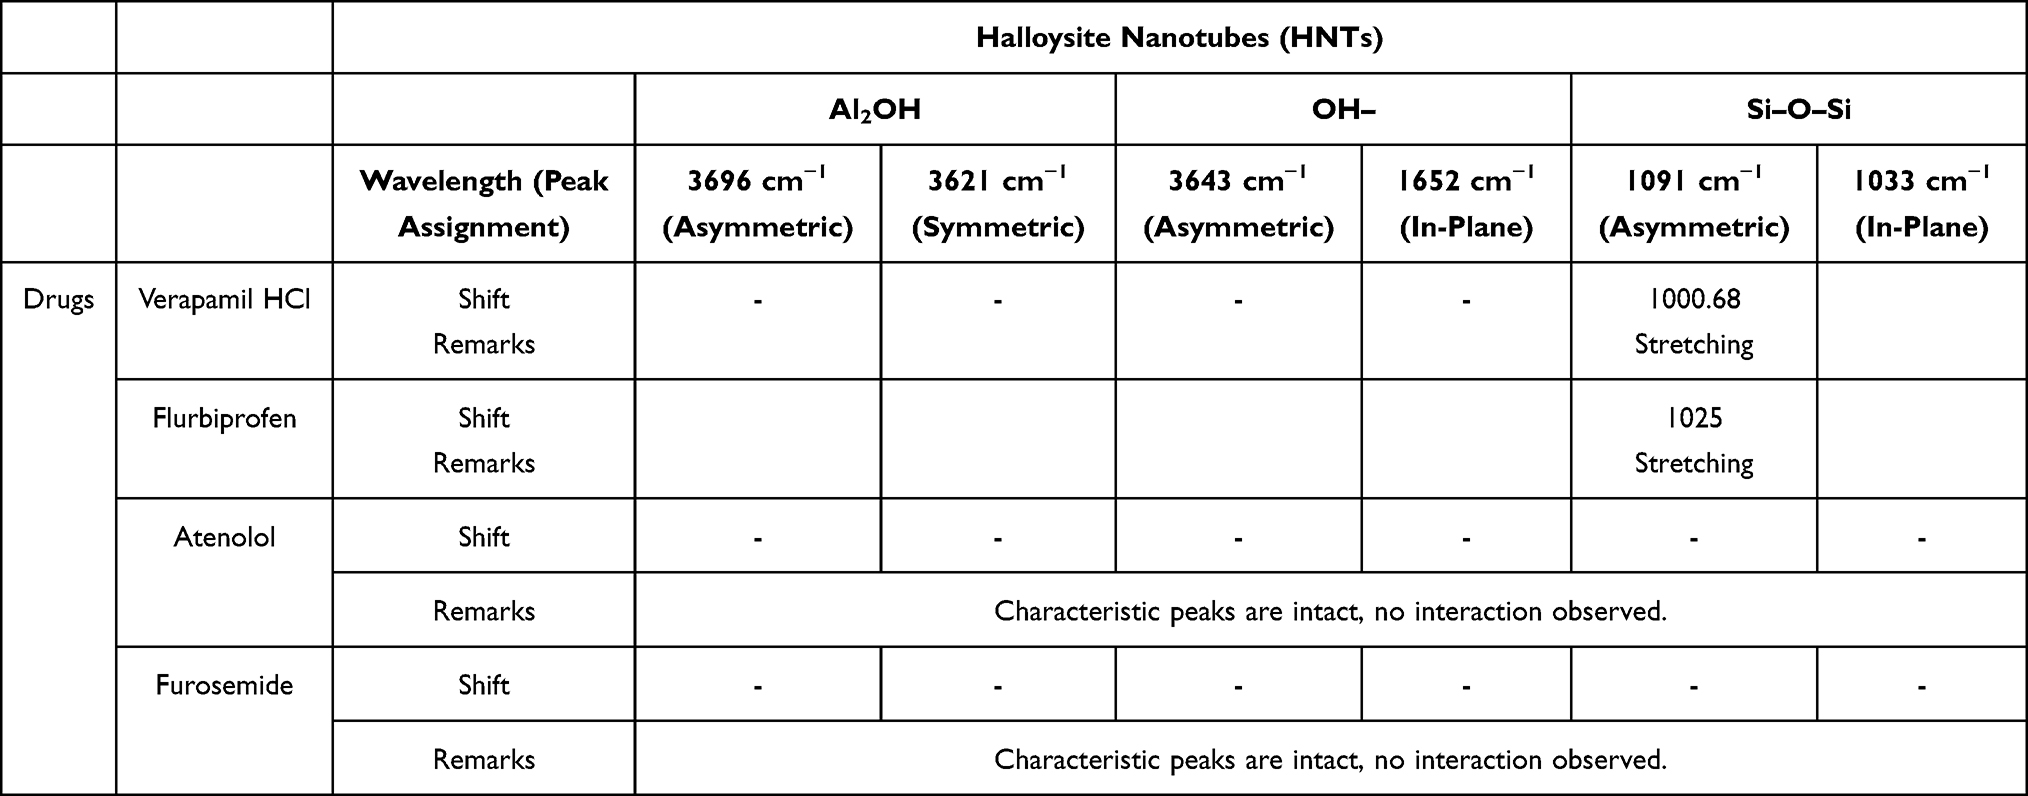 |
Table 3 Summary of Significant Findings in FTIR of Pristine and Drug-Loaded Halloysite |
In the case of verapamil loaded HNTs, a slight shift was observed in bands associated with Si-O-Si of HNTs (1091 cm−1 to 1000.68 cm−1) and the amine group of verapamil (from 1012 cm−1 to 1000.68 cm−1) (see Figure S2–1B and C)). This may be due to electrostatic interaction between negatively charged siloxane groups in halloysite and positively charged quaternary amines in the drug.
In the flurbiprofen loaded HNT samples, some interaction between drug and halloysite nanotubes was observed as evident from the slight stretching of Si-O-Si peaks to 1025 cm−1 in halloysite, and 3648 cm−1 and 1535 cm−1 in flurbiprofen attributed to C=O and C-F bonds, respectively, possibly due to electrostatic repulsion between the negatively charged carboxylic and fluoride groups of the drug and the negatively charged siloxane of HNT.(see Figures S2–1A and S2–2A and B))
FTIR spectra of atenolol and furosemide loaded HNTs did not reveal any major interactions since the characteristic peaks of Al2OH and Si-O-Si were found intact (see Figures S2–3 and S2–4).
Scanning Electron Microscopy (SEM)
SEM images were obtained for untreated halloysite and drug-loaded halloysite, as seen in Figure 4A Pristine HNTs at ×8000, Figure 4B ×25000 magnification, Figure 4C VER-HNT powder, Figure 4D FLU-HNT powder, Figure 4E ATN-HNT powder and 4(f) FUR-HNT powder. The pristine HNT samples underwent soaking and drying treatment to mimic the conditions of the drug-loaded HNTs. As a result of this treatment, agglomerates ranging in size up a few micrometers can be seen, with individual nanotubes protruding out them. At higher magnification (Figure 4B), the separate nanotubes are clearly visible with the dimensional length of submicron to 1 µm size range. Agglomerates can be seen in Figure 4C–F as well, in which drug material seems to be present in the form of a thin sheet, despite washing during loading. Individual nanotubes are visible, although the dispersed state of HNTs seen in pristine halloysite samples is no longer evident. Thus, the drug-loaded HNTs seem to act as a fine to very fine powder, rather than a nanotubular ultra-fine or micronized powder material.
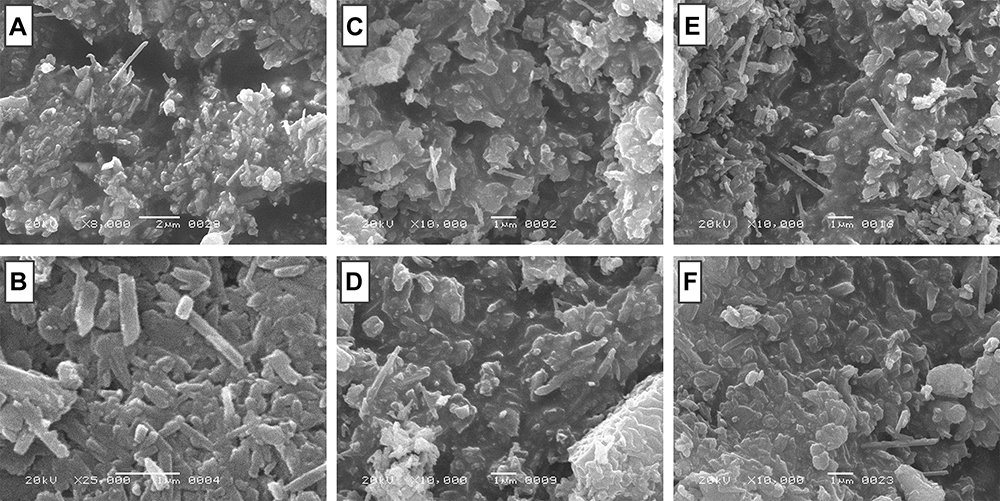 |
Figure 4 SEM images of (A) pristine HNTs at ×8000 and (B) ×25000 magnification and (C) VER-HNT powder, (D) FLU-HNT powder, (E) ATN-HNT powder and (F) FUR-HNT powder [scale bar (A) 2 µm, (B–F) 1 µm]. |
Dissolution Studies
The dissolution profiles of pristine drugs, along with release profiles of the corresponding drug-loaded HNT samples in 0.1N HCl (pH 1.2), pH 4.5, and pH 6.8 phosphate buffer, are shown in Figure 5A–C, respectively.
 |
Figure 5 Dissolution profiles of drug-halloysite powder and pristine drugs in (A) 0.1N HCl, pH 1.2, and phosphate buffers, (B) pH 4.5 and (C) 6.8. |
Rapid and complete dissolution of the pristine verapamil HCl was observed in pH 1.2 medium. However, the release rate was markedly delayed after loading onto halloysite nanotubes. 71.781 ± 2.59% drug was released by the second hour of testing, 91.182 ± 3.01% by 8th hour, and 98.937 ± 2.62% drug was released from the sample by the 12th hour. Generally, for an extended-release product, a 20–30% release is expected by the second hour and more than 80% by the last time point.59 In phosphate buffer (pH 4.5), the pristine drug dissolved almost completely (99.84%) within 30 minutes. The release of the drug from halloysite, however, was considerably delayed. While burst release was observed, with 56.074 ± 1.72% drug released at 2 hr, only 77.786 ± 2.84% drug was released by the 12th hour. In phosphate buffer (pH 6.8), verapamil hydrochloride dissolved quickly. Burst release was also seen from the loaded samples in this media as well, and 97±3.00% drug was released by the 8th hour and 101.182 ± 1.06% by the 12th hour. Burst release observed with this drug may be because the drug, being cationic, might have been adsorbed mainly on the outer surface (silica) of the halloysite nanotubes. This is also supported by XRD spectra. Theoretically, the portion of the drug that was entrapped within the lumen of the halloysite (due to capillary action of the nanotubes as discussed by Tan et al42) would then be responsible for the sustained release effect seen with this sample of drug-loaded halloysite. The electrostatic interaction between the cationic functional groups of the drug and the anionic siloxane groups of HNT observed by FTIR analysis could also contribute to delayed-release.
Flurbiprofen is a weakly acidic drug with low aqueous solubility at acidic pH values.60 Accordingly, it was found that in the dissolution medium of pH 1.2, only 6.656% of the pure drug had dissolved by the 12th hour, and 10.792 ± 1.31% drug had been release been released from loaded samples. In the dissolution medium of pH 4.5, flurbiprofen dissolved incompletely by the 12th hour (22.072 ± 2.55%). The release of drug from drug-loaded halloysite was also slow, burst release was not observed, and 34.705 ± 2.71% of the drug was released at the endpoint. In pH 6.8 phosphate buffer, the solubility of the drug was considerably higher due to its weakly acidic nature, and it dissolved completely by the 12th hour. Drug release from powdered flurbiprofen-halloysite composite was 104.038 ± 3.25% at the endpoint. Burst release was observed as well, with over 54% of the drug being released from loaded samples by 2nd hour.
Atenolol is a weakly basic drug with a high degree of water solubility that dissolves completely within one hour in the dissolution medium of pH 1.2. However, drug release from composite material was delayed, with only 75.586 ± 3.09% released by the 12th hour. Burst effect was observed in the powdered composite as 65.795 ± 1.393% drug was released by the second hour of testing. In pH 4.5 phosphate buffer, pristine atenolol dissolved completely by the second hour (100.54%). Drug release from halloysite was considerably slower, and while burst effect was observed (70.228 ± 1.91% at 2 hr), 98.871±3.34% of the drug was dissolved by the twelfth hour. In pH 6.8 phosphate buffer, the weakly basic drug did not dissolve as quickly, with pristine drug achieving maximum dissolution (102.436 ± 3.933%) at 4 hours. The drug-loaded halloysite powder displayed burst release (53.402 ± 3.154% at 2 hr) and released only 68.673 ± 1.183% of the drug by end time.
Similar to the present findings, Hosseini-Aghdam and his associates found that in pH 1.2, 4.5, and 6.8, ATN-loaded HNTs showed initial burst release followed by sustained release. They theorized that hydrogen bonding and electrostatic interaction between drug and halloysite, and drug entrapment within the halloysite lumen might be the reason for such a release profile. They also found the release to be pH-dependent.61
Furosemide is a BCS class 4 drug, displaying low aqueous solubility. It is a weakly acidic drug and is dissolved to a greater degree in phosphate buffer of pH 6.8 (83.381 ± 3.283%) as compared to pH 1.2 and pH 4.5 dissolution media (11.146 ± 0.842% and 14.352 ± 2.99% dissolution at 12th hour, respectively).
Burst release was not observed in any of the media tested. By the end time point (12h), only 35.032±2.037% drug content had been released from the drug-loaded HNTs in pH 1.2 dissolution medium. In pH 4.5 phosphate buffer, 33.969 ± 2.17% drug was released from the loaded halloysite at the same time point, while in pH 6.8, 32.077 ± 2.332% drug was released. Moreover, the dissolution rate of pristine furosemide in each media is seen to be considerably slower than the release rate of the same drug from halloysite. This could be attributed to the conversion of the drug to its amorphous state, as discussed in X-Ray Diffraction (XRD) Analysis and Dynamic Thermal Analysis (DTA).
Veerabadran et al reported burst release of furosemide in the first ten minutes followed by release lasting 6–8 hours in media of pH 7.4. They further found that drug release from halloysite was retarded 75 times as compared to dissolution from drug crystals.8
Drug Release Kinetics
Drug release data was analyzed using several kinetic models (see Table 4). As an exploratory study, the use of both empirical and mechanistic kinetic models is justified to better study the release kinetics of the drugs from halloysite. While the empirical models provide information about the release curve/profile, mechanistic models are useful in determining/theorizing the exact mechanism of drug release from the nanotubes. For verapamil hydrochloride, with high solubility independent of pH, Weibull shape parameter values (ranging from 0.228 to 0.688) specified a parabolic release curve with high initial values indicating burst release, followed by a consistent exponential increase.38 Values of n (ranging from 0.137 to 0.335) obtained from the Korsmeyer–Peppas model signified that Fickian diffusion occurs from the polydisperse system formed by the multiple geometries of the powdered nanotubes.62
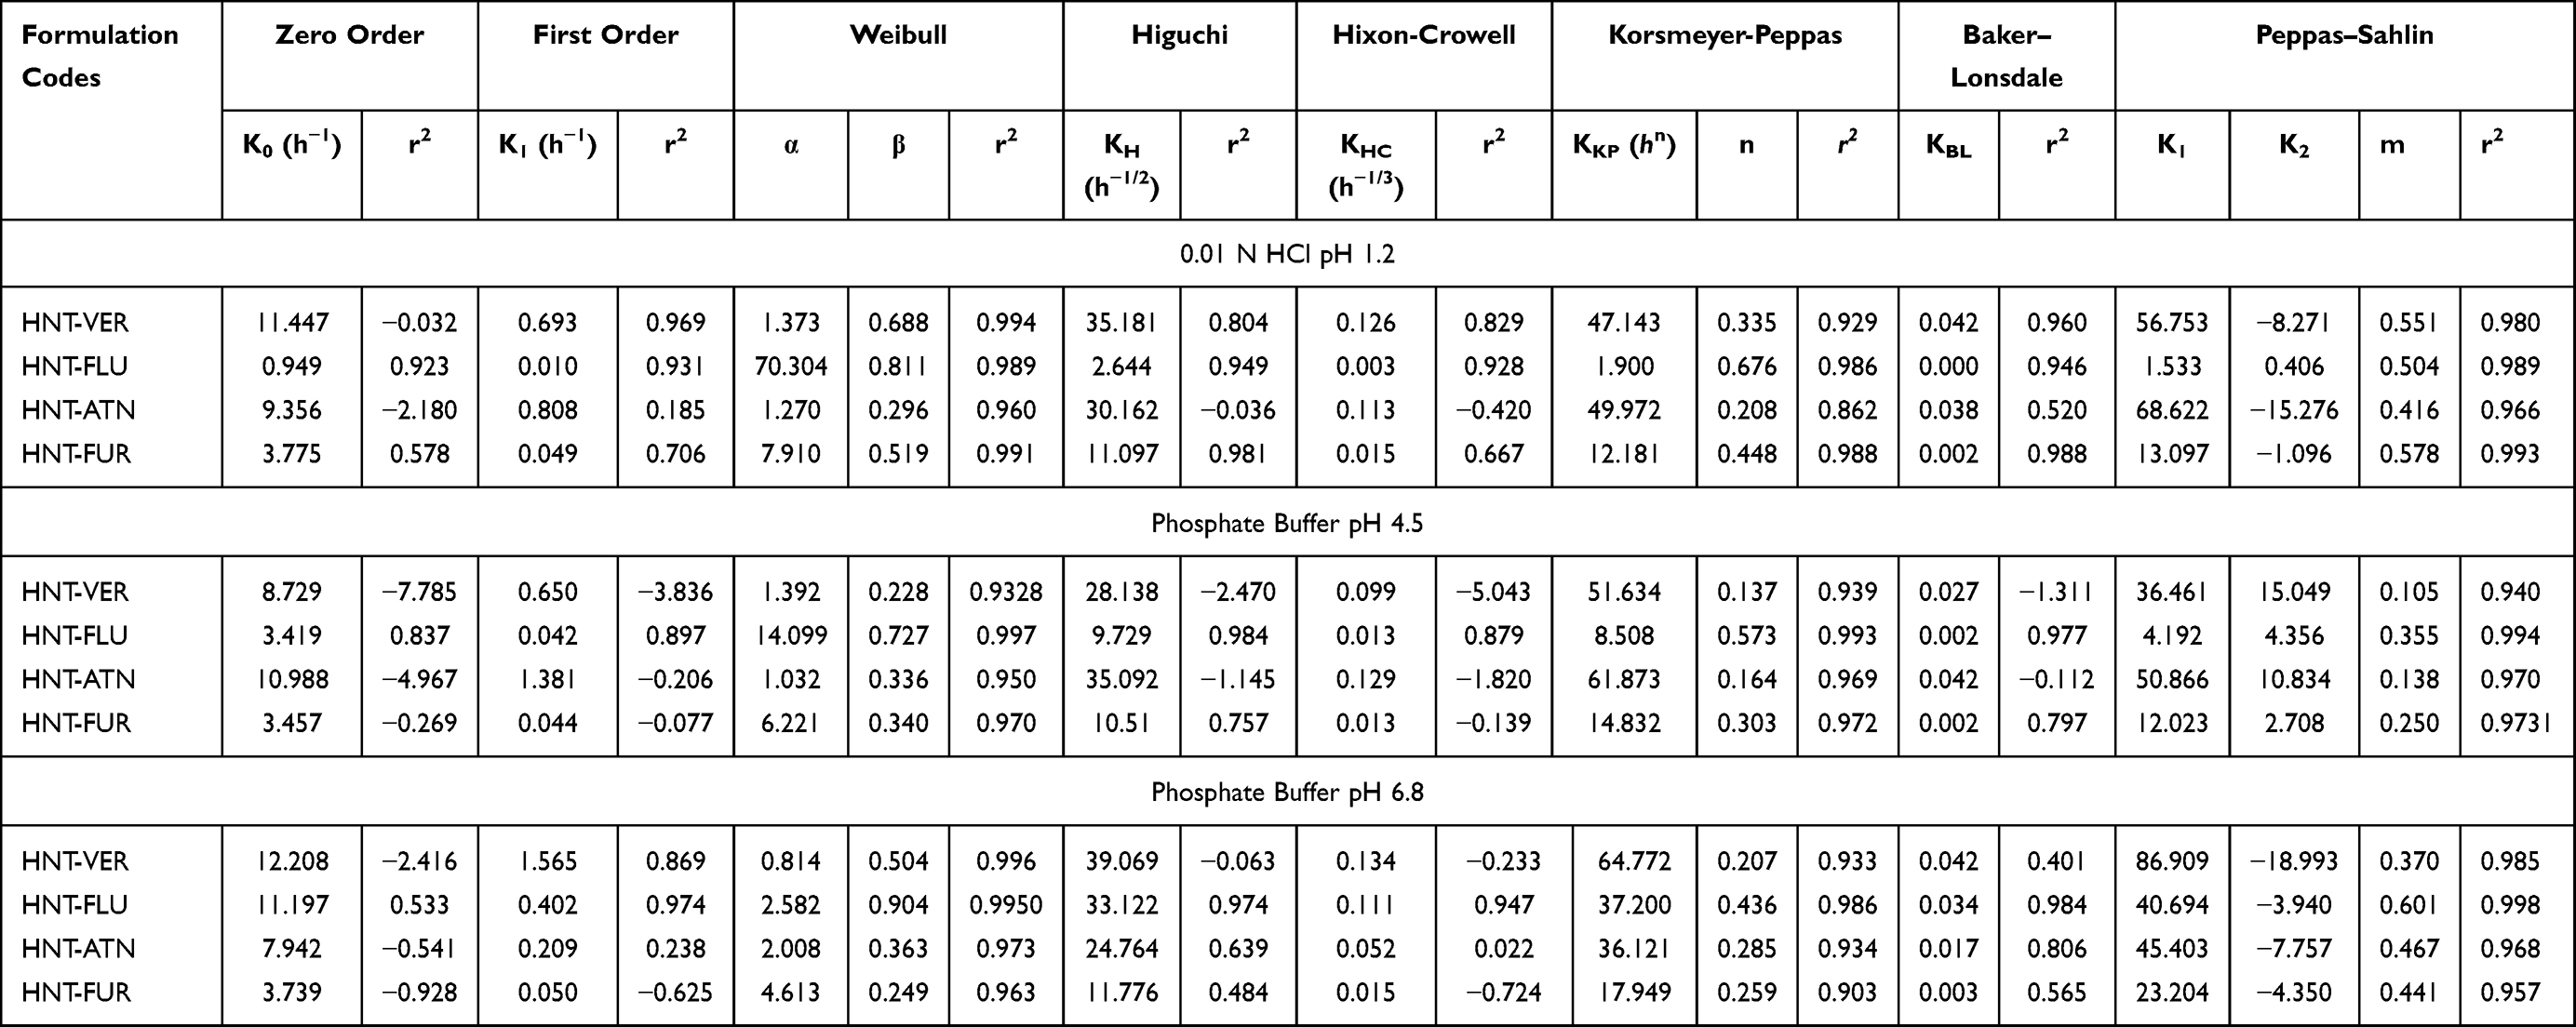 |
Table 4 Drug Release Kinetics of Drug-Loaded HNTs in 0.1N HCl, pH 1.2, and Phosphate Buffers pH 4.5 and 6.8 |
Traditional zero-order release kinetics were not closely followed by the drug-loaded halloysite, despite prolonged release. However, in the case of flurbiprofen-loaded HNTs, where the drug is released very slowly in pH 1.2 and 4.5 media due to pH-dependent solubility of the drug, a higher r2 value is found for zero-order drug release. Weibull shape parameter values (β ranging from 0.727 to 0.904) indicated that drug release follows a parabolic curve. Korsmeyer Peppas release exponent values (n ranging from 0.436 to 0.676) denoted that anomalous transport occurred from the cylindrical nanotubes.38
Drug release data from Atenolol-HNT powder displayed a parabolic release curve (β ranging from 0.296 to 0.363), signifying burst release occurred. Korsmeyer Peppas release exponent (n=0.208 in pH 1.2 and 0.285 in pH 6.8) for the drug-loaded HNT powder signified the formation of a polydisperse system formed by the multiple geometries of halloysite.62 However, in pH 4.5, the n value (0.164) approaches limits prescribed for a monodisperse system.62
Release data of powdered furosemide-HNT had Weibull shape parameter (β ranging from 0.249 to 0.519) indicating parabolic release curve, with initial burst release followed by prolonged release. Korsmeyer–Peppas release parameter (n=0.448) indicates anomalous drug transport occurs from the cylindrical halloysite nanotubes in pH 1.2 dissolution medium.38 However, in the pH 4.5 and 6.8 dissolution medium, the release parameter (n=0.303 and 0.259, respectively) signified that drug release is Fickian in nature from a polydisperse system.62
Considered altogether, the release kinetics data suggests that halloysite is capable of substantially retarding the release of drugs with various physicochemical attributes, likely by entrapping drugs within the lumen or binding to the drugs with loose electrostatic bonds, as suggested by FTIR spectra of verapamil hydrochloride and flurbiprofen loaded HNTs. However, drug release from halloysite was found to be pH-dependent as well, with the Henderson-Hasselbach equation governing the degree of solubility of the drug in media, and hence release of the drug from the drug-loaded HNTs. In some instances, the release exponent described drug release kinetics as being similar to those obtained with polydisperse systems, i.e. the powdered drug-loaded halloysite forms a dispersion within the media. Furthermore, burst release was initially displayed, with a parabolic release curve shown.
Content Assay and Stability Profile
The determination of the content of the three drugs by means of HPLC based assay procedures as per the compendial methods were found satisfactory for verapamil HCl loaded HNTs (103.33% ± 2.08), flurbiprofen loaded HNTs (100.71% ± 2.43), and atenolol (100.00% ± 1.00) [limit 90–110%]. However, furosemide-loaded HNTs (39.59 ± 3.49) did not meet the qualification criteria. Along with unsatisfactory content assay and the fact being that the release profiles of furosemide were extrapolated to be in the order of few days, it was concluded to be unsuitable as a candidate for developing into halloysite nanotubes based oral dosage forms.39
Finally, the optimized samples of drug halloysite nanotubes (HNTs) of verapamil HCl, flurbiprofen, and atenolol were subjected to stress stability condition (40°C/75% RH) for 12 months without any packaging to further confirm the stability and compatibility of the composites for development into dosage forms.40 The content assay after stability studies revealed an overall shelf-life of 14.485 months (95% CI) for verapamil HCl (see Figure S3–1), 10.174 months (95% CI) for flurbiprofen (see Figure S3–2), and 14.968 months (95% CI) for atenolol (see Figure S3–3).
Conclusions
The four drugs (verapamil HCl, flurbiprofen, atenolol, and furosemide) belonging to each class of the Biopharmaceutics Classification System (BCS) underwent phase transformation from crystalline state to amorphous phase during the loading process in halloysite nanotubes (HNTs). However, this change did not affect the chemical structure or stability of the drugs. It was also concluded that agitation is the optimum method for loading the drugs with various physicochemical attributes into HNTs. Moreover, the solvent system, loading ratios, and pH of the media play an important role in the loading efficiency respective to the drug properties. HNTs were found to retard drug release sufficiently so as to support development of dosage forms with highly soluble drugs, with Fickian diffusion as the main mechanism of drug release.
Acknowledgments
The authors wish to thank New Zealand China Clays Ltd (New Zealand) for the gift of halloysite nanotubes, the Searle Company for their gift of Verapamil hydrochloride and furosemide, Asian Continental Pvt. Ltd. for their gift of flurbiprofen and ATCO Laboratories Ltd. for their gift of atenolol.
Disclosure
The authors report no conflicts of interest for this work.
References
1. Lvov YM, Shchukin DG, Mohwald H, Price RR. Halloysite clay nanotubes for controlled release of protective agents. ACS Nano. 2008;2(5):814–820. doi:10.1021/nn800259q
2. Liu M, Jia Z, Jia D, Zhou C. Recent advance in research on halloysite nanotubes-polymer nanocomposite. Prog Polym Sci. 2014;39(8):1498–1525. doi:10.1016/j.progpolymsci.2014.04.004
3. Handge UA, Hedicke-Höchstötter K, Altstädt V. Composites of polyamide 6 and silicate nanotubes of the mineral halloysite: influence of molecular weight on thermal, mechanical and rheological properties. Polymer. 2010;51(12):2690–2699. doi:10.1016/j.polymer.2010.04.041
4. Levis S, Deasy P. Characterisation of halloysite for use as a microtubular drug delivery system. Int J Pharm. 2002;243(1):125–134. doi:10.1016/S0378-5173(02)00274-0
5. R. price BP, Gaber Y, Lvov R. In-vitro release characteristics of tetracycline HCl, khellin and nicotinamide adenine dineculeotide from halloysite; a cylindrical mineral. J Microencapsul. 2001;18(6):713–722. doi:10.1080/02652040010019532
6. Viseras M-T, Aguzzi C, Cerezo P, Cultrone G, Viseras C. Supramolecular structure of 5-aminosalycilic acid/halloysite composites. J Microencapsul. 2009;26(3):279–286. doi:10.1080/02652040802312499
7. Aguzzi C, Viseras C, Cerezo P, Salcedo I, Sánchez-Espejo R, Valenzuela C. Release kinetics of 5-aminosalicylic acid from halloysite. Colloids Surf B Biointerfaces. 2013;105:75–80. doi:10.1016/j.colsurfb.2012.12.041
8. Veerabadran NG, Price RR, Lvov YM. Clay nanotubes for encapsulation and sustained release of drugs. Nano. 2007;2(02):115–120. doi:10.1142/S1793292007000441
9. Forsgren J, Jämstorp E, Bredenberg S, Engqvist H, Strømme M. A ceramic drug delivery vehicle for oral administration of highly potent opioids**Johan Forsgren and Erik Jämstorp contributed equally to this work. J Pharm Sci. 2010;99(1):219–226. doi:10.1002/jps.21814
10. Vergaro V, Abdullayev E, Lvov YM, et al. Cytocompatibility and uptake of halloysite clay nanotubes. Biomacromolecules. 2010;11(3):820–826. doi:10.1021/bm9014446
11. Ahmed FR, Shoaib MH, Azhar M, et al. In-vitro assessment of cytotoxicity of halloysite nanotubes against HepG2, HCT116 and human peripheral blood lymphocytes. Colloids Surf B Biointerfaces. 2015;135:50–55. doi:10.1016/j.colsurfb.2015.07.021
12. Abdullayev E, Lvov Y. Halloysite clay nanotubes as a ceramic “skeleton” for functional biopolymer composites with sustained drug release. J Mater Chem B. 2013;1(23):2894–2903. doi:10.1039/c3tb20059k
13. Lvov Y, Abdullayev E. Functional polymer–clay nanotube composites with sustained release of chemical agents. Prog Polym Sci. 2013;38(10–11):1690–1719. doi:10.1016/j.progpolymsci.2013.05.009
14. Lvov Y, Wang W, Zhang L, Fakhrullin R. Halloysite clay nanotubes for loading and sustained release of functional compounds. Adv Mater. 2016;28(6):1227–1250. doi:10.1002/adma.201502341
15. Guo M, Wang A, Muhammad F, et al. Halloysite nanotubes, a multifunctional nanovehicle for anticancer drug delivery. Chin J Chem. 2012;30(9):2115–2120. doi:10.1002/cjoc.201200657
16. Churchman GJ, Pasbakhsh P, Hillier S. The rise and rise of halloysite. Clay Miner. 2016;51(3):303–308. doi:10.1180/claymin.2016.051.3.00
17. Yendluri R, Otto DP, De Villiers MM, Vinokurov V, Lvov YM. Application of halloysite clay nanotubes as a pharmaceutical excipient. Int J Pharm. 2017;521(1–2):267–273. doi:10.1016/j.ijpharm.2017.02.055
18. Yendluri R, Lvov Y, de Villiers MM, et al. Paclitaxel encapsulated in halloysite clay nanotubes for intestinal and intracellular delivery. J Pharm Sci. 2017;106(10):3131–3139. doi:10.1016/j.xphs.2017.05.034
19. Ahmed FR, Shoaib MH, Yousuf RI, et al. Clay nanotubes as a novel multifunctional excipient for the development of directly compressible diclofenac potassium tablets in a SeDeM driven QbD environment. Eur J Pharm Sci. 2019;133:214–227. doi:10.1016/j.ejps.2019.03.028
20. Tsume Y, Mudie DM, Langguth P, Amidon GE, Amidon GL. The biopharmaceutics classification system: subclasses for in vivo predictive dissolution (IPD) methodology and IVIVC. Eur J Pharm Sci. 2014;57:152–163. doi:10.1016/j.ejps.2014.01.009
21. Kasim NA, Whitehouse M, Ramachandran C, et al. Molecular properties of WHO essential drugs and provisional biopharmaceutical classification. Mol Pharm. 2004;1(1):85–96. doi:10.1021/mp034006h
22. Vogelpoel H, Welink J, Amidon G, et al. Biowaiver monographs for immediate release solid oral dosage forms based on biopharmaceutics classification system (BCS) literature data: verapamil hydrochloride, propranolol hydrochloride, and atenolol. J Pharm Sci. 2004;93(8):1945–1956. doi:10.1002/jps.20131
23. Yang Y, Faustino PJ, Volpe DA, Ellison CD, Lyon RC, Yu LX. Biopharmaceutics classification of selected β-blockers: solubility and permeability class membership. Mol Pharm. 2007;4(4):608–614. doi:10.1021/mp070028i
24. Tsume Y, Amidon GL. The biowaiver extension for BCS class III drugs: the effect of dissolution rate on the bioequivalence of BCS class III immediate-release drugs predicted by computer simulation. Mol Pharm. 2010;7(4):1235–1243. doi:10.1021/mp100053q
25. Ghadi R, Dand N. BCS class IV drugs: highly notorious candidates for formulation development. Journal of Controlled Release. 2017;248:71–95. doi:10.1016/j.jconrel.2017.01.014
26. Granero G, Longhi M, Mora M, et al. Biowaiver monographs for immediate release solid oral dosage forms: furosemide. J Pharm Sci. 2010;99(6):2544–2556. doi:10.1002/jps.22030
27. Krejčová K, Deasy P, Rabišková M. Diclofenac sodium entrapment and release from halloysite nanotubules. Ceska Slov Farm. 2012;62(1):28–34.
28. Qi R, Guo R, Zheng F, Liu H, Yu J, Shi X. Controlled release and antibacterial activity of antibiotic-loaded electrospun halloysite/poly (lactic-co-glycolic acid) composite nanofibers. Colloids Surf B Biointerfaces. 2013;110:148–155. doi:10.1016/j.colsurfb.2013.04.036
29. Vergaro V, Lvov YM, Leporatti S. Halloysite clay nanotubes for resveratrol delivery to cancer cells. Macromol Biosci. 2012;12(9):1265–1271. doi:10.1002/mabi.201200121
30. Ghebaur AGS, Iovu H. New polymer–halloysite hybrid materials—potential controlled drug release system. Int J Pharm. 2012;436(1):568–573. doi:10.1016/j.ijpharm.2012.07.014
31. Kelly H, Deasy P, Ziaka E, Claffey N. Formulation and preliminary in vivo dog studies of a novel drug delivery system for the treatment of periodontitis. Int J Pharm. 2004;274(1–2):167–183. doi:10.1016/j.ijpharm.2004.01.019
32. Levis S, Deasy P. Use of coated microtubular halloysite for the sustained release of diltiazem hydrochloride and propranolol hydrochloride. Int J Pharm. 2003;253(1):145–157. doi:10.1016/S0378-5173(02)00702-0
33. Riela S, Massaro M, Colletti CG, et al. Development and characterization of co-loaded curcumin/triazole-halloysite systems and evaluation of their potential anticancer activity. Int J Pharm. 2014;475(1–2):613–623. doi:10.1016/j.ijpharm.2014.09.019
34. Singh B, Bhatowa R, Tripathi CB, Kapil R. Developing micro-/nanoparticulate drug delivery systems using “design of experiments”. Int J Pharm Investig. 2011;1(2):75. doi:10.4103/2230-973X.82395
35. Politis N, Colombo P, Colombo G, Rekkas M. Design of experiments (DoE) in pharmaceutical development. Drug Dev Ind Pharm. 2017;43(6):889–901. doi:10.1080/03639045.2017.1291672
36. Zhang Y, Huo M, Zhou J, et al. DDSolver: an add-in program for modeling and comparison of drug dissolution profiles. AAPS J. 2010;12(3):263–271. doi:10.1208/s12248-010-9185-1
37. Dash S, Murthy PN, Nath L, Chowdhury P. Kinetic modeling on drug release from controlled drug delivery systems. Acta Pol Pharm. 2010;67(3):217–223.
38. Bruschi ML. Strategies to Modify the Drug Release from Pharmaceutical Systems. Woodhead Publishing; 2015.
39. USP. United States Pharmacopeia and National Formulary (USP 41-NF36). Rockville, MD, USA: United States Pharmacopeial Convention; 2016.
40. Patravale V, Disouza J, Rustomjee M. Pharmaceutical Product Development: Insights into Pharmaceutical Processes, Management and Regulatory Affairs. CRC Press, Taylor & Francis Group; 2016.
41. WHO. WHO Guidelines on Stability Testing of Pharmaceutical Products Containing Well-Established Drug Substances in Conventional Dosage Forms. Geneva; 1994.
42. Tan D, Yuan P, Annabi-Bergaya F, et al. Natural halloysite nanotubes as mesoporous carriers for the loading of ibuprofen. Microporous Mesoporous Mater. 2013;179:89–98. doi:10.1016/j.micromeso.2013.05.007
43. Compound Summary for CID 62969. Verapamil HCl. 2020. Available from: https://pubchem.ncbi.nlm.nih.gov/compound/Flurbiprofen.
44. Compound Summary for CID 3394. Flurbiprofen. 2020. Available from: https://pubchem.ncbi.nlm.nih.gov/compound/Flurbiprofen.
45. Oh DH, Park Y-J, Kang JH, Yong CS, Choi H. Physicochemical characterization and in vivo evaluation of flurbiprofen-loaded solid dispersion without crystalline change. Drug Delivery. 2011;18(1):46–53. doi:10.3109/10717544.2010.509365
46. PubChem Compound Summary for CID 2249. Atenolol. Available from: https://pubchem.ncbi.nlm.nih.gov/compound/Atenolol.
47. Denet A-R, Ucakar B, Préat V. Transdermal delivery of timolol and atenolol using electroporation and iontophoresis in combination: a mechanistic approach. Pharm Res. 2003;20(12):1946–1951. doi:10.1023/B:PHAM.0000008041.86042.c0
48. Schaffer M, Bornick H, Nodler K, Licha T, Worch E. Role of cation exchange processes on the sorption influenced transport of cationic beta-blockers in aquifer sediments. Water Res. 2012;46(17):5472–5482. doi:10.1016/j.watres.2012.07.013
49. Schurmann W, Turner P. The buccal absorption of atenolol and propranolol, and their physicochemical characteristics [proceedings]. Br J Clin Pharmacol. 1977;4(5):655P–656P. doi:10.1111/j.1365-2125.1977.tb00827.x
50. Compound Summary for CID 3440. Furosemide. 2020. Available from: https://pubchem.ncbi.nlm.nih.gov/compound/Furosemide.
51. Joussein E, Petit S, Churchman J, Theng B, Righi D, Delvaux B. Halloysite clay minerals – a review. Clay Miner. 2005;40(4):383–426. doi:10.1180/0009855054040180
52. Moneghini M, Carcano A, Zingone G, Perissutti B. Studies in dissolution enhancement of atenolol. Part I. Int J Pharm. 1998;175(2):177–183. doi:10.1016/S0378-5173(98)00281-6
53. Adrjanowicz K, Kaminski K, Paluch M, et al. Dielectric relaxation studies and dissolution behavior of amorphous verapamil hydrochloride. J Pharm Sci. 2010;99(2):828–839. doi:10.1002/jps.21877
54. Nielsen LH, Gordon S, Holm R, Selen A, Rades T, Müllertz A. Preparation of an amorphous sodium furosemide salt improves solubility and dissolution rate and leads to a faster Tmax after oral dosing to rats. Eur J Pharm Biopharm. 2013;85(3):942–951. doi:10.1016/j.ejpb.2013.09.002
55. Tozuka Y, Wongmekiat A, Kimura K, Moribe K, Yamamura S, Yamamoto K. Effect of pore size of FSM-16 on the entrapment of flurbiprofen in mesoporous structures. Chem Pharm Bull (Tokyo). 2005;53(8):974–977. doi:10.1248/cpb.53.974
56. Lun H, Ouyang J, Yang H. Natural halloysite nanotubes modified as an aspirin carrier. RSC Adv. 2014;4(83):44197–44202. doi:10.1039/C4RA09006C
57. Čalija B, Milić J, Janićijević J, Daković A, Krajišnik D. Ionically cross-linked chitosan–halloysite composite microparticles for sustained drug release. Clay Miner. 2017;52(4):413–426. doi:10.1180/claymin.2017.052.04.01
58. Li X, Ouyang Q, Yang J, Yang H, Chang S. Chitosan modified halloysite nanotubes as emerging porous microspheres for drug carrier. Appl Clay Sci. 2016;126:306–312. doi:10.1016/j.clay.2016.03.035
59. FIP. FIP Guidelines for Dissolution Testing of Solid Oral Products. Germany; 1997.
60. CID=3394. National center for biotechnology information. Available from: https://pubchem.ncbi.nlm.nih.gov/compound/3394.
61. Hossieni-Aghdam S, Foroughi-Nia B, Zare-Akbari Z, Mojarad-Jabali S, Motasadizadeh H, Farhadnejad H. Facile fabrication and characterization of a novel oral pH-sensitive drug delivery system based on CMC hydrogel and HNT-AT nanohybrid. Int J Biol Macromol. 2018;107(Pt B):2436. doi:10.1016/j.ijbiomac.2017.10.128
62. Ritger PL, Peppas NA. A simple equation for description of solute release I. Fickian and non-Fickian release from non-swellable devices in the form of slabs, spheres, cylinders or discs. J Control Release. 1987;5(1):23–36. doi:10.1016/0168-3659(87)90034-4
 © 2021 The Author(s). This work is published and licensed by Dove Medical Press Limited. The
full terms of this license are available at https://www.dovepress.com/terms
and incorporate the Creative Commons Attribution
- Non Commercial (unported, 3.0) License.
By accessing the work you hereby accept the Terms. Non-commercial uses of the work are permitted
without any further permission from Dove Medical Press Limited, provided the work is properly
attributed. For permission for commercial use of this work, please see paragraphs 4.2 and 5 of our Terms.
© 2021 The Author(s). This work is published and licensed by Dove Medical Press Limited. The
full terms of this license are available at https://www.dovepress.com/terms
and incorporate the Creative Commons Attribution
- Non Commercial (unported, 3.0) License.
By accessing the work you hereby accept the Terms. Non-commercial uses of the work are permitted
without any further permission from Dove Medical Press Limited, provided the work is properly
attributed. For permission for commercial use of this work, please see paragraphs 4.2 and 5 of our Terms.