Back to Journals » OncoTargets and Therapy » Volume 9
Intravoxel incoherent motion model–based analysis of diffusion-weighted magnetic resonance imaging with 3 b-values for response assessment in locoregional therapy of hepatocellular carcinoma
Authors Mürtz P, Penner AH, Pfeiffer AK, Sprinkart AM, Pieper CC, König R, Block W, Schild HH, Willinek WA, Kukuk GM
Received 30 May 2016
Accepted for publication 5 August 2016
Published 19 October 2016 Volume 2016:9 Pages 6425—6433
DOI https://doi.org/10.2147/OTT.S113909
Checked for plagiarism Yes
Review by Single anonymous peer review
Peer reviewer comments 2
Editor who approved publication: Dr Yao Dai
Petra Mürtz, Arndt-Hendrik Penner, Anne-Kristina Pfeiffer, Alois M Sprinkart, Claus C Pieper, Roy König, Wolfgang Block, Hans H Schild, Winfried A Willinek, Guido M Kukuk
Department of Radiology, University of Bonn, Bonn, Germany
Purpose: The aim of this study was to evaluate an intravoxel incoherent motion (IVIM) model–based analysis of diffusion-weighted imaging (DWI) for assessing the response of hepatocellular carcinoma (HCC) to locoregional therapy.
Patients and methods: Respiratory-gated DWI (b=0, 50, and 800 s/mm2) was retrospectively analyzed in 25 patients who underwent magnetic resonance imaging at 1.5 T before and 6 weeks following the first cycle of transarterial chemoembolization therapy, transarterial ethanol-lipiodol embolization therapy, and transarterial radioembolization therapy. In addition to the determination of apparent diffusion coefficient, ADC(0,800), an estimation of the diffusion coefficient, D', and the perfusion fraction, f', was performed by using a simplified IVIM approach. Parameters were analyzed voxel-wise. Tumor response was assessed in a central slice by using a region of interest (ROI) covering the whole tumor. HCCs were categorized into two groups, responders and nonresponders, according to tumor size changes on first and second follow ups (if available) and changes of contrast-enhanced region on the first follow up.
Results: In total, 31 HCCs were analyzed: 17 lesions were assigned to responders and 14 were to nonresponders. In responders, ADC(0,800) and D' were increased after therapy by ~30% (P=0.00004) and ~42% (P=0.00001), respectively, whereas f' was decreased by ~37% (P=0.00094). No significant changes were found in nonresponders. Responders and nonresponders were better differentiated by changes in D' than by changes in ADC(0,800) (area under the curve =0.878 vs 0.819 or 0.714, respectively).
Conclusion: In patients with HCCs undergoing embolization therapy, diffusion changes were better reflected by D' than by conventional ADC(0,800), which is influenced by counteracting perfusion changes as assessed by f'.
Keywords: MRI, DWI, IVIM, HCC, locoregional therapy, therapy monitoring
Introduction
Despite routine clinical use of morphology-based tumor response evaluation, there is a growing consensus that size evaluation alone has certain limitations because therapy-induced changes in tumor volume often occur relatively late after treatment.1,2 Functional imaging parameters have been proposed to improve the accuracy of early response assessment.1 Diffusion-weighted imaging (DWI) is a functional imaging technique providing information on tissue cellularity, extracellular space tortuosity, and integrity of cell membranes by measuring random motion of water molecules without injection of exogenous contrast medium or radiation exposure.1,2 DWI is suited for early response evaluation by detecting loss of cellularity due to necrosis.1–3 Therapy-induced changes detected by using DWI in hepatocellular carcinomas (HCCs) after transcatheter arterial chemoembolization (TACE) showed stronger correlation with histopathological degree of necrosis than those from native or contrast-enhanced imaging according to response evaluation criteria in solid tumors (RECIST), European Association for the Study of the Liver (EASL), or modified RECIST (mRECIST).4 Furthermore, DWI improved the detection of viable tumor tissue in HCCs following radiotherapy, when added to conventional magnetic resonance imaging (MRI).5
Quantitative analysis of DWI data was conducted from a set of images with varying degrees of diffusion weighting as selected by the diffusion weighting factors (b-values) of the sequence.1,2 For oncologic imaging, the apparent diffusion coefficient (ADC) is commonly analyzed from ≥2 b-values between 0 and 500–1,000 s/mm2, assuming a monoexponential dependence of signal intensity on the b-value.1,2 An increase in the ADC is related to therapy-induced necrosis.1–3 On the other hand, it is well known that DWI is sensitive not only to molecular diffusion but also to pseudorandom movements such as blood flow in the randomly oriented capillary network.2 Perfusion leads to additional signal intensity attenuation at low b-values, whereas the signal intensity attenuation at higher b-values is mainly caused by true diffusion.2 Thus, the ADC is a composite coefficient affected by both perfusion and diffusion. For DWI acquired with >2 b-values, a refined DWI analysis based on intravoxel incoherent motion (IVIM) theory was proposed by Le Bihan.6 In this analysis, a biexponential behavior of the signal intensity was assumed, which enables the separation of the effects of diffusion and perfusion by determining true diffusion coefficient, D, pseudodiffusion coefficient, D*, and perfusion fraction, f.7 The true diffusion coefficient D represents the mobility of water in tissues, the perfusion fraction f reflects the relative contribution of microvascular perfusion to the DWI signal, and the pseudodiffusion coefficient D* is related to the blood flow velocity and vessel architecture.7,8 In a normal liver tissue, an accurate determination of D* by nonlinear least squares fitting procedures with numerous b-values is required, if changes in blood flow velocity should be detected as in diffuse liver disease.9–13 However, in the liver, a simultaneous determination of D, f, and D* by using nonlinear biexponential fitting is challenging due to motion-induced signal variations and low signal-to-noise ratio (SNR).7,14 In malignant liver lesions, the application of such fitting procedures is even more problematic, as D* and f values in malignant liver lesions are lower than in normal liver tissue, leading to numerical instabilities and unreliable results.15–17 Thus, for oncological applications, dedicated IVIM approaches should be developed, which allow a numerically stable estimation of IVIM parameters, at least D and f, in settings with low D* and/or low f values. The estimation of these parameters should be performed voxel-wise for spatially resolved assessment and within clinically acceptable acquisition times in the interest of patient. Even if such estimates may deviate from exact D, D*, and f values, they serve as useful empirical biomarkers for diffusion and perfusion changes.
Therefore, the aim of the present study was to evaluate a simplified IVIM model–based DWI analysis based on 3 b-values for response assessment in patients with HCCs undergoing locoregional therapy.
Patients and methods
Study population
This retrospective study includes data from clinical routine examinations. The DWI sequence was part of the standardized abdominal imaging protocol since May 2008. This retrospective study was approved by the local institutional review board of the University Hospital Bonn, which also waived the need for informed patient consent because it was a retrospective re-analysis study of clinically routine images. Patients with HCC (confirmed histologically or by using typical MRI findings according to EASL criteria), who underwent TACE, transarterial ethanol–lipiodol embolization (TAELE), or radioembolization (RE) and who underwent MRI before and 6 weeks following the first cycle of therapy (the first follow up), were included in the study. Patients were excluded if they were treated with any other local or systemic chemotherapy or radiotherapy before baseline or the first follow up MRI or if the quality of diffusion-weighted image was not sufficient due to motion artifacts.
The final study population is 25 patients (5 female and 20 male mean age =66±11 years; range =40–83 years), treated with TACE (n=12), TAELE (n=2), and RE (n=11). For TACE, Doxorubicin (AdriblastinHL™; Pharmacia, Erlangen, Germany) in combination with ethiodized oil (Lipiodol Ultra-Fluid, Guerbet, France), degradable starch microspheres (EmboCept® S; PharmaCept, Berlin, Germany), or tandem beads (Embozene TANDEM™ Microspheres; CeloNova BioSciences, San Antonio, TX, USA) were used. For TAELE, ethanol 95% and ethiodized oil (Lipiodol Ultra Fluid) were injected. For RE, SIR-Spheres (SIRTEX Medical Limited, North Sydney, Australia) were used in 7 patients and TheraSphere (BTG International, Canada) in 4 patients. In 18 patients the right liver lobe was treated, in 4 patients the left liver lobe, and in 3 patients both the liver lobes. Mean time between pretherapeutic MRI and therapy was 13±15 days (range =0–47 days) and that between therapy and first follow up MRI was 44±21 days (range =21–113 days). In 22 of 25 patients, a second follow up MRI was available (mean time between therapy and second follow up MRI was 104±28 days; range =51–177 days), 3 patients had survived <3 months or were too ill to perform a second follow up. Posttherapeutic survival was monitored in 20 patients; 4 patients were alive at the date of analysis (>1,000 days since intervention).
Magnetic resonance imaging
All the examinations were performed on clinical 1.5-T MRI scanners (Gyroscan Intera and ACS-NT, 1.5 T; Philips Healthcare, Best, the Netherlands; gradient system: maximum amplitude =30 mT/m, maximum slew rate =150 T/m/s) by using a commercially available 4-element phased array surface receiver coil with the patient in supine position. In each patient, baseline and follow up MRI examinations were performed by using the same MRI scanner. The DWI sequence (Table 1), a respiratory-triggered single-shot spin-echo echo-planar imaging variant with 3 b-values (b0=0, b1=50, and b2=800 s/mm2) and motion-probing gradients in 3 orthogonal directions, was always acquired before contrast agent injection. Isotropic diffusion-weighted images were reconstructed online on the MRI system. The protocol also included a T2-weighted sequence with and without fat suppression, a T1-weighted sequence, and a T1-weighted dynamic contrast-enhanced sequence.
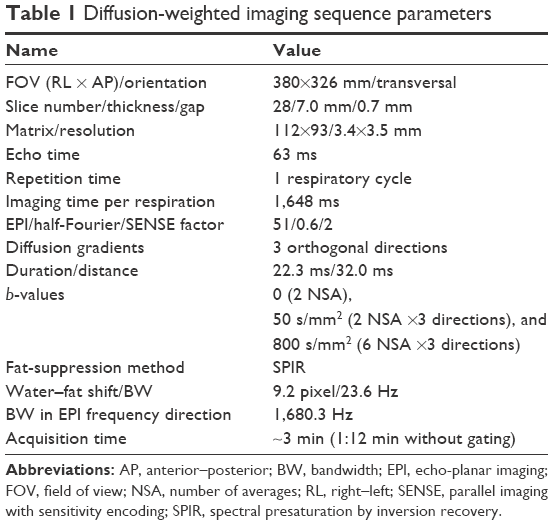 | Table 1 Diffusion-weighted imaging sequence parameters |
Image analysis
The IVIM concept assumes a 2-compartment model of extravascular and intravascular space leading to a biexponential approach of the signal attenuation.
S(b)/S(0) = f·exp(−b·D*) + (1-f)·exp(−b·D) | (1) |
where D is the true diffusion coefficient, D* the pseudodiffusion coefficient, f the perfusion fraction, and S(b) and S(0) the signal intensities with and without motion-probing gradients, respectively. D and f were approximated as introduced by Le Bihan.6 Recently, it was applied to abdominal imaging with the 3 b-values: b0=0, b1=50, and b2=800 s/mm2.18
D′ = ADC(50,800) = (ln(S(b1)) − ln(S(b2)))/(b2-b1) | (2) |
f′ =1-S(b1)/(S(0)·exp(−b1·ADC(50,800))) | (3) |
For comparison, the ADC that was conventionally obtained from the 2 b-values was also calculated:
ADC(0,800) = (ln(S(b0)) − (ln(S(b2)))/(b2-b0) | (4) |
Parameter maps were calculated offline by using MATLAB (MathWorks, Natick, MA, USA).
All HCCs were analyzed in consensus by a board-certified radiologist with >11 years of clinical experience in MRI and a physicist with >16 years of experience in DWI under consideration of all the available anatomical images. Tumor response was assessed only for HCCs >2 cm in diameter in order to prevent partial volume effects. An ROI covering the whole tumor was placed in a central slice without visible motion artifacts, pixel misalignments, or susceptibility artifacts. For each HCC, one ROI was placed on the diffusion-weighted image with b=800 s/mm2 as large as possible, excluding the areas close to the rim, with initially very low SNR or containing intralesional hemorrhage. The anatomical position of each ROI was visually cross-checked between the images with b=0, 50, and 800 s/mm2; then, the ROI was copied into the parameter maps, and mean values and standard deviations were determined.
For the clinical response assessment, changes in tumor size were determined by using the longest diameter of the whole tumor (LDT) on the first and the second (if available) follow up MRI measured on 2D slices. Moreover, the change in the longest diameter of regions with contrast enhancement (LDCE) at the time point of the first follow up was measured in the arterial phase images. In a case in which the HCC appeared hyperintense on the native images due to lipiodol deposition following TACE, subtraction images (contrast-enhanced minus native images) were used for measuring LDCE.
HCCs were categorized into two groups, Group A (responders) with definite LDT reduction (at least 5%) on the first follow up and stable or further reduced LDT on the second follow up (if available) and also reduced LDCE (at least 5%) and Group B (nonresponders) with stable (LDT reduction <5%) or increased LDT on the first follow up and stable or further increased LDT on the second follow up (if no other therapies were performed meanwhile) and also unchanged (LDCE reduction <5%) or increased LDCE.
Statistical analysis
Statistically significant differences (P<0.05) between groups were tested by using nonparametric Mann–Whitney U-test (independent samples) and with Student’s t-test (paired samples) after proving Gaussian distribution by using Kolmogorov–Smirnov test. Discrimination between groups was analyzed by using receiver operating characteristics. Statistics were performed by using Statistical Package for Social Sciences (Version 21.0; IBM, Armonk, NY, USA).
Results
A total of 31 HCCs were eligible for analysis, including 1 HCC per patient in 21 patients, 2 HCCs in 3 patients, and 4 HCCs in 1 patient. The pretherapeutically measured mean lesion size was 54±27 mm (range =19–143 mm). Seventeen HCCs were assigned to Group A with mean LDT change (postvalue minus prevalue) of −16% (range =−37% to −5%, n=17) at the first follow up and −29% (range =−60% to −10%, n=16) at the second follow up and a mean LDCE reduction of −58% (range =−100% to −14%, n=17) at the first follow up; 14 HCCs were assigned to Group B with mean LDT change of +5% (range =−4% to +26%, n=14) at the first follow up and +2% (range =−16% to +31%, n=11) at the second follow up (decreased LDT values in 4 cases can be explained by further treatments). The mean LDCE change in Group B was +2% (range =−2% to +19%, n=9); in 5 cases, the quality of the images with contrast enhancement was not sufficient for mRECIST analysis due to motion artifacts (n=3) or due to hypovascularity in all dynamic phases (n=2). The overall mean survival time was longer in Group A (mean =744±484 days, range =81–1,637 days) than in Group B (mean =654±643 days, range =129–1,861 days), but the difference was not statistically significant.
Figure 1 shows the examples of diffusion-weighted images and maps of ADC(0,800), D′, and f′. Several HCCs of Group A showed a homogeneous response: loss of hyperintensity on DWI b800 measured posttherapeutically and an increase in ADC(0,800) with an enhanced increase in D′ and a decrease in f′ in the entire tumor (Figure 1A). In some of these cases, an additional loss of hyperintensity on DWI b0 was found (Figure 1B). Other HCCs showed more heterogeneous response (Figure 1C). The values represent a net effect measured in the ROI. Some other HCCs showed homogeneous hyperintense appearance after therapy, but with a decrease in size or signal intensity. In one HCC, there was no increase in ADC(0,800) and D′, but f′ was markedly decreased. Table 2 shows the results of DWI analysis. For the pretherapeutically measured parameter values, no differences were found between Groups A and B. Posttherapeutically, for Group A, an increase in ADC(0,800) and D′ by ~30% (P=0.00004) and ~42% (P=0.00001), respectively, and a decrease in f′ by ~37% (P=0.00094) were measured, whereas for Group B no significant changes were detected. For Group A compared to Group B, posttherapeutic D′ values were significantly larger (P=0.029), f′ values were significantly lower (P=0.017), and the ADC(0,800) showed larger values only by tendency. The changes in the parameter values (differences between post- and pretreatment values) showed the following significant between-group differences: for Group A compared to Group B, a significant larger increase in ADC(0,800) and D′ (P=0.00190 and P=0.00016, respectively) and a significant larger decrease in f′ (P=0.04384) were found. Responders and nonresponders were better differentiated by changes in D′ than by changes in ADC(0,800) and f′ or by posttherapeutical D′ and f′ values as indicated by the results of receiver operating characteristic analysis (area under the curve =0.878 compared to 0.819, 0.714, 0.731, and 0.750, respectively).
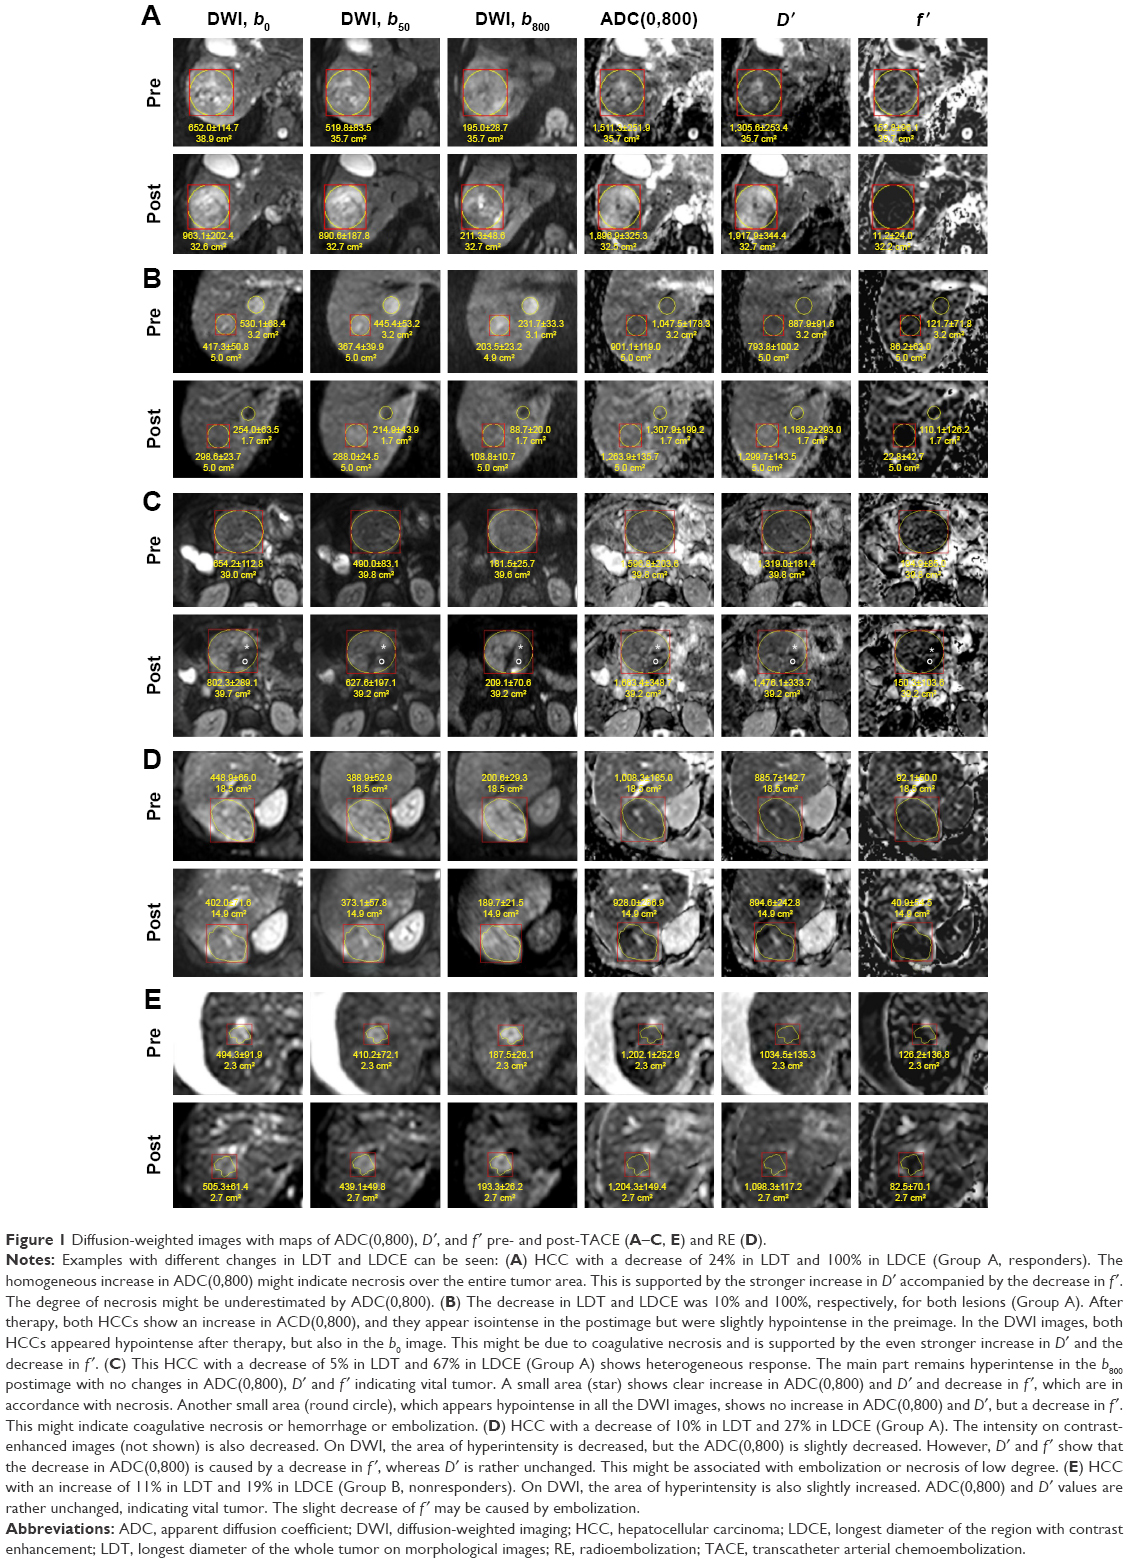 | Figure 1 Diffusion-weighted images with maps of ADC(0,800), D′, and f′ pre- and post-TACE (A–C, E) and RE (D). |
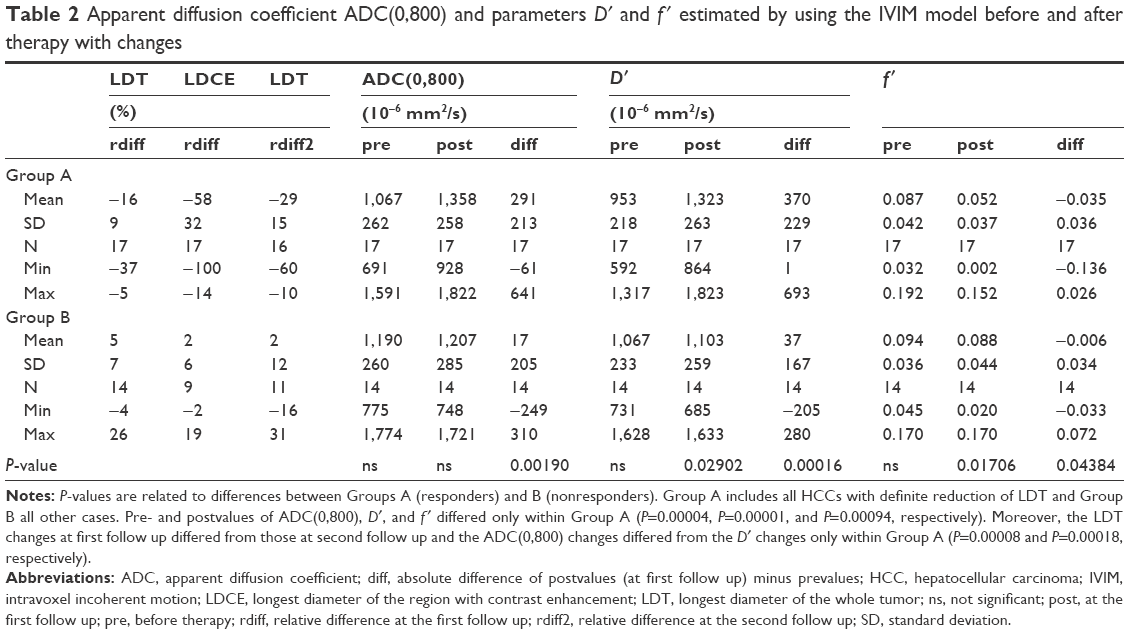 | Table 2 Apparent diffusion coefficient ADC(0,800) and parameters D′ and f′ estimated by using the IVIM model before and after therapy with changes |
Discussion
In the present study, a simplified IVIM approach was used to obtain parameter maps reflecting intralesional diffusion and perfusion changes in patients with HCC undergoing locoregional tumor therapy. As a main result, responders showed an increase in the estimated diffusion coefficient D′ accompanied by a decrease in the estimated perfusion fraction f′. In contrast, no significant changes were found in nonresponders. Responders could be better differentiated from nonresponders by changes in D′ than by changes in the conventionally determined ADC(0,800). Moreover, for differentiation, the changes in D′ were better suited than the changes in f′ and the posttherapeutical D′ and f′ values. The pretherapeutically measured parameter values showed no between-group differences, and thus, they were nonpredictive of response.
Previous studies on locoregional therapy response evaluation by DWI in HCCs focused on the assessment of the conventional ADC and typically implemented only a low maximum b-value of 500 s/mm2 for the assessment of RE19,20 and TACE.21–26 Because low maximum b-values have the disadvantage of higher perfusion sensitivity of the corresponding ADC values, recently published studies used a higher maximum b-value of 1,000 s/mm2, which reduces (but not eliminates) the effects of perfusion on ADC.4 One of these studies reported a correlation of the ADC change with the histopathological degree of necrosis.4 The results of the present work suggest that changes in D′ might better reflect necrosis than changes in ADC, as ADC is influenced by counteracting perfusion changes. Stable or decreased D′ found in nonresponders may indicate persisting viable tumor.2,27
In the IVIM model, information about perfusion is provided by the perfusion fraction f and the pseudodiffusion coefficient D*.7,8 In nude mice implanted with the HT29 colorectal cancer cells, f correlated with histological microvessel density.28 In the liver, a voxel-wise simultaneous determination of D, f, and D* by using nonlinear biexponential fitting is challenging due to motion-induced signal variations and low SNR.7,14 For data with low SNR, fitted f values were known to be systematically overestimated.29,30 On the other hand, the acquisition of numerous b-values with sufficient signal averages leads to long acquisition times, especially at 1.5 T.9,31 Thus, D* was kept constant,32 ROI-wise fitting instead of voxel-based analysis was performed,9–12 and/or advanced fitting procedures such as Bayesian fitting33 or segmented fitting3,9–13 were used. In patients with diffuse liver diseases such as isolated steatosis, steatohepatitis, fibrosis, and cirrhosis, D and especially D* were found to be pathologically altered, whereby for accurate D* determination the acquisition of b-values between 0 and 50 s/mm2 was essential.9–13 However, in regions with low f values (small IVIM effects), problems with unreliable fit results occurred.32 In malignant liver lesions, IVIM analysis was further complicated by the fact that D* and f values are lower than those in healthy or surrounding liver tissues,15–17 especially in hypovascular lesions34 and in areas with necrosis.35 Slow or stagnant blood flow through small damaged tumor vessels may lead to low D* values (and indirectly also to lower f values). This hypothesis is in line with a mouse mammary carcinoma model in which D* negatively correlated with the interstitial fluid pressure (IFP) that influences blood flow.36 In case of low D* and f values, the use of nonlinear biexponential fitting procedures is hampered by signal decay curves with only weak biexponential behavior and small IVIM effects, leading to fitting failure.37 For HCCs and liver metastases, unacceptably poor reproducibility especially of fitted D* was found.15,17 The determination of low D* values is challenging, and it cannot be improved by the acquisition of b-values between 0 and 50 s/mm2 due to the flatter curve at low b-values. Thus, dedicated analysis methods are required for the clinical investigation of malignant liver lesions. The determination of estimated diffusion coefficients D′ and perfusion fractions f′ from a low number of b-values with sufficient signal averages by using numerically stable voxel-wise analysis methods such as approximation formula6 or asymptotic fitting30 is promising.18,27 Although f′ (and also D′) values depend on the b-values used and are influenced not only by f but also by D* (not directly determined), f′ may serve as an additional empirical parameter that enables the assessment of perfusion effects. Its voxel-wise determination is an important advantage for treatment response evaluation, enabling a spatially resolved assessment.
In the present study, the same simplified IVIM approach and b-values were used as by Penner et al18. The pretherapeutically measured f′ values of Group A (0.087±0.042) and Group B (0.094±0.036) in the present study are in agreement with the previous work (0.089±0.045); f values found in studies using other IVIM approaches were higher.15,16,27 However, it was expected that D′ values overestimate D and f′ values underestimate f, especially for tissues with low D*.18 In general, results from different studies may vary according to not only the b-values used but also the localization of the HCC within the liver,13,18 gating techniques used,14 contrast agent injection,16 and echo and repetition times.38 For therapy monitoring, it is important to use the same MRI scanner hardware and DWI protocol in the follow up MRI as performed in the present study.
Current knowledge about IVIM analysis for response assessment in the liver is limited. The results of increased D′ and decreased f′ in responders are in agreement with increased D and decreased f and D* in histologically confirmed coagulation necrosis area of rabbit VX2 tumors after radiofrequency ablation.39 In a recent study, the early response of liver metastases from colorectal cancer to a combined therapy of antiangiogenic plus cytotoxic agents (FOLFIRI plus bevacizumab) was assessed.40 Responders showed unchanged D and D* values, but decreased f values as a sign of reduced microvessel density. This was explained by the short time interval from drug administration (2 weeks), where only perfusion but no apoptosis took place. Tumor vasculature normalized before its destruction. In a rabbit VX2 liver tumor model, perfusion changes caused by a vascular disruption agent were observed by D* and f.41 On the other hand, in a response analysis of vital tumor regions of neuroendocrine liver metastases to RE by fractioned ADC analysis, responders showed lower pretherapeutical ADC(0, 50) values and a larger therapy-induced increase in this perfusion-sensitive parameter.42 Lower pretherapeutical values might be related to higher pretherapeutical IFPs, the increase after therapy may indicate a decrease in IFP due to embolization, which may improve drug penetration.43 In a study addressing the response of advanced HCCs following antiangiogenic therapy with sorafenib, D remained stable, indicating absence of significant necrotic effects, whereas f differentiated responders from nonresponders by lower pretherapeutic values and increased values after therapy.27 This finding may be explained by higher pretherapeutical IFP in responders that decreased after therapy due to less microvessel leakage. It has to be mentioned that observed changes in f may be partly caused by changes in relaxation times.38 This means that the measured reduction in f′ in this work, which is probably related to vessel destruction due to necrosis or embolization, might also be in part an effect of an increase in tissue relaxation time T2 due to necrosis.
In this basic retrospective study, changes in functional IVIM parameters were investigated 6 weeks postinterventionally on the first follow up MRI. However, DWI has the potential to detect changes earlier after therapy when changes in tumor size are still absent, as demonstrated for HCCs after TACE.44 Thus, in future studies, the optimal time point for early response assessment by D′ and f′ measurements should be determined. Moreover, the reproducibility of the parameters determined with the simplified IVIM approach should be analyzed. In future studies, therapy response analyses should also be investigated separately for different types of interventions in order to provide therapy-specific response criteria.
Conclusion
The present work provided spatially resolved information on diffusion and perfusion changes of HCCs after locoregional therapy from 3 b-values DWI by using a simplified IVIM approach. D′ was better suited than conventional ADC(0,800) to assess therapeutic diffusion changes due to counteracting perfusion influences, which were separately addressed by f′. The results indicate that an IVIM-based simplified analysis has the potential to improve the accuracy of HCC response assessment compared to conventional ADC analysis.
Disclosure
The authors report no conflicts of interest in this work.
References
Li SP, Padhani AR. Tumor response assessments with diffusion and perfusion MRI. J Magn Reson Imaging. 2012;35(4):745–763. | ||
Thoeny HC, Ross BD. Predicting and monitoring cancer treatment response with diffusion-weighted MRI. J Magn Reson Imaging. 2010;32(1):2–16. | ||
Chiaradia M, Baranes L, Van Nhieu JT, et al. Intravoxel incoherent motion (IVIM) MR imaging of colorectal liver metastases: are we only looking at tumor necrosis? J Magn Reson Imaging. 2014;39(2):317–325. | ||
Vandecaveye V, Michielsen K, De Keyzer F, et al. Chemoembolization for hepatocellular carcinoma: 1-month response determined with apparent diffusion coefficient is an independent predictor of outcome. Radiology. 2014;270(3):747–757. | ||
Park HJ, Kim SH, Jang KM, et al. Added value of diffusion-weighted MRI for evaluating viable tumor of hepatocellular carcinomas treated with radiotherapy in patients with chronic liver disease. AJR Am J Roentgenol. 2014;202(1):92–101. | ||
Le Bihan D, Breton E, Lallemand D, Aubin ML, Vignaud J, Laval-Jeantet M. Separation of diffusion and perfusion in intravoxel incoherent motion MR imaging. Radiology. 1988;168(2):497–505. | ||
Koh DM, Collins DJ, Orton MR. Intravoxel incoherent motion in body diffusion-weighted MRI: reality and challenges. AJR Am J Roentgenol. 2011;196(6):1351–1361. | ||
Koh DM. Science to practice: can intravoxel incoherent motion diffusion-weighted MR imaging be used to assess tumor response to antivascular drugs? Radiology. 2014;272(2):307–308. | ||
Cohen AD, Schieke MC, Hohenwalter MD, Schmainda KM. The effect of low b-values on the intravoxel incoherent motion derived pseudodiffusion parameter in liver. Magn Reson Med. 2015;73(1):306–311. | ||
Parente DB, Paiva FF, Oliveira Neto JA, et al. Intravoxel incoherent motion diffusion weighted MR imaging at 3.0 T: assessment of steatohepatitis and fibrosis compared with liver biopsy in type 2 diabetic patients. PLoS One. 2015;10(5):e0125653. | ||
Lu P-X, Huang H, Yuan J, et al. Decreases in molecular diffusion, perfusion fraction and perfusion-related diffusion in fibrotic livers: a prospective clinical intravoxel incoherent motion MR imaging study. PLoS One. 2014;9(12):e113846. | ||
Guiu B, Petit JM, Capitan V, et al. Intravoxel incoherent motion diffusion-weighted imaging in nonalcoholic fatty liver disease: a 3.0-T MR study. Radiology. 2012;265(1):96–103. | ||
Luciani A, Vignaud A, Cavet M, et al. Liver cirrhosis: intravoxel incoherent motion MR imaging – pilot study. Radiology. 2008;249(3):891–899. | ||
Lee Y, Lee SS, Kim N, et al. Intravoxel incoherent motion diffusion-weighted MR imaging of the liver: effect of triggering methods on regional variability and measurement repeatability of quantitative parameters. Radiology. 2015;274(2):405–415. | ||
Kakite S, Dyvorne H, Besa C, et al. Hepatocellular carcinoma: short-term reproducibility of apparent diffusion coefficient and intravoxel incoherent motion parameters at 3.0T. J Magn Reson Imaging. 2015;41(1):149–156. | ||
Woo S, Lee JM, Yoon JH, Joo I, Han JK, Choi BI. Intravoxel incoherent motion diffusion-weighted MR imaging of hepatocellular carcinoma: correlation with enhancement degree and histologic grade. Radiology. 2014;270(3):758–767. | ||
Andreou A, Koh DM, Collins DJ, et al. Measurement reproducibility of perfusion fraction and pseudodiffusion coefficient derived by intravoxel incoherent motion diffusion-weighted MR imaging in normal liver and metastases. Eur Radiol. 2013;23(2):428–434. | ||
Penner AH, Sprinkart AM, Kukuk GM, et al. Intravoxel incoherent motion model-based liver lesion characterisation from three b-value diffusion-weighted MRI. Eur Radiol. 2013;23(10):2773–2783. | ||
Rhee TK, Naik NK, Deng J, et al. Tumor response after yttrium-90 radioembolization for hepatocellular carcinoma: comparison of diffusion-weighted functional MR imaging with anatomic MR imaging. J Vasc Interv Radiol. 2008;19(8):1180–1186. | ||
Deng J, Miller FH, Rhee TK, et al. Diffusion-weighted MR imaging for determination of hepatocellular carcinoma response to yttrium-90 radioembolization. J Vasc Interv Radiol. 2006;17(7):1195–1200. | ||
Mannelli L, Kim S, Hajdu CH, Babb JS, Taouli B. Serial diffusion-weighted MRI in patients with hepatocellular carcinoma: prediction and assessment of response to transarterial chemoembolization. Preliminary experience. Eur J Radiol. 2013;82(4):577–582. | ||
Dong S, Ye XD, Yuan Z, Xu LC, Xiao XS. Relationship of apparent diffusion coefficient to survival for patients with unresectable primary hepatocellular carcinoma after chemoembolization. Eur J Radiol. 2012;81(3):472–477. | ||
Mannelli L, Kim S, Hajdu CH, Babb JS, Clark TW, Taouli B. Assessment of tumor necrosis of hepatocellular carcinoma after chemoembolization: diffusion-weighted and contrast-enhanced MRI with histopathologic correlation of the explanted liver. AJR Am J Roentgenol. 2009;193(4):1044–1052. | ||
Goshima S, Kanematsu M, Kondo H, et al. Diffusion-weighted imaging of the liver: optimizing b value for the detection and characterization of benign and malignant hepatic lesions. J Magn Reson Imaging. 2008;28(3):691–697. | ||
Chen CY, Li CW, Kuo YT, et al. Early response of hepatocellular carcinoma to transcatheter arterial chemoembolization: choline levels and MR diffusion constants – initial experience. Radiology. 2006;239(2):448–456. | ||
Kamel IR, Bluemke DA, Eng J, et al. The role of functional MR imaging in the assessment of tumor response after chemoembolization in patients with hepatocellular carcinoma. J Vasc Interv Radiol. 2006;17(3):505–512. | ||
Lewin M, Fartoux L, Vignaud A, Arrive L, Menu Y, Rosmorduc O. The diffusion-weighted imaging perfusion fraction f is a potential marker of sorafenib treatment in advanced hepatocellular carcinoma: a pilot study. Eur Radiol. 2011;21(2):281–290. | ||
Lee HJ, Rha SY, Chung YE, et al. Tumor perfusion-related parameter of diffusion-weighted magnetic resonance imaging: correlation with histological microvessel density. Magn Reson Med. 2014;71(4):1554–1558. | ||
Neil JJ, Bretthorst GL. On the use of Bayesian probability theory for analysis of exponential decay data: an example taken from intravoxel incoherent motion experiments. Magn Reson Med. 1993;29(5):642–647. | ||
Pekar J, Moonen CT, van Zijl PC. On the precision of diffusion/perfusion imaging by gradient sensitization. Magn Reson Med. 1992;23(1):122–129. | ||
Lemke A, Stieltjes B, Schad LR, Laun FB. Toward an optimal distribution of b values for intravoxel incoherent motion imaging. Magn Reson Imaging. 2011;29(6):766–776. | ||
Lee JT, Liau J, Murphy P, Schroeder ME, Sirlin CB, Bydder M. Cross-sectional investigation of correlation between hepatic steatosis and IVIM perfusion on MR imaging. Magn Reson Imaging. 2012;30(4):572–578. | ||
Orton MR, Collins DJ, Koh D-M, Leach MO. Improved intravoxel incoherent motion analysis of diffusion weighted imaging by data driven Bayesian modeling. Magn Reson Med. 2014;71(1):411–420. | ||
Yoon JH, Lee JM, Yu MH, Kiefer B, Han JK, Choi BI. Evaluation of hepatic focal lesions using diffusion-weighted MR imaging: comparison of apparent diffusion coefficient and intravoxel incoherent motion-derived parameters. J Magn Reson Imaging. 2014;39(2):276–285. | ||
Wagner M, Doblas S, Daire JL, et al. Diffusion-weighted MR imaging for the regional characterization of liver tumors. Radiology. 2012;264(2):464–472. | ||
Kim S, Decarlo L, Cho GY, et al. Interstitial fluid pressure correlates with intravoxel incoherent motion imaging metrics in a mouse mammary carcinoma model. NMR Biomed. 2012;25(5):787–794. | ||
Cho GY, Kim S, Jensen JH, Storey P, Sodickson DK, Sigmund EE. A versatile flow phantom for intravoxel incoherent motion MRI. Magn Reson Med. 2012;67(6):1710–1720. | ||
Lemke A, Laun FB, Simon D, Stieltjes B, Schad LR. An in vivo verification of the intravoxel incoherent motion effect in diffusion-weighted imaging of the abdomen. Magn Reson Med. 2010;64(6):1580–1585. | ||
Guo Z, Zhang Q, Li X, Jing Z. Intravoxel incoherent motion diffusion weighted MR Imaging for monitoring the instantly therapeutic efficacy of radiofrequency ablation in rabbit VX2 tumors without evident links between conventional perfusion weighted images. PLoS One. 2015;10(5):e0127964. | ||
Granata V, Fusco R, Catalano O, et al. Early assessment of colorectal cancer patients with liver metastases treated with antiangiogenic drugs: the role of intravoxel incoherent motion in diffusion-weighted imaging. PLoS One. 2015;10(11):e0142876. | ||
Joo I, Lee JM, Han JK, Choi BI. Intravoxel incoherent motion diffusion-weighted MR imaging for monitoring the therapeutic efficacy of the vascular disrupting agent CKD-516 in rabbit VX2 liver tumors. Radiology. 2014;272(2):417–426. | ||
Kukuk GM, Mürtz P, Träber F, et al. Diffusion-weighted imaging with acquisition of three b-values for response evaluation of neuroendocrine liver metastases undergoing selective internal radiotherapy. Eur Radiol. 2014;24(2):267–276. | ||
Liang B, Chen S, Li L, et al. Effect of transcatheter intra-arterial therapies on tumor interstitial fluid pressure and its relation to drug penetration in a rabbit liver tumor model. J Vasc Interv Radiol. 2015;26(2):1879–1886. | ||
Kamel IR, Liapi E, Reyes DK, Zahurak M, Bluemke DA, Geschwind JF. Unresectable hepatocellular carcinoma: serial early vascular and cellular changes after transarterial chemoembolization as detected with MR imaging. Radiology. 2009;250(2):466–473. |
 © 2016 The Author(s). This work is published and licensed by Dove Medical Press Limited. The
full terms of this license are available at https://www.dovepress.com/terms
and incorporate the Creative Commons Attribution
- Non Commercial (unported, 3.0) License.
By accessing the work you hereby accept the Terms. Non-commercial uses of the work are permitted
without any further permission from Dove Medical Press Limited, provided the work is properly
attributed. For permission for commercial use of this work, please see paragraphs 4.2 and 5 of our Terms.
© 2016 The Author(s). This work is published and licensed by Dove Medical Press Limited. The
full terms of this license are available at https://www.dovepress.com/terms
and incorporate the Creative Commons Attribution
- Non Commercial (unported, 3.0) License.
By accessing the work you hereby accept the Terms. Non-commercial uses of the work are permitted
without any further permission from Dove Medical Press Limited, provided the work is properly
attributed. For permission for commercial use of this work, please see paragraphs 4.2 and 5 of our Terms.