Back to Journals » Clinical Ophthalmology » Volume 15
Intraretinal Cysts in Macular Hole: A Structure-Function Correlation Based on En Face Imaging
Authors Nair U ![]() , Sheth JU
, Sheth JU ![]() , Indurkar A, Soman M
, Indurkar A, Soman M
Received 7 June 2021
Accepted for publication 1 July 2021
Published 12 July 2021 Volume 2021:15 Pages 2953—2962
DOI https://doi.org/10.2147/OPTH.S321594
Checked for plagiarism Yes
Review by Single anonymous peer review
Peer reviewer comments 3
Editor who approved publication: Dr Scott Fraser
Unnikrishnan Nair,1,2 Jay U Sheth,1,2 Asmita Indurkar,1 Manoj Soman1,2
1Vitreoretinal Services, Chaithanya Eye Hospital and Research Institute, Trivandrum, Kerala, India; 2Department of Research, Chaithanya Innovation in Technology and Eyecare (Research), Trivandrum, Kerala, India
Correspondence: Jay U Sheth 32, Shiv-Mahal, Mathuradas Road, Kandivali (West), Mumbai, 400067, Maharashtra, India
Tel +91 9961167200
Email [email protected]
Purpose: To characterize retinal micromorphic changes on en face optical coherence tomography (OCT) and to determine their role in pathogenesis and visual outcomes in macular hole (MH) surgery.
Patients and Methods: This is a retrospective, interventional, consecutive case series of 28 eyes undergoing successful MH surgery. Pre- and post-operative en face OCT were manually segmented, and the correlation between parameters such as MH basal diameter and minimal inlet area, area of cyst in inner plexiform layer (IPL) and outer plexiform layer (OPL), percentage of cyst in IPL and OPL, and amount of ellipsoid zone (EZ) defect and external limiting membrane (ELM) defect was performed. Their relationship with visual acuity (VA) outcomes (Group 1: ≥ 20/60; 14 eyes; Group 2: < 20/60; 14 eyes) was also evaluated.
Results: A significant positive correlation was noted between the cyst area in OPL and IPL (r=0.768; p< 0.001), which in turn were positively correlated with the basal diameter of the MH in all eyes. The cyst area was significantly more in IPL as compared to OPL in all eyes (p=0.049) and in group 2 (p=0.03) but not in group 1 (p=0.62). As compared to group 2, eyes in group 1 had significantly better pre- and post-operative VA, and significantly smaller basal diameter, minimal inlet area, area of cyst in IPL and OPL, and amount of defect in the ELM (postoperative) and EZ (pre- and post-operative), respectively.
Conclusion: An increase in the basal diameter of the MH is associated with a simultaneous congruous enlargement of the area of cyst in IPL and OPL. Based on these imaging findings, we propose that the possible rationale for the origin of these intraretinal cysts could be a breakdown in the physiological retinal pigment epithelium (RPE) pump due to the anatomical separation of the neurosensory retina from the underlying RPE, ie, “RPE contact loss” theory.
Keywords: macular hole, spectral-domain optical coherence tomography, en face imaging, intraretinal cysts
Introduction
A full-thickness macular hole (MH) is a defect of the neurosensory foveal retina causing central visual impairment.1 High-resolution spectral-domain optical coherence tomography (SD-OCT) systems have allowed for detailed analysis of the foveal microstructure and have been predictive in outcomes of macular holes.2–4 Preoperative cross-sectional SD-OCT of the macular hole is fundamental in the evaluation of several features contributing to the outcomes. Preoperative measurement of macular hole diameter by OCT affecting postoperative closure and visual acuity was first described by Ip et al.5 Subsequently, other factors such as external limiting membrane (ELM) disruption, ellipsoid zone (EZ) defects, and loss of integrity of photoreceptor interdigitation zone and the photoreceptor outer segment, respectively, have been implicated in the prognosis of macular holes.6,7 Various macular indices like MH minimum and base diameter, the MH height, Diameter Hole Index (DHI), Tractional Hole Index (THI), and Macular Hole Index (MHI) and even ELM angle have been studied to predict closure and visual acuity gains.8–10
Cystic changes have been demonstrated both in the inner and outer layers of the retina on histopathological evaluation of enucleated eyes with macular holes.11 These hyporeflective intraretinal cystoid spaces surrounding the full-thickness macular hole have also been studied previously on en face SD-OCT imaging. Clamp et al were the first to use en face imaging to measure the area of intraretinal splitting in a lamellar macular hole and studied its correlation with visual acuity.12 Matet et al have characterized and quantified the perifoveal cystic cavities in full-thickness macular holes and correlated them with immunohistochemistry to study Muller cells in flat-mounted retinas.13 En face OCT analysis of cystic areas surrounding the macular hole in the deep retinal slab depicted various configurations of cystic areas and their correlation with the hole sizes.4 These studies have utilized automated segmentation for the evaluation of en face OCT parameters in MH. However, it is possible that the automated segmentation slabs may not truly reflect the true configuration or dimensions of cystoids. De Azevedo et al have shown a significant difference in the mean central thickness between automated and manual segmentation in eyes with cystoid macular edema (CME) and choroidal neovascularization (CNV).14
Though intraretinal cystoid spaces have been studied previously in MH,4,13 their impact on visual and surgical outcomes and its role as a prognostic biomarker is yet to be ascertained. Moreover, the relationship of the dual nature of intraretinal cysts, located in the outer and inner retina, and their role in pathogenesis and prognostication of MH remains relatively unexplored. To overcome these lacunae in literature, we analyze the micromorphological macular changes on en face SD-OCT in MH eyes and their impact on final visual outcomes after MH surgery. Additionally, we seek to eliminate the segmentation errors occurring in the previous studies4 by manual segmentation of en face SD-OCT sections.
Materials and Methods
This is a retrospective, interventional, consecutive case series performed at a tertiary eye care center in Trivandrum, Kerala, India between January 2019 and December 2020. The study was conducted in accordance with the tenets of the Declaration of Helsinki and was approved by the Institutional Review Board of Chaithanya Eye Hospital and Research Institute, Trivandrum, India. Written informed consent was obtained from all the patients.
Design
Eyes with an idiopathic MH confirmed on SD-OCT (Spectralis, Heidelberg, Germany), having a preoperative and postoperative en face structural OCT, and with a Type 1 closure were included. Eyes with any other ocular co-morbidities like retinopathy, glaucoma, macular degeneration, or uveitis, or eyes with a previous history of any other ocular surgery apart from cataract surgery with intraocular lens implantation were excluded. Eyes that underwent ILM peeling with an inverted ILM flap were also excluded. All patients underwent the standard surgical procedure of 25-G pars plana vitrectomy with an internal limiting membrane (ILM) peeling and gas injection (perfluoropropane [C3F8] or sulfur hexafluoride [SF6] based on the surgeon preference). The surgery was performed by two experienced vitreoretinal surgeons (UN and MS); both having more than ten years of surgical experience. Since this was a retrospective review, all the patients were treated as per the standard of care and no treatment was altered for this study. All patients were advised strict postoperative prone positioning for at least one week.
OCT Measurements
Preoperative en face scan was selected in the Spectralis software (Heidelberg Spectralis_software_V6.16.2 English Workstation Windows 10 64 bit) and exported as .png images. Manual segmentation was performed to choose slices of 50 µm thickness each for the base of the hole (basal hole area), inner plexiform layer (IPL cystic area), outer plexiform layer (OPL-Henle’s layer cystic area), and minimal inlet area (Figure 1). They were then analyzed using the open-source software ImageJ (NIH, USA) by two independent observers (MS, AI) and the values were averaged. Lin correlation coefficients were calculated and a value of >0.80 was considered sufficient to prove a strong inter-grader correlation. In case of a lower value, a third grader (UN) would have been used to resolve discrepancies; however, this step was not required. The image was converted to 8 bits (Figure 2), and the area of the cysts was manually selected using the selection brush. Then, an auto local thresholding was performed using the “Phansalkar” preset. The selected area was then measured to yield the total area (for hole base area and minimal inlet area) or total area affected with intraretinal cystic involvement (for IPL and OPL-Henle’s) and percent of the area with cysts. Additionally, the amount of ellipsoid zone defect and external membrane defect was also determined on the OCT B-scan as described in our published study. Briefly, the ELM or EZ defect was defined as the distance between the terminations of the ELM or EZ, respectively, on either side of the hole. It was measured using the inbuilt caliper function of Spectralis. The “total area of cyst” in OPL and IPL was defined as the area of cyst outlined by free selection tool brush in image J minus the area of the macular hole as seen on en face OCT section of the respective retinal layer. The “percentage of cyst” was defined as the percentage of white in the selected “area of the cyst” on en face OCT.
 |
Figure 1 (A) Demonstrates automated segmentation showing two types of the cyst (inner nuclear layer [INL] and outer plexiform layer [OPL] in the en face optical coherence imaging (OCT) scan). (B) Shows manual segmentation with an en face scan of the INL, small multiple circular cysts occupying a larger area on the en face. (C) shows manual segmentation with an en face scan of the OPL, note larger, radially oriented cyst occupying a smaller area around the macular hole in comparison to the INL. |
 |
Figure 2 (A) Cross-sectional spectral-domain optical coherence imaging (SD-OCT) image showing preoperative ellipsoid zone (EZ; yellow line) and external limiting membrane (ELM; green line) defect measurements. (B) Cross-sectional SD-OCT image showing postoperative EZ and ELM defect measurements. (C) Preoperative en face OCT scan showing measurement of minimum inlet diameter of macular hole (yellow). (D) Preoperative en face OCT scan showing measurement of the base diameter of macular hole (yellow). |
Statistical Analysis
For statistical analysis and presentation of data, the eyes were divided into two groups based on final-corrected distance visual acuity with 20/60 as the cut-off. Group 1 was defined as eyes having better final CDVA (better than or equal to 20/60) and Group 2 was defined as eyes having poorer final CDVA (less than 20/60). The measurements were checked for reliability and consistency with an intra-class correlation and Cronbach’s alpha (Table 1). The values were then averaged to give one value. The variables with continuous data were checked for normality using the Shapiro–Wilk test. Quantitative data are presented as mean (standard deviation), and since a majority of the data had a non-parametric distribution, means were compared using the Mann Whitney-U test. Spearman correlation was used to check for correlations. A p-value of <0.05 was considered significant. Based on the results of the correlation, a multivariate analysis was performed to yield the significant factors influencing final visual acuity. Additionally, we also compared the relationship between the area of cysts and the percentage of cyst involvement in the outer and inner retina in both groups, respectively.
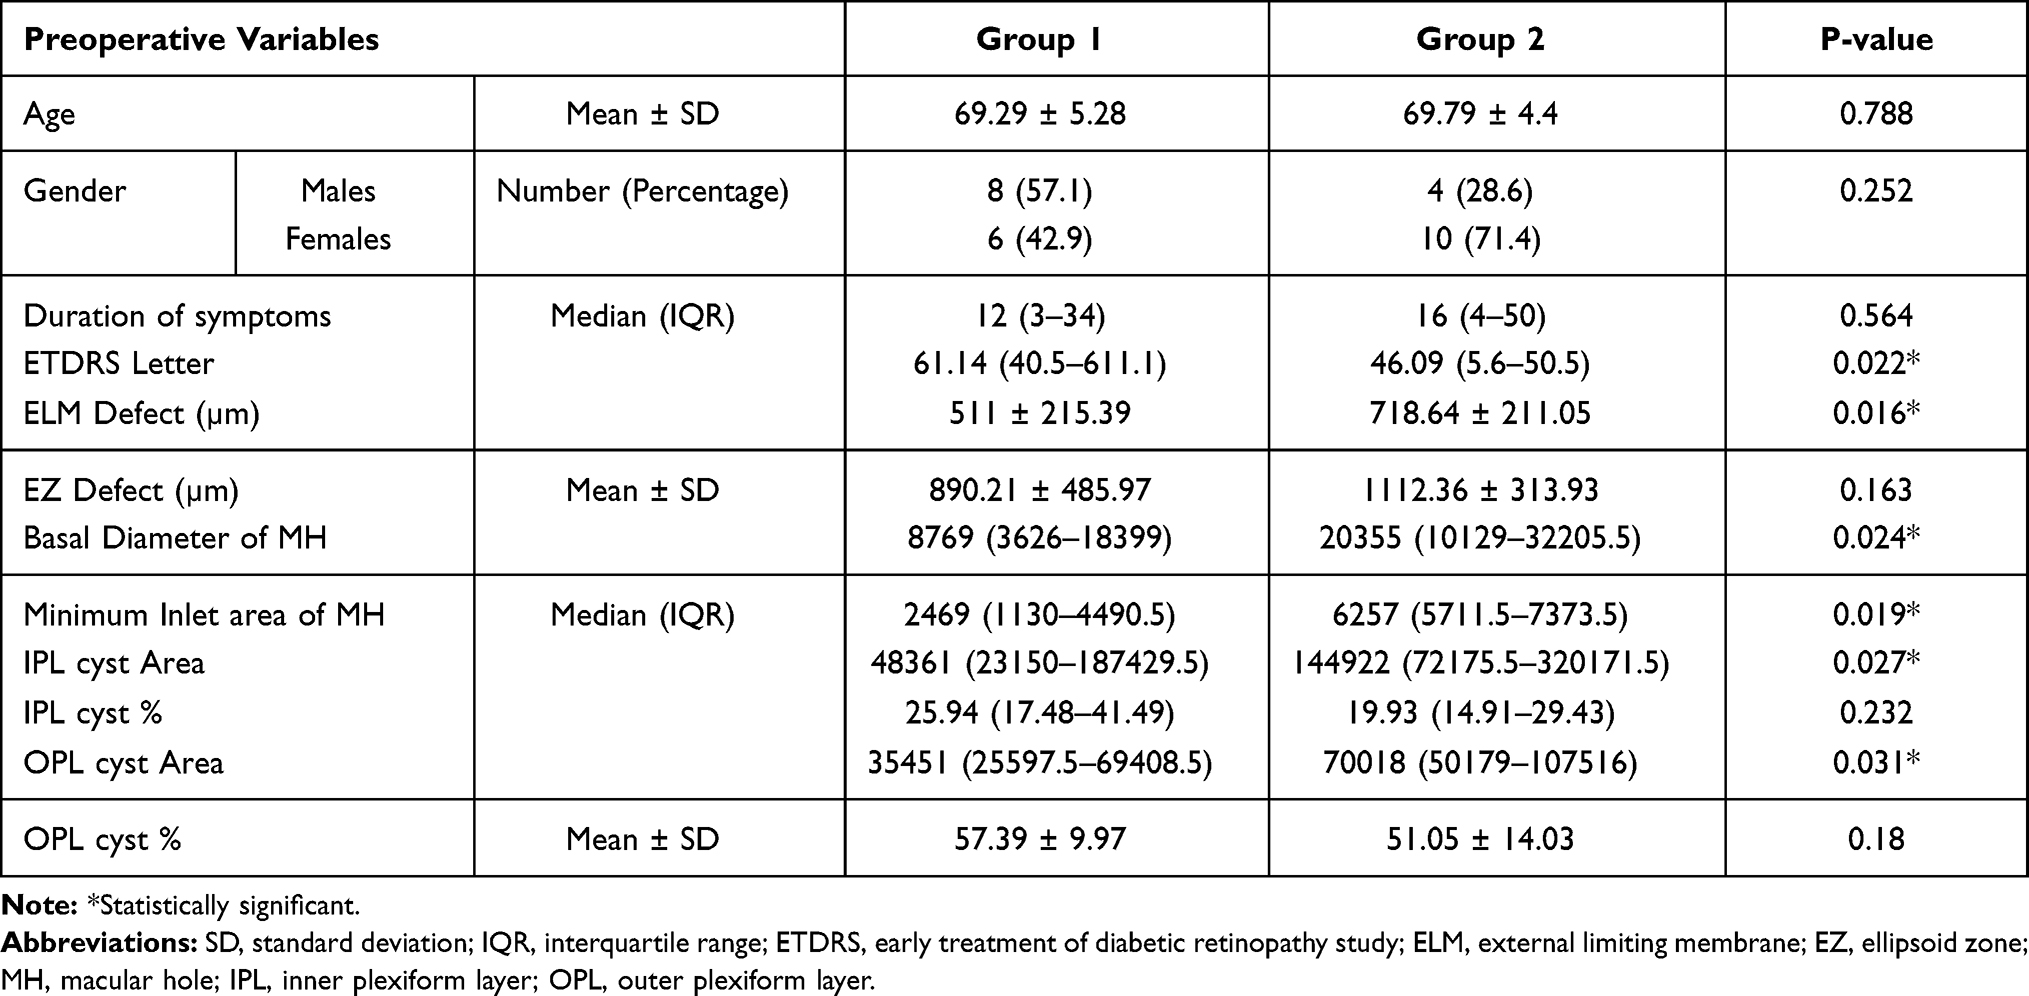 |
Table 1 Difference Between the Preoperative Variables in the Two Groups |
Results
There were 28 eyes of 28 patients included in the study with a male: female ratio of 3:4. All parameters showed good to excellent intergrader agreement of 0.81. All values mentioned below represent averaged values from the two observers.
OCT Measurements
The mean age, days from surgery, IPL area percentage, OPL area percentage, and preoperative EZ defect were comparable between groups. The preop CDVA (p=0.022) and final CDVA (p<0.001) were significantly higher in group 1 as compared to 2, while the basal diameter (p=0.024), minimal inlet area (p=0.019), IPL area (p=0.027), OPL area (p=0.031) and preop and postop ELM defect (p=0.016 and p=045, respectively) and postop EZ defect (p=0.017) were significantly lower. The values have been summarized in Tables 1 and 2, respectively.
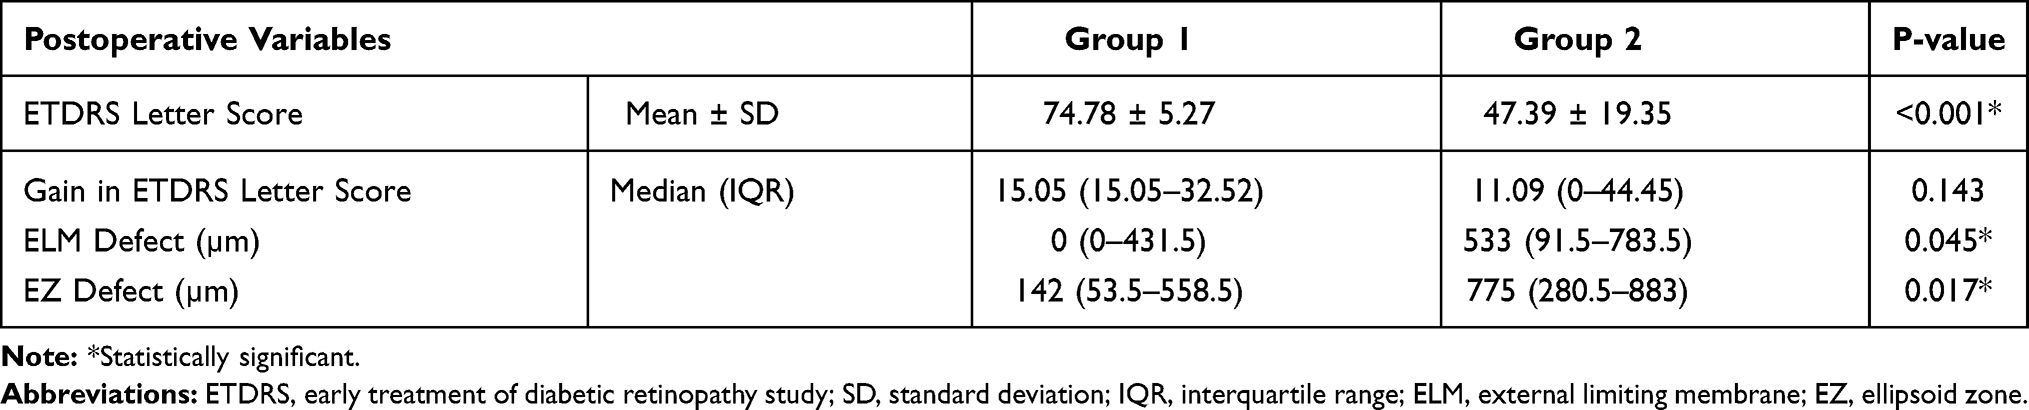 |
Table 2 Difference Between the Postoperative Variables in the Two Groups |
Morphometric Analysis of Intraretinal Cysts
The total area of intraretinal cyst involvement was significantly more in the INL layer as compared to the OPL layer when all 28 eyes were evaluated together and in group 2 eyes. However, this difference in the area of the cyst was not significant in group 1 eyes. When we compared the percentage of cysts within the individual layer, it was significantly more in the OPL layer as compared to the INL layer in both group 1 and group 2 respectively, and in all 28 eyes combined. Tables 3 and 4 provide a detailed comparison of the cyst area and cyst percentage. Figures 3 and 4 illustrate the cysts measurements in group 1 and group 2, respectively.
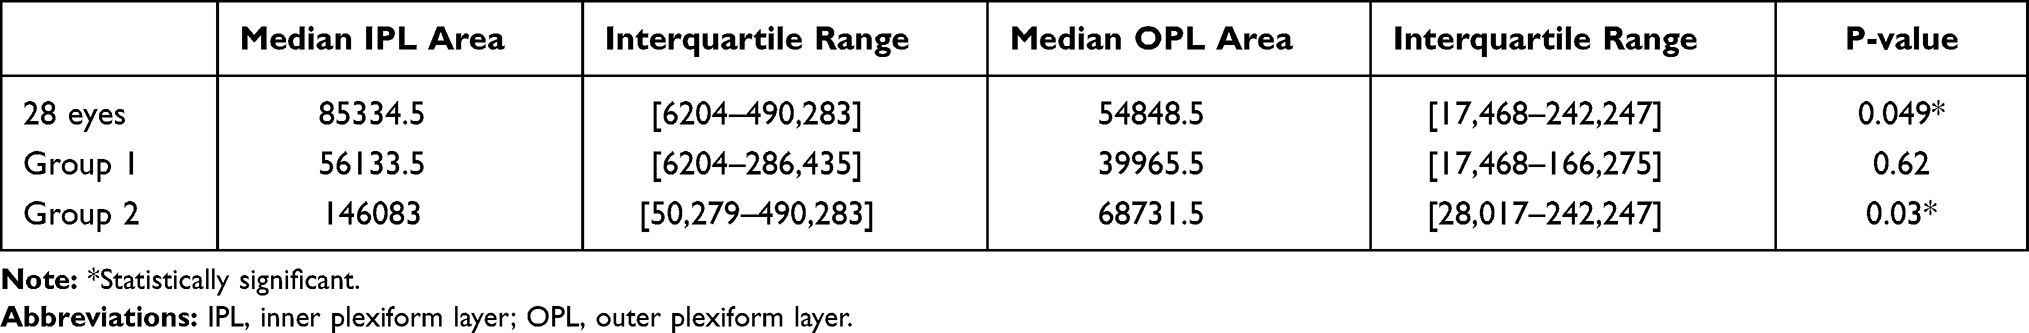 |
Table 3 Difference Between the Area of Cyst Involvement Within the Retinal Layers in the Study Eyes |
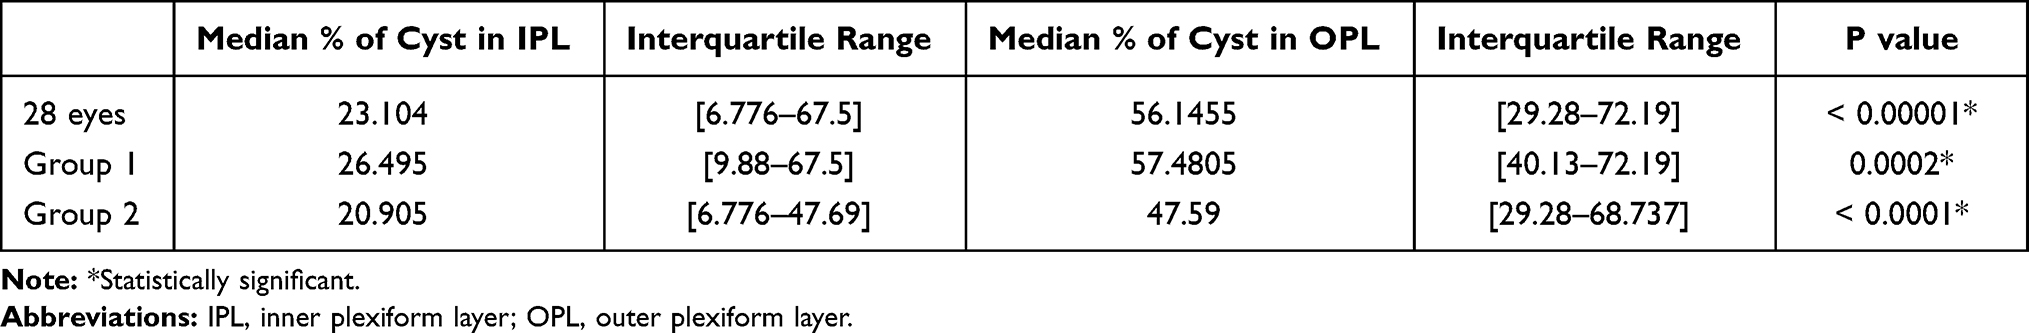 |
Table 4 Difference Between the Percentage of Cysts Involvement Within the Retinal Layers in the Study Eyes |
 |
Figure 3 Group 1; (A) Binarized en face scan of the outer plexiform layer (OPL), with an outer yellow outline of the area of the cyst and inner yellow outline of the area of macular hole. The area between the two yellow outlines denotes the area of OPL cysts (B) Binarized en face scan of the inner nuclear layer (INL), with an outer yellow outline of the area of the cyst and inner yellow outline of the area of macular hole. The area between the two yellow outlines denotes the area of the OPL cyst. (C) Binarized en face scan of the base diameter, with the area marked in yellow. Note the positive correlation in the INL and OPL area and between the basal diameter and OPL/INL cyst area. (Figures 2 and 3) (D) Binarized en face scan of the minimum inlet diameter of the hole, with the area marked in yellow. (E) Cross-sectional spectral-domain optical coherence imaging (SD-OCT) showing preoperative ellipsoid zone (EZ) and external limiting membrane (ELM) loss. (F) Cross-sectional SD-OCT image showing the postoperative ELM and EZ loss. |
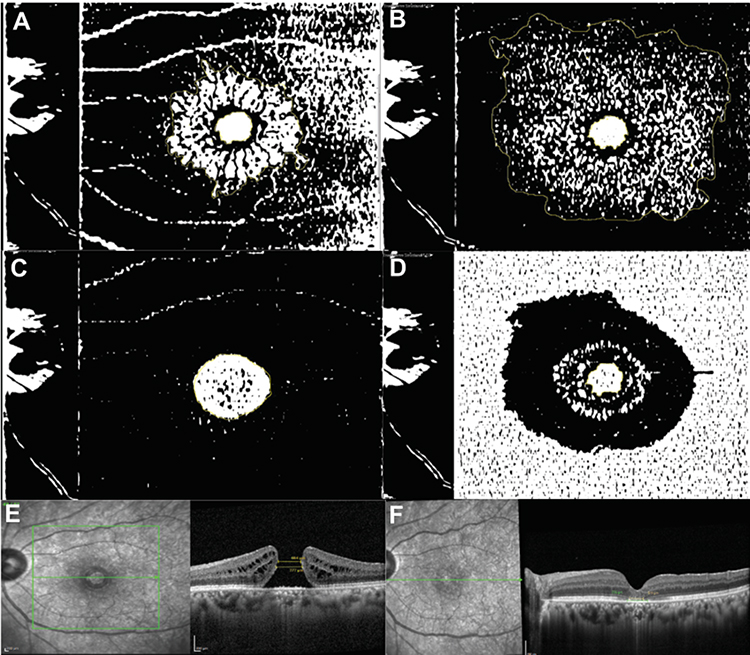 |
Figure 4 Group 2; (A) Binarized en face scan of the outer plexiform layer (OPL), with an outer yellow outline of the area of the cyst and inner yellow outline of the area of macular hole. The area between the two yellow outlines denotes the area of OPL cysts (B) Binarized en face scan of the inner nuclear layer (INL), with an outer yellow outline of the area of the cyst and inner yellow outline of the area of macular hole. The area between the two yellow outlines denotes the area of the OPL cyst. (C) Binarized en face scan of the base diameter, with the area marked in yellow. (D) Binarized en face scan of the minimum inlet diameter of the hole, with the area marked in yellow. (E) Cross-sectional spectral-domain optical coherence imaging (SD-OCT) showing preoperative ellipsoid zone (EZ) and external limiting membrane (ELM) loss. (F) Cross-sectional SD-OCT image showing the postoperative ELM and EZ loss. |
Correlation of Intraretinal Cysts with Other Parameters
There was significant positive correlation between the total cyst area in the OPL and total cyst area in INL in all eyes (r = 0.768; p < 0.001), including group 1 (r = 0.679; p = 0.008) and group 2 (r = 0.771; p < 0.001) eyes. The cyst area in both INL and OPL positively correlated with the basal diameter and minimal inlet area of the hole in both groups except the INL cyst area, which did not correlate with minimal inlet diameter in group 2 eyes. The % of cyst in OPL negatively correlated to the minimal inlet diameter in all 28 eyes combined, but not in group 1 and group 2. The % of cyst in INL positively correlated to the minimal inlet diameter in group 2 eyes only. However, the cyst % in IPL and OPL did not correlate to the basal diameter in any of the groups or all eyes combined. The duration of the hole did not correlate with the area or the % of cysts in the IPL or OPL. The details are provided in Table 5.
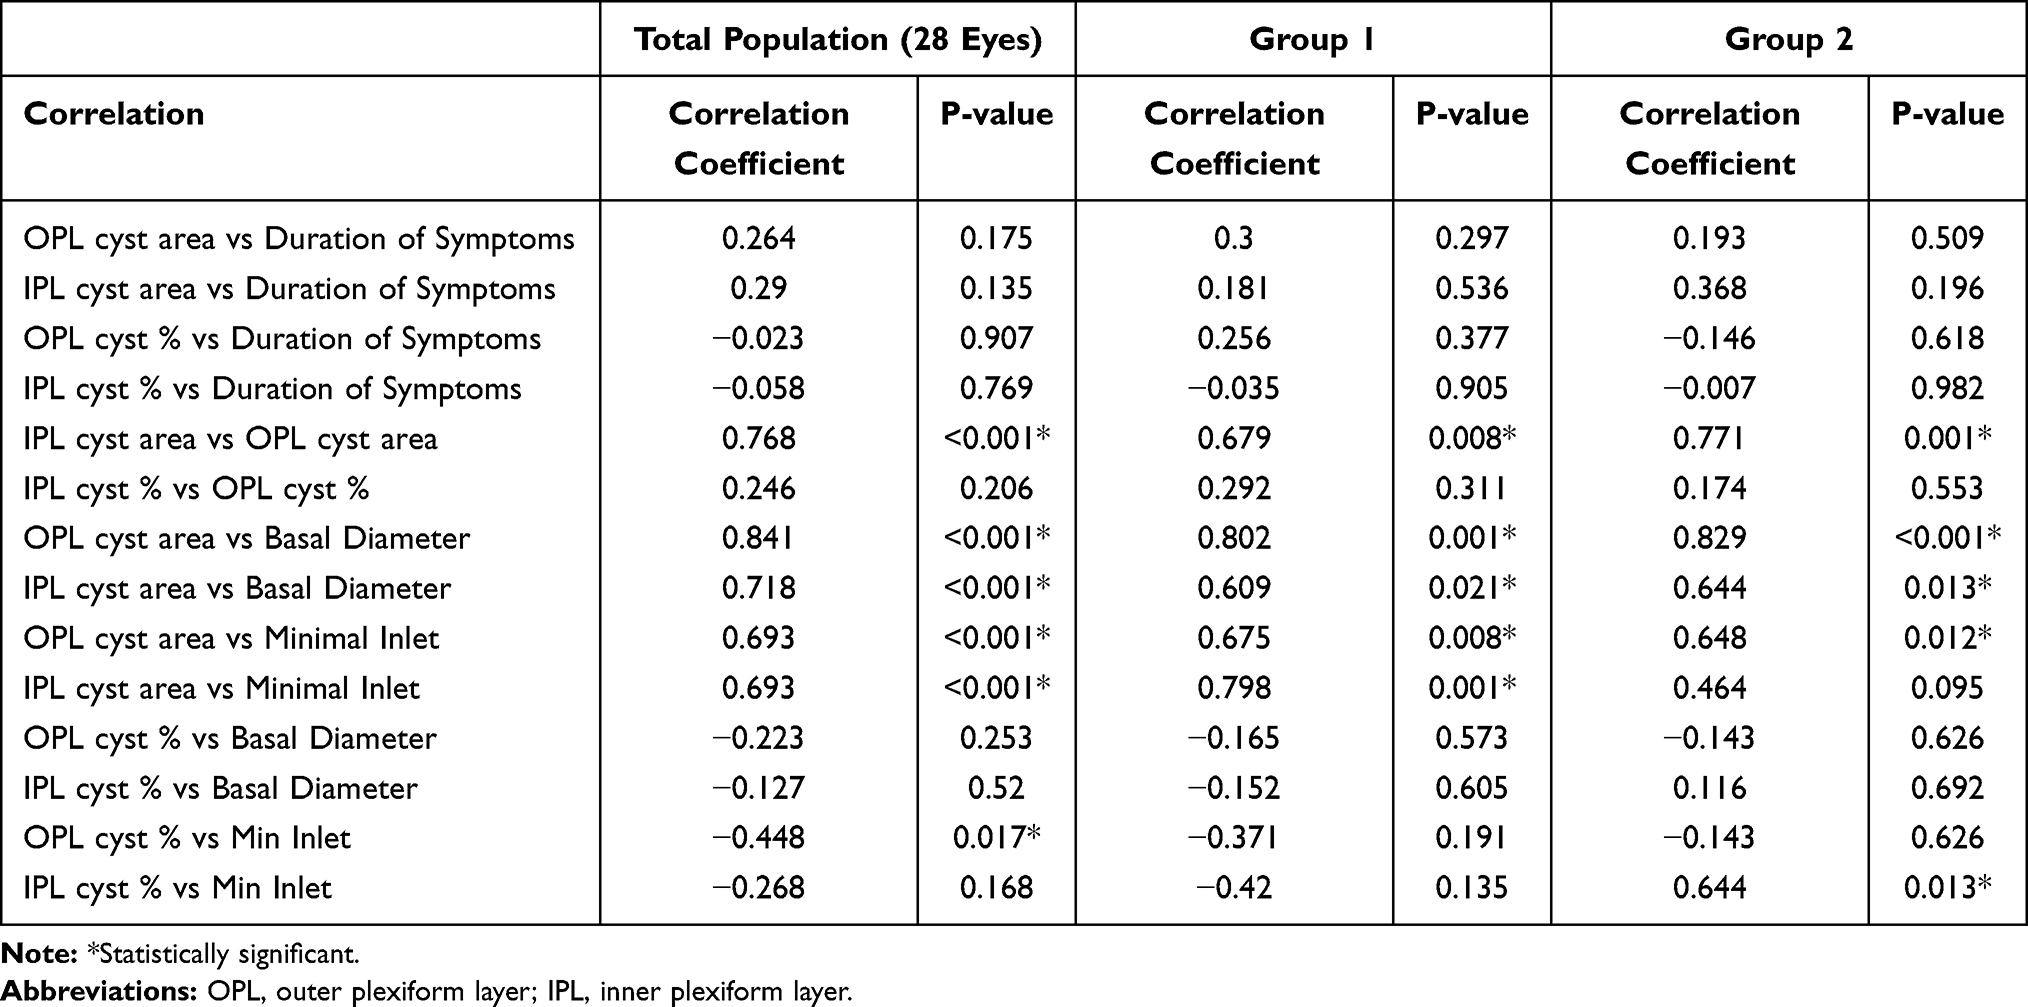 |
Table 5 Correlation of Intraretinal Cysts with Other Parameters in the Study Eyes |
Discussion
In the present study, a detailed microstructural evaluation of retinal layers was performed on en face imaging in eyes with macular holes. A comprehensive assessment showed the presence of intraretinal cystic changes in the inner and outer retinal layers, namely the INL and OPL, respectively. Although the area of these cystic changes was significantly larger in the IPL as compared to the OPL, the percentage of cysts was more in the OPL. At the same time, there was a positive correlation between the area of the cysts in both layers, implying a simultaneous congruous enlargement of cystoid spaces in both layers. Interestingly, an increase in the basal diameter of the hole was associated with a simultaneous enlargement in the area of the cyst in the IPL and the OPL, respectively, and not related to the percentage of cysts within these layers. The inlet diameter correlation with cyst area or percentage of cysts was however not so straightforward.
The presence of intraretinal cystoid cavities has been previously reported with various nomenclatures such as “intraretinal cavities”, “cystoid changes”, and “cystoid spaces”.15–17 However, the pathogenesis of intraretinal cysts remains a mystery. In 2015, Matet et al evaluated the cystic changes around the macular holes on en face imaging.13 They reported a dual profile of cystic cavities in the retina, with elongated stellate pattern in OLP and Henle fiber layer (HFL) and a rounded vertical cylindrical pattern in INL, respectively. This arrangement of cystic spaces corresponded to the “Z-shaped” configuration of Müller cells.13,18 They proposed that these cystic spaces result from either fluid collection in between the retinal framework of Müller cells and Henle fibers or from intracellular fluid accumulation within the Müller cells.13 The tight junctions between the retinal pigment epithelium (RPE) form the outer blood-retinal barrier (oBRB).19 The RPE, which is juxtaposed between the neurosensory retina (NSR) and the choroid, is vital to transport the ions, nutrients, metabolic end products, and fluid and maintain retinal homeostasis.19 The RPE aquaporin channels are critical in mediating the fluid transport from the subretinal space to the choriocapillaris, which happens at a rate of several microliters per square centimeter per hour.19 In the presence of MH, there is a loss of contact between the RPE and the NSR. Due to this, the RPE pump fails to act upon the overlying detached retinal tissue thus compromising the normal intraretinal physiology. This alters the regulated physiological flow of fluid from the NSR towards the choriocapillaris thereby conceivably leading to the accumulation of intraretinal fluid. This can be in the form of intraretinal cysts in the OPL and the IPL. In our study, we observed a positive concordance between the area of the cysts in IPL and OPL along with their synchronized enlargement with expanding the basal diameter of the macular hole. In other words, the wider the basal diameter of the MH, ie, the wider the area of RPE contact loss, the more was the associated intraretinal cystic fluid collection. Thus, we propose that the intraretinal cysts probably arise due to altered retinal physiology due to RPE separation, which we label as the “RPE contact loss” theory. Additionally, these cysts are known to disappear rapidly during the early postoperative period, ie, once the NSR reattaches to the RPE, the intraretinal fluid gets rapidly cleared. This can occur because the healthy RPE commences its fluid transport function from the intraretinal and subretinal space secondary to the re-apposition of the RPE-NSR layers. This lends further credence to the hypothesis of underlying RPE contact loss as the etiopathogenesis for intraretinal cystoids. Moreover, the micromorphic location of these cysts is presumably extracellular, as an intracellular location within the Müller cells would unlikely result in their speedy disappearance postoperatively.
Our study demonstrated a greater area of cysts in the INL as compared to the OPL. Thus, the INL layer contained cysts that were significantly more widespread in nature. Conversely, Matet et al found the mean area of cysts significantly lower in the INL as compared to the OPL and the Henle’s fiber layers.13 However, they did not evaluate the percentage of cysts, whereas, in our study, we observed that the percentage of cysts in the OPL was significantly more than the INL, ie, in the OPL, the cysts were significantly larger in dimensions as compared to the INL cysts. Rizzo et al have shown similar results of small round cysts in the INL and larger stellate cysts in the OPL.20 Their group also demonstrated that OCTA slabs underestimate INL cyst area as compared to OPL cyst area, especially on automated segmentation, and proposed that en face imaging is superior for identification of INL cysts as compared to optical coherence tomography angiography (OCTA).20 To overcome these limitations, in our study we utilized manual segmentation on en face OCT for accurate imaging analysis using two independent graders. The larger percentage of cysts observed in the OPL is suggestive of either early involvement of this layer with/without associated structural weakness in this layer. Early involvement of OPL is supported by the “RPE contact loss” hypothesis which we propose for the pathogenesis of cystoid changes. Additionally, the configuration of the Müller cells which are arranged obliquely in the OPL/Henle’s layer of the foveal region makes this layer highly vulnerable for both MH formation secondary to tractional forces and development of larger cysts.13,21,22 At the same time, the Müller cells are vertically oriented in the inner retinal layers,21,22 making them structurally more stable and accounting for smaller size cysts in IPL noted in our study.
On stratification of eyes based on visual outcomes, we noted a similar finding of cystic involvement in eyes with worse visual outcomes, namely IPL showing a larger area of cyst involvement, while the OPL demonstrating a greater percentage of cystic spaces. Although the proportion of cystic spaces were greater in OPL in eyes with good visual outcomes, we did not note any difference in the area of cyst involvement amongst the INL and OPL in these eyes. These cystic changes in the INL form the crux of the hydration theory and the associated degenerative inner retinal changes.23 In the late 1980s, Gass proposed that hole formation was secondary to tangential traction exerted by the vitreous cortex at the foveal edges.24 This tangential traction is associated with the splitting of glial material in the inner part of the retina leading to hole formation. In 2003, Tornambe proposed that macular hole progression occurs due to destabilization of the underlying retina with progressive hydration of retinal layers.23 Shahlaee et al also provided supplementary evidence for “hydration theory” in their study related to en face based quantitative assessment of intraretinal cystic changes in macular holes.4 A greater area of cystic involvement of inner layers in our study is suggestive of supplementary degenerative changes and is compatible with the “hydration theory”.23 Nevertheless, we did not observe any significant difference in the cyst area between INL and OPL in eyes with good visual outcomes. This is indicative of lesser degenerative damage to the inner retina amongst these eyes, and subsequently a better visual outcome after the surgery.
Previous reports have shown multiple factors such as age, preoperative visual acuity, size of the MH, stage of MH, ELM integrity, and EZ integrity which may affect the postoperative visual recovery in MH surgery.6,7,25,26 The ELM is located at the junction between the cell bodies and the inner segment of the photoreceptors and represents the junctional complexes between the Müller cells and the photoreceptors.27 Its integrity plays a critical role in the functioning of photoreceptors and thus visual restoration.6 The gliotic proliferation of Müller cells is critical not only for the closure of the macular hole but also to restore the integrity of ELM.28,29 Madreperla et al have illustrated the closure of ELM defect by Müller cell processes in an eye operated for stage III macular hole.30 Studies have shown that early postoperative restoration ELM is associated with better visual outcomes and is critical for the restoration of the photoreceptor layer.2 Similar to these previous reports, where the integrity of ELM and EZ formed a critical part in visual recovery post macular hole surgery,2,6,7 our findings suggest that the ELM and EZ defects were a significant predictor of final visual outcomes. Additional, other parameters including the preoperative visual acuity, the basal diameter of MH, the minimal inlet of the MH, the area of cysts in INL and OPL were observed to be significant predictors of final visual outcomes in our study.
Our study has few limitations including retrospective design and shorter follow-up. Also, a lack of comparison with postoperative en face imaging is a shortcoming. Further long-term studies with a comparison of foveal micromorphic structures on en face imaging at follow-up visits to evaluate the changes in intraretinal cysts and restoration of retinal layer integrity would be needed to corroborate our findings. Nonetheless, the strengths of our study include the adequate sample size and performing a detailed morphometric evaluation of retinal structural changes in MH eyes. Also, to the best of our knowledge, this is the first study to perform the en face imaging analysis based on manual segmentation. This is vital as it eliminates any potential segmentation errors arising from automated segmentation slabs. Moreover, all imaging analysis was performed by two graders independently with a very good intergrader agreement of 0.81.
Conclusion
To conclude, in our study, we characterize the intraretinal cystic changes in various retinal layers and correlate the en face imaging features with visual outcomes in macular holes. Correlation of the cystic area dimension in the OPL and IPL along with their relationship to the basal diameter of MH supports the theory of “RPE contact loss” for the origin of cystic changes. Additionally, the role of Müller cells is critical in pathogenesis and recovery of macular holes as evident by en face features such as the greater percentage of cysts in the OPL, larger area of cyst involvement in IPL, and ELM and EZ defects being critical predictors of final visual outcome. The other factors affecting the final visual acuity include the preoperative visual acuity, the basal diameter of MH, the minimal inlet of the MH, and the area of cysts in IPL and OPL, respectively. Further imaging studies and histopathological corroboration are needed to elucidate these architectural retinal changes and their long-term functional impact.
Disclosure
The authors report no conflicts of interest in this work.
References
1. Ezra E. Idiopathic full-thickness macular hole: natural history and pathogenesis. Br J Ophthalmol. 2001;85(1):102–108. doi:10.1136/bjo.85.1.102
2. Wakabayashi T, Fujiwara M, Sakaguchi H, Kusaka S, Oshima Y. Foveal microstructure and visual acuity in surgically closed macular holes: spectral-domain optical coherence tomographic analysis. Ophthalmology. 2010;117(9):1815–1824. doi:10.1016/j.ophtha.2010.01.017
3. Ruiz-Moreno JM, Arias L, Araiz J, García-Arumí J, Montero JA, Piñero DP. Spectral-domain optical coherence tomography study of macular structure as prognostic and determining factor for macular hole surgery outcome. Retina. 2013;33(6):1117–1122. doi:10.1097/IAE.0b013e318285cc3b
4. Shahlaee A, Rahimy E, Hsu J, Gupta OP, Ho AC. Preoperative and postoperative features of macular holes on en face imaging and optical coherence tomography angiography. Am J Ophthalmol Case Rep. 2016;5:20–25. doi:10.1016/j.ajoc.2016.10.008
5. Ip MS, Baker BJ, Duker JS, et al. Anatomical outcomes of surgery for idiopathic macular hole as determined by optical coherence tomography. Arch Ophthalmol. 2002;120(1):29–35. doi:10.1001/archopht.120.1.29
6. Ooka E, Mitamura Y, Baba T, Kitahashi M, Oshitari T, Yamamoto S. Foveal microstructure on spectral-domain optical coherence tomographic images and visual function after macular hole surgery. Am J Ophthalmol. 2011;152(2):283–290.e1. doi:10.1016/j.ajo.2011.02.001
7. Villate N, Lee JE, Venkatraman A, Smiddy WE. Photoreceptor layer features in eyes with closed macular holes: optical coherence tomography findings and correlation with visual outcomes. Am J Ophthalmol. 2005;139(2):280–289. doi:10.1016/j.ajo.2004.09.029
8. Ruiz-Moreno JM, Staicu C, Piñero DP, Montero J, Lugo F, Amat P. Optical coherence tomography predictive factors for macular hole surgery outcome. Br J Ophthalmol. 2008;92(5):640–644. doi:10.1136/bjo.2007.136176
9. Kusuhara S, Teraoka Escaño MF, Fujii S, et al. Prediction of postoperative visual outcome based on hole configuration by optical coherence tomography in eyes with idiopathic macular holes. Am J Ophthalmol. 2004;138(5):709–716. doi:10.1016/j.ajo.2004.04.063
10. Nair U, Menon RR, Mohan A, Vijayan A, Indurkar A, Soman M. External limiting membrane angle as a composite predictive index for post-operative ELM closure in full thickness macular holes. Graefes Arch Clin Exp Ophthalmol. 2020;258(12):2603–2609. doi:10.1007/s00417-020-04949-5
11. Frangieh GT, Green WR, Engel HM. A histopathologic study of macular cysts and holes. Retina. 1981;1(4):311–336. doi:10.1097/00006982-198101040-00008
12. Clamp MF, Wilkes G, Leis LS, et al. En face spectral domain optical coherence tomography analysis of lamellar macular holes. Retina. 2014;34(7):1360–1366. doi:10.1097/IAE.0000000000000115
13. Matet A, Savastano MC, Rispoli M, et al. En face optical coherence tomography of foveal microstructure in full-thickness macular hole: a model to study perifoveal Müller cells. Am J Ophthalmol. 2015;159(6):1142–1151.e3. doi:10.1016/j.ajo.2015.02.013
14. de Azevedo AGB, Takitani GEDS, Godoy BR, et al. Impact of manual correction over automated segmentation of spectral domain optical coherence tomography. Int J Retin Vitr. 2020;6:4. doi:10.1186/s40942-020-0207-6
15. Hee MR, Puliafito CA, Wong C, et al. Optical coherence tomography of macular holes. Ophthalmology. 1995;102(5):748–756. doi:10.1016/S0161-6420(95)30959-1
16. Scholda C, Wirtitsch M, Hermann B, et al. Ultrahigh resolution optical coherence tomography of macular holes. Retina. 2006;26(9):1034–1041. doi:10.1097/01.iae.0000254898.80552.e7
17. Gaudric A, Haouchine B, Massin P, Paques M, Blain P, Erginay A. Macular hole formation: new data provided by optical coherence tomography. Arch Ophthalmol. 1999;117(6):744–751. doi:10.1001/archopht.117.6.744
18. Bringmann A, Pannicke T, Grosche J, et al. Müller cells in the healthy and diseased retina. Prog Retin Eye Res. 2006;25(4):397–424. doi:10.1016/j.preteyeres.2006.05.003
19. Sparrow JR, Hicks D, Hamel CP. The retinal pigment epithelium in health and disease. Curr Mol Med. 2010;10(9):802–823. doi:10.2174/156652410793937813
20. Rizzo S, Savastano A, Bacherini D, Savastano MC. Vascular features of full-thickness macular hole by OCT angiography. Ophthalmic Surg Lasers Imaging Retina. 2017;48(1):62–68. doi:10.3928/23258160-20161219-09
21. Yamada E. Some structural features of the fovea centralis in the human retina. Arch Ophthalmol. 1969;82(2):151–159. doi:10.1001/archopht.1969.00990020153002
22. Kishi S, Kamei Y, Shimizu K. Tractional elevation of Henle’s fiber layer in idiopathic macular holes. Am J Ophthalmol. 1995;120(4):486–496. doi:10.1016/S0002-9394(14)72663-7
23. Tornambe PE. Macular hole genesis: the hydration theory. Retina. 2003;23(3):421–424. doi:10.1097/00006982-200306000-00028
24. Gass JD. Idiopathic senile macular hole. Its early stages and pathogenesis. Arch Ophthalmol. 1988;106(5):629–639. doi:10.1001/archopht.1988.01060130683026
25. Gupta B, Laidlaw DA, Williamson TH, Shah SP, Wong R, Wren S. Predicting visual success in macular hole surgery. Br J Ophthalmol. 2009;93(11):1488–1491. doi:10.1136/bjo.2008.153189
26. Ullrich S, Haritoglou C, Gass C, Schaumberger M, Ulbig MW, Kampik A. Macular hole size as a prognostic factor in macular hole surgery. Br J Ophthalmol. 2002;86(4):390–393. doi:10.1136/bjo.86.4.390
27. Cuenca N, Ortuño-Lizarán I, Pinilla I. Cellular characterization of OCT and outer retinal bands using specific immunohistochemistry markers and clinical implications. Ophthalmology. 2018;125(3):407–422. doi:10.1016/j.ophtha.2017.09.016
28. Funata M, Wendel RT, de la Cruz Z, Green WR. Clinicopathologic study of bilateral macular holes treated with pars plana vitrectomy and gas tamponade. Retina. 1992;12(4):289–298. doi:10.1097/00006982-199212040-00001
29. Rosa RH
30. Madreperla SA, Geiger GL, Funata M, de la Cruz Z, Green WR. Clinicopathologic correlation of a macular hole treated by cortical vitreous peeling and gas tamponade. Ophthalmology. 1994;101(4):682–686. doi:10.1016/S0161-6420(94)31278-4
 © 2021 The Author(s). This work is published and licensed by Dove Medical Press Limited. The
full terms of this license are available at https://www.dovepress.com/terms
and incorporate the Creative Commons Attribution
- Non Commercial (unported, 3.0) License.
By accessing the work you hereby accept the Terms. Non-commercial uses of the work are permitted
without any further permission from Dove Medical Press Limited, provided the work is properly
attributed. For permission for commercial use of this work, please see paragraphs 4.2 and 5 of our Terms.
© 2021 The Author(s). This work is published and licensed by Dove Medical Press Limited. The
full terms of this license are available at https://www.dovepress.com/terms
and incorporate the Creative Commons Attribution
- Non Commercial (unported, 3.0) License.
By accessing the work you hereby accept the Terms. Non-commercial uses of the work are permitted
without any further permission from Dove Medical Press Limited, provided the work is properly
attributed. For permission for commercial use of this work, please see paragraphs 4.2 and 5 of our Terms.