Back to Journals » Clinical Ophthalmology » Volume 11
Intersession test–retest variability of 10-2 MAIA microperimetry in fixation-threatening glaucoma
Authors Wong EN, Morgan WH, Chen FK
Received 30 December 2016
Accepted for publication 11 March 2017
Published 20 April 2017 Volume 2017:11 Pages 745—752
DOI https://doi.org/10.2147/OPTH.S131371
Checked for plagiarism Yes
Review by Single anonymous peer review
Peer reviewer comments 2
Editor who approved publication: Dr Scott Fraser
Evan N Wong,1,2 William H Morgan,1,3 Fred K Chen1,3
1Centre for Ophthalmology and Visual Science (Incorporating Lions Eye Institute), The University of Western Australia, 2Department of Ophthalmology, Sir Charles Gairdner Hospital, 3Department of Ophthalmology, Royal Perth Hospital, Perth, WA, Australia
Purpose: To determine the intersession test–retest variability (TRV) of CenterVue Macular Integrity Assessment (MAIA) microperimeter in glaucoma patients with fixation-threatening field defects.
Methods: This is a prospective case–control study of 27 participants consisting of 13 patients with stable primary open-angle glaucoma and 14 control subjects including 5 healthy individuals and 9 retinal patients (5 with non-neovascular age-related macular degeneration and 4 with inherited retinal disease). Each participant underwent three microperimetry tests in one eye at 1-month intervals. Each test used an identical test strategy of 10-2 Cartesian grid and 4-2 staircase algorithm. We investigated TRV by calculating the coefficient of repeatability (CR) for mean sensitivity (MS) and point-wise sensitivity (PWS) for glaucomatous subjects and retinal and normal subjects. 95% confidence intervals (CIs) for CRs were calculated.
Results: There was no significant change in MS, and the median durations of microperimetry sessions were 9´26ˮ, 8´52ˮ, and 8´46ˮ across the three study visits. The intersession CRs for MS were 1.1, 2.5, and 1.8 dB, and the average CRs for PWS were 3.5, 7.4, and 8.6 dB for healthy controls and retinal and glaucoma patients, respectively. For test loci with 25–34 dB at baseline, CRs for PWS were 8.2 (95% CI: 7.5–8.9) and 4.3 (95% CI: 4.0–4.6) dB for glaucoma and control subjects, respectively.
Conclusion: We found differences in TRV of test loci depending on the baseline sensitivity value. Glaucoma patients had significantly worse TRV for loci that had sensitivity values within the normal range at baseline. The estimated CR has implications for sample size calculation in future glaucoma treatment trials using microperimetry as a clinical endpoint.
Keywords: microperimetry, MAIA perimeter, glaucoma, retinal dystrophy, optic neuropathy
Introduction
Glaucoma management relies critically on the ability of structural and functional assessments to differentiate disease stability from progression. Perimetry is the mainstay of functional assessment because visual acuity loss does not occur until end-stage disease. In some glaucoma patients, conventional perimetry may be unreliable for monitoring glaucomatous field progression because of reduced fixation stability or eccentric fixation in foveal-involving field defect from advanced glaucoma1 or retinal comorbidities such as diabetic maculopathy, retinal vein occlusion, age-related macular degeneration (AMD), or traction maculopathies.2 In such patients, fundus-controlled perimetry, or microperimetry, may offer a more suitable alternative tool for monitoring disease progression.
Microperimetry is an increasingly utilized form of static automated perimetry3 that tracks fundal landmarks to correct rapidly for shifts in gaze and enables manual centration of testing grid at the anatomic fovea. This allows accurate assessment of the central visual field even in the absence of stable and foveal fixation.4 While the use of microperimetry in glaucomatous cohorts is far from mainstream practice, it is beginning to make an entry in clinical research.5–7 With the increasing use of macular ganglion cell complex thickness to monitor glaucoma progression, microperimetry can also offer an opportunity for investigating and predicting patterns of disease progression based on structure–function correlation.8 Like any other psychophysical test, the establishment of test–retest variability (TRV) for microperimetry is essential prior to their adoption into clinical glaucoma practice. While TRV of conventional perimetry has been investigated extensively in glaucoma patients,9–12 there is limited information on the TRV of microperimetry in a glaucoma population. Previous studies have found differences in the TRV of microperimetry in normal healthy subjects, AMD, Stargardt disease, and X-linked retinoschisis.3,13–20 Therefore, it cannot be assumed that the TRV of microperimetry in glaucoma patients is equivalent to those reported for retinal diseases. Furthermore, prior to its use as a clinical outcome measure in those with glaucoma field defect threatening fixation (encroaching into 10° of eccentricity), it is important to have some information on test–retest parameters in this particular cohort.
Therefore, we conducted a pilot study to assess the difference in the intersession TRV of the CenterVue Macular Integrity Assessment (MAIA) between patients with primary open-angle glaucoma and control cohorts consisting of healthy subjects and patients with retinal dystrophy or macular degeneration.
Methods
Participants
This study was approved by the Human Research Ethics Committee of the Sir Charles Gairdner Hospital (protocol number: 2011-063), registered with the Therapeutic Goods Administration of the Australian Government (CTN: 263/2012) and adhered to the tenets of the Declaration of Helsinki. Written informed consent was obtained from all participants prior to enrolment.
Inclusion criteria for the three cohorts were treated open-angle glaucoma patients with stable visual field defects within the central 10°, patients with stable inherited retinal disease (IRD) or non-neovascular AMD serving as positive controls, and healthy subjects serving as negative controls. All glaucoma and retinal patients were recruited from the clinics at the Lions Eye Institute between September 2011 and September 2013. For glaucoma subjects, the definition of fixation-threatening defect was: a scotoma consisting of sensitivity reductions to probability <1% for all of three or more contiguous points within 10° of fixation, with one or more loci 3° from fixation and the others occupying loci at 9° from fixation tested on Humphrey 24-2 threshold standard automated perimetry tests. The minimum three-point defect was consistent over at least two consecutive field tests. The definition of a stable defect was three consecutive field tests or more following two baseline tests showing no change on the guided progression analysis over a period of 2 years or more. In addition, an experienced glaucoma specialist (WHM) reviewed all field test series to confirm clinical stability. Intraoccular pressure (IOP) was not used as part of this definition. Clinical diagnoses of retinal degeneration were confirmed by an experienced retinal specialist (FKC). Normal subjects were recruited from staff or acquaintances of staff of the Lions Eye Institute, and retinal and optic nerve diseases were excluded based on history, ophthalmic examination (FKC), and fundus imaging. Although not representative of the general population or ophthalmic patients, this group is chosen to provide data that are representative of the minimum TRV and highest retinal sensitivity measurements for comparison with the other cohorts.
Exclusion criteria included ocular signs such as intraretinal cysts or subretinal deposits that suggested potential disease progression during the study period, significant media opacity, prior experience with microperimetry, or the inability to give informed consent. Participants with prior experience of performing nonfundus controlled visual field tests were not excluded since all glaucoma patients had previous experience with Humphrey field tests.
The participants were recruited as part of a larger study involving two microperimeters: the MP-1 and the CenterVue MAIA. Here, we will report the results from the 10-2 grid tests of patients with glaucoma, retinal degeneration, and normal subjects from the MAIA microperimeter as a case–control study.
Examination protocol
Participants were examined three times at three separate study visits, 1-month apart (Visits 1, 2, and 3). At each visit, best-corrected visual acuity assessment using the Early Treatment Diabetic Retinopathy Study (ETDRS) chart (Lighthouse International, New York, USA), MAIA microperimetry, and spectral-domain optical coherence tomography (SD-OCT) imaging was performed sequentially. At the baseline visit (Test 1), if both eyes were eligible for the study, one eye was chosen at random to be the study eye using a random number generator (www.random.org). Prior to any slit-lamp examination or imaging of the retina, the study eye was tested on both MAIA and MP-1 microperimeters consecutively. The order of testing was assigned by a list generated by the online random number generator prior to commencement of the study for all study visits. Microperimetry testing is detailed in the Microperimetry Protocol section. Pupil dilation was not performed. Following completion of microperimetry tests, all participants underwent multimodal imaging using the Spectralis HRA + OCT device (Heidelberg Engineering, Heidelberg, Germany). Infrared reflectance fundus image, macular cube volume scans (covering 30°×25° area at scan separation of 120 μm), and optic disc nerve fiber layer circular scans were acquired. All scans were examined to ensure that there was no intraretinal cystic lesion that may change, and no disease progression had occurred during the three study visits.
Microperimetry protocol
Microperimetry was performed using the CenterVue MAIA (CenterVue, Padova, Italy) in a randomized order. Participants were provided with identical instructions on how to perform the assessment at each visit. Although we did not use a practice test prior to the first session, participants were given the opportunity to familiarize themselves with the response trigger. Testing was conducted in a dedicated quiet psychophysics dark room, and the lights were turned off after the nonstudy eye was patched for at least 5 min prior to commencement of testing, and the patient comfortably positioned at the device with chin on the chin rest and finger ready to press the response trigger.
The fixation target was a 2° diameter red ring broken into four segments: the dim white background had a luminance level of 1.27 cd/m2; the maximum stimulus intensity was 317.5 cd/m2, producing a dynamic range of 0–36 dB; stimulus size was Goldmann III; stimulus duration was 200 ms; and testing protocol was 4-2 threshold strategy. The standard 10-2 grid was used, and it consisted of 68 test loci arranged in a Cartesian pattern covering the central 20°.
The MAIA microperimeter has a built-in whole-fundus registration software function that allows follow-up tests to be automatically registered to the baseline (reference) test, thus enabling accurate reassessment of retinal sensitivity at the same test loci examined during the baseline test. In this study, we reported the outcome measures that have been defined previously:14,17 mean sensitivity (MS; mean of all 68 loci) and point-wise sensitivity (PWS; individual score of each loci).
Statistical analysis
All left eye retinal sensitivity measurements were transposed to corresponding loci in the right eye allowing all data to be analyzed as if they were from the same side. A score of −1 dB was assigned to a retinal sensitivity measurement if the patient did not respond to the brightest stimulus (absolute scotoma). In contrast, a score of 0 dB was assigned to loci at which patient only responded to the brightest stimulus. The dynamic range was 37 dB. A P-value of <0.05 was considered statistically significant.
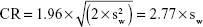
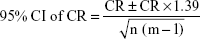
The Shapiro–Wilk test was used to determine if data were normally distributed. One-way ANOVA with repeated measures was used to ascertain if statistically significant changes in MS had taken place across three study visits. The Friedman test was used to determine if changes had taken place in visual acuity and test duration across three visits. We then calculated intersession coefficients of repeatability (CRs) for each outcome measure based on the formula as outlined by Bland and Altman:21
|
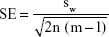
where  is the mean within-subject variance that can be derived from the sum of squares about the subject mean divided by the degrees of freedom. The 95% confidence interval (CI) for the CR can be calculated based on the assumption that the square root of a chi-squared variable, sw, has an approximately normal distribution with the variance being ~1/2.22 Standard error (SE) of sw can then be estimated by the following formula based on the number of subjects (n) and number of repetitions (m):
|
|

|
Bland–Altman plots were used to assess test–retest characteristics across the range of magnitude of outcome measures,23,24 and the presence of systematic changes was assessed by calculating the rank correlation coefficient (Kendall τ-b). The average PWS of healthy subjects, retinal patients, and glaucoma patients were determined using a linear mixed-effects model. For this model, visit number was the fixed effect and stimuli points nested within subjects were the random effect. All statistical analyses were performed on the commercially available Statistical Package for Social Sciences (SPSS, software version 21; IBM Corporation, New York, USA).
Results
Patient characteristics
A total of 27 participants meeting inclusion and exclusion criteria were recruited into the study. There were 13 participants with stable primary open-angle glaucoma and 14 controls. Five of these were healthy subjects, five had non-neovascular AMD, and four had IRD (two subjects with rod-cone dystrophy and two with Stargardt disease). There were 15 females and 12 males with a mean and median (range) age of 59 and 62 (21–86) years, respectively (Table 1). The mean (SD) deviation of 24-2 Humphrey Field Analysis for the glaucomatous cohort was −12.4 (5.4) dB. All participants completed three study visits.
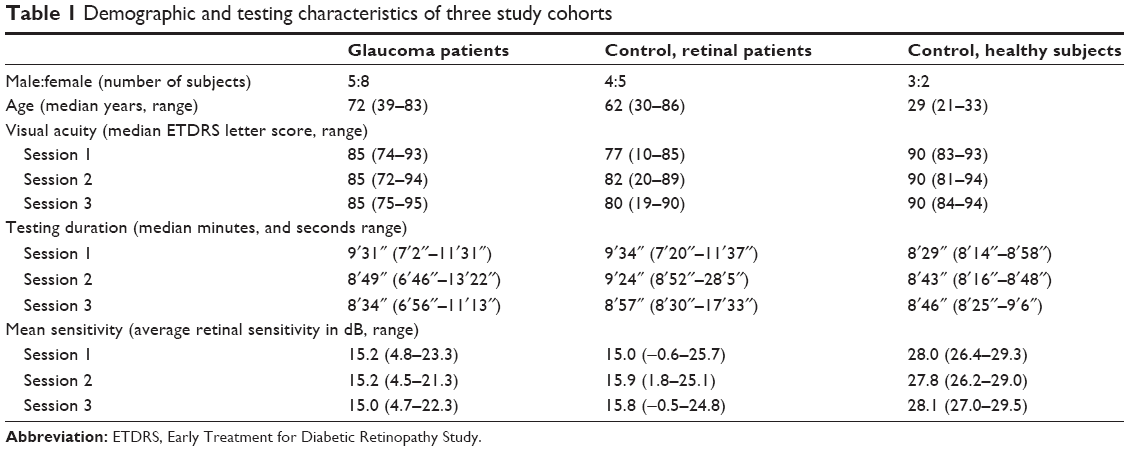 | Table 1 Demographic and testing characteristics of three study cohorts |
Median (IQR) intervals between both Tests 1 and 2, and Tests 2 and 3 for the entire cohort, were 28 (28–33) and 28 (28–35) days, respectively. There was no significant difference in the intervals between the study visits (paired t-test, P=0.71). Review of SD-OCT macular cube and retinal nerve fiber layer scans showed no evidence of disease progression in any patient. There was no change in the median (IQR) visual acuities across three study visits for the entire cohort (Friedman test, P=0.12), and these were 84 (78–86), 83 (79–89), and 85 (80–90) ETDRS letters at Tests 1, 2, and 3, respectively.
Microperimetry outcome
The median (IQR) duration for each microperimetry examination was 9′26″ (8′54″–10′33″), 8′52″ (8′16″–9′25″) and 8′46″ (8′30″–9′45″) for the three study visits. There was no statistically significant difference in testing duration (Friedman test, P=0.36). The average MS was 17.6 dB for all three study visits across all subjects. When analyzed by diagnosis, the average MS was 28.0, 27.8, and 28.1 dB for healthy subjects, 14.9, 15.8, and 15.7 dB for retinal patients, and 15.2, 15.2, and 15.0 dB for glaucoma patients, over the three study visits, respectively. A repeated-measures ANOVA with Greenhouse–Geisser correction demonstrated no statistically significant difference in MS over the three test visits for each of these three cohorts: healthy subjects (P=0.48), retinal patients (P=0.05), and glaucoma patients (P=0.84). Therefore, data from all three visits were included in the calculation of CRs.
Intersession TRV
The plot of within-subject SD versus mean for MS, over three test sessions (Figure 1) as outlined by Bland and Altman,21 demonstrated a moderate positive correlation for glaucomatous subjects (Kendall τ-b; r=0.436, P=0.04) and a weak negative correlation for healthy subjects and retinal patients (Kendall τ-b; r=−0.200, P=0.62 and r=−0.111, P=0.68).
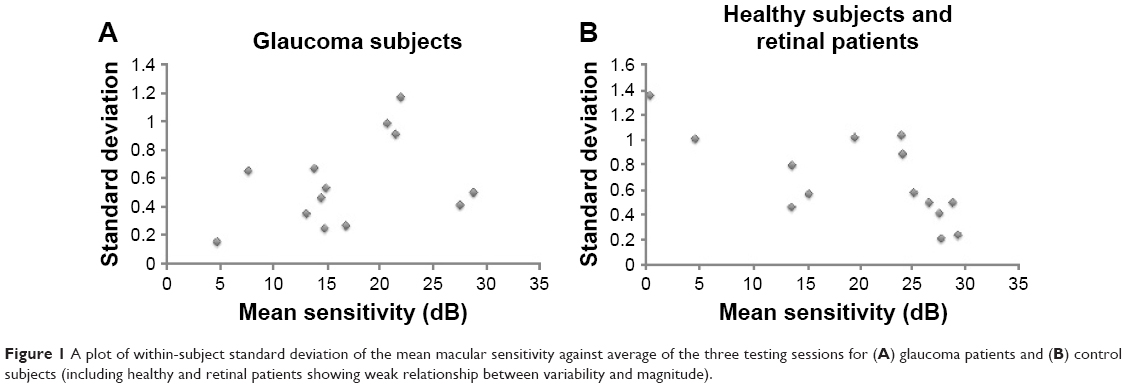 | Figure 1 A plot of within-subject standard deviation of the mean macular sensitivity against average of the three testing sessions for (A) glaucoma patients and (B) control subjects (including healthy and retinal patients showing weak relationship between variability and magnitude). |
CRs for MS for normal subjects, retinal patients, and glaucoma patients were 1.1 (95% CI: 0.6–1.6), 2.5 (95% CI: 1.7–3.3), and 1.8 (95% CI: 1.3–2.3) dB, respectively. The average (SD) CRs for PWS (all 68 coefficients) for healthy controls, retinal patients, and glaucomatous patients were 3.5 (1.2), 7.4 (2.9), and 8.6 (4.4) dB, respectively.
We then analyzed the spread of within-subject SD for PWS (Figure 2A and B) and limits of agreement in PWS between second and third testing sessions (Figure 2C and D). The CRs for PWS were further analyzed by stratifying PWS into four categories of retinal thresholds based on first test session result: absolute scotoma (−1 dB), deep scotoma (0–14 dB), shallow scotoma (15–24 dB), and normal threshold (25 dB and above) (Table 2).
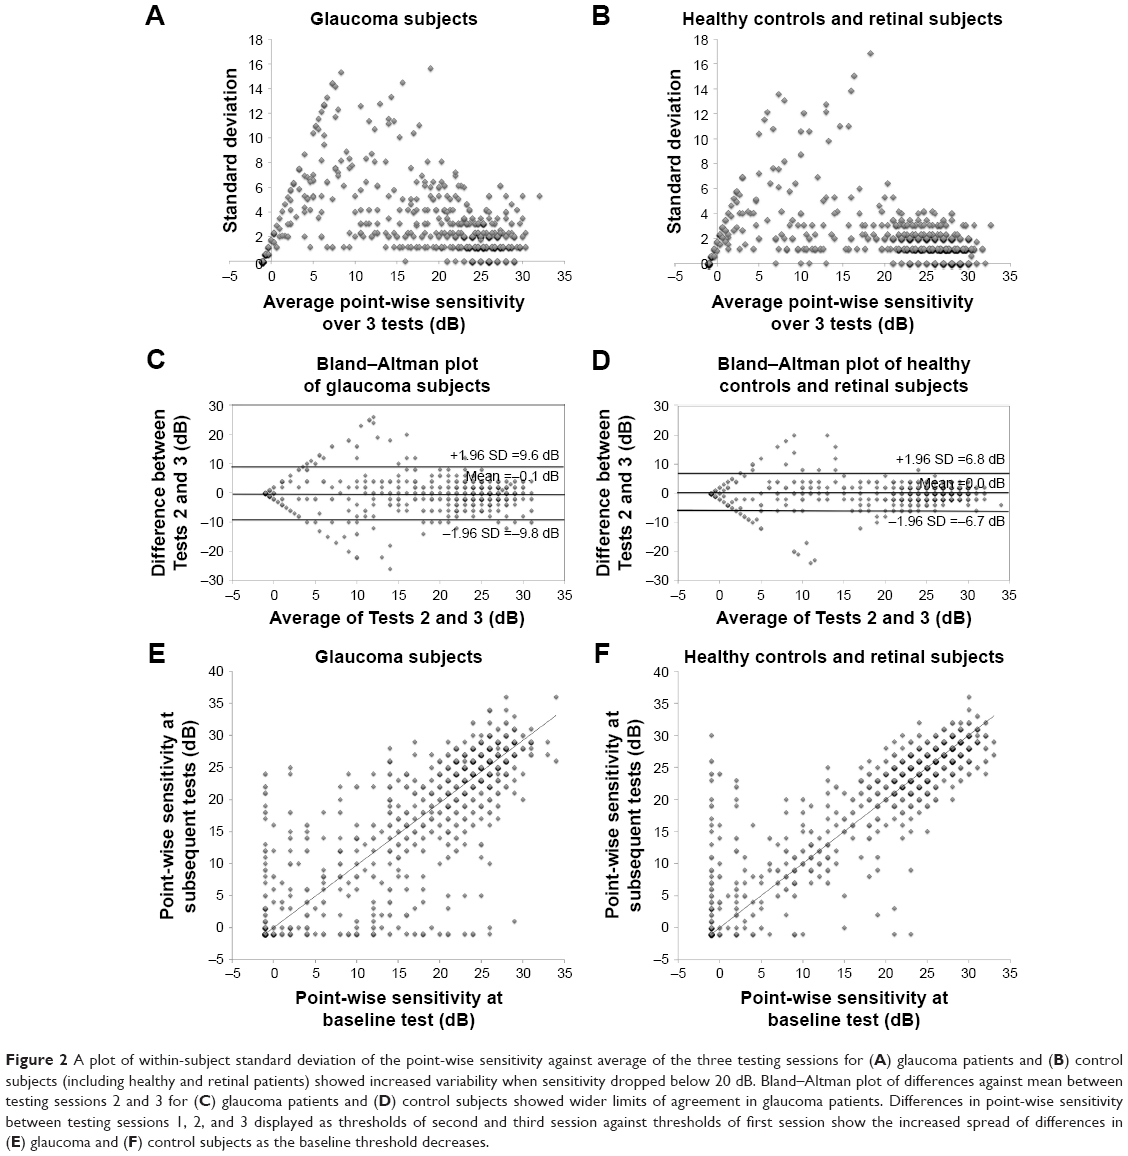 | Figure 2 A plot of within-subject standard deviation of the point-wise sensitivity against average of the three testing sessions for (A) glaucoma patients and (B) control subjects (including healthy and retinal patients) showed increased variability when sensitivity dropped below 20 dB. Bland–Altman plot of differences against mean between testing sessions 2 and 3 for (C) glaucoma patients and (D) control subjects showed wider limits of agreement in glaucoma patients. Differences in point-wise sensitivity between testing sessions 1, 2, and 3 displayed as thresholds of second and third session against thresholds of first session show the increased spread of differences in (E) glaucoma and (F) control subjects as the baseline threshold decreases. |
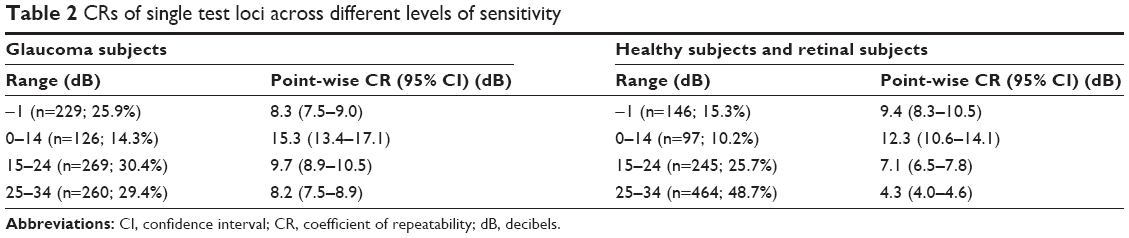 | Table 2 CRs of single test loci across different levels of sensitivity |
The variability of retinal threshold at second and third examinations for each level of retinal threshold obtained at the first examination is shown in Figure 2E and F. The spread of retest values increased significantly as retinal thresholds dropped below 25 dB. However, this spread was more marked in glaucoma patients, where the increase in spread was noticeable at retinal thresholds below 30 dB.
Discussion
We demonstrated no learning effect in microperimetry over three testing sessions. The intersession CRs for MS were 1.1, 2.5, and 1.8 dB, and the average CRs for PWS were 3.5, 7.4, and 8.6 dB for healthy subjects, retinal patients, and glaucoma patients, respectively. Our results suggest that microperimetry reliability in glaucoma patients is worse than healthy control and may be worse than retinal patients in point-wise threshold values.
From our cohort of nine patients with non-neovascular AMD or IRD, we found a much higher CR for both the MS and PWS than that reported previously (Table 3). Notably, there is only one other study that had investigated intersession TRV using the MAIA microperimeter in a cohort of young, healthy normal subjects.20 However, a CR was not reported in that study. The intrasession CR value reported by Wu et al17 in a cohort of dry AMD patients for MS and PWS was 1.08 (95% CI: 0.83–1.33) dB and 3.7 (95% CI: 3.4–4.1) dB, respectively. The inclusion criteria for their cohort were drusen ≥125 μm, multiple drusen ≥63 μm with or without pigmentary abnormalities, or noncentral geographic atrophy. The difference in severity of disease and testing grid (smaller than 10-2 coverage) and protocol (intrasession instead of intersession) may explain the large differences observed in the estimated CRs between ours and previous studies.
 | Table 3 Summary of previously reported values of intersession and intrasession test–retest variability of the MAIA device |
Microperimetry TRV in glaucomatous field defect has been reported recently. One study investigated TRV at the border of deep scotomas using the border of the optic nerve head in healthy individuals as a model of glaucomatous defect18 and found CR for PWS of ±12.99 dB. Another recent publication investigated TRV of MAIA microperimetry in a cohort of 30 individuals with primary open-angle glaucoma.25 However, the authors investigated novel parameters in the peripapillary region, and their results are not comparable to the traditional macular outcome measures presented in this study. TRV of conventional standard automated perimetry in glaucomatous subjects is large, particularly with worsening sensitivity.9 We observed a similar pattern in our cohorts. In both glaucoma and control subjects, we found increased within-subject SD below 20 dB of retinal sensitivity (Figure 2A and B). This concurs with previous findings9,10 and carries the implication that areas that are of greatest clinical importance are also the ones in which it is most difficult to determine true change.10
To explore the effect of retinal sensitivity on CR of PWS, we stratified all test loci threshold results into four categories: absolute scotoma (−1 dB), deep scotoma (0–14 dB), shallow scotoma (15–24 dB), and normal threshold (25 dB or above). We found that the CR for the lower two categories were comparable between cohorts, as evidenced by the overlapping CIs. In contrast, the upper two categories had significant differences: 9.7 (95% CI: 8.9–10.5) versus 7.1 (95% CI: 6.5–7.8) dB and 8.2 (95% CI: 7.5–8.9) versus 4.3 (95% CI: 4.0–4.6) dB for glaucomatous versus retinal and normal subjects, respectively. The CR for normal threshold loci in retinal and normal subjects was almost half that of normal points in glaucomatous subjects. This observation is also demonstrated in Figure 2E and F, in which the spread of retest values is significantly larger in the glaucomatous cohort even when the baseline values were within the normal range (ie, >24 dB). The unexpected high TRV in regions of normal sensitivity in glaucomatous eyes may be driven by loci at the edge of an absolute glaucomatous defect. A slight misalignment between consecutive microperimetry tests may lead to a test loci falling into an absolute scotoma resulting in more than 25 dB fluctuation. In contrast, steep scotoma within regions of normal sensitivity is unusual in non-neovascular AMD or IRD because the region of atrophy (absolute scotoma) is usually surrounded by a wide penumbra of mild-to-moderate retinal dysfunction. Therefore, threshold profile in retinal degeneration is more forgiving to slight misalignment of testing grid in follow-up examinations.
There are a number of limitations in this study. First, we used the 10-2 test grid. This may be too coarse a grid to study foveal-threatening disease; however, it was chosen because glaucoma specialists are familiar with the grid, and it allows large regions of structure–function correlation with ganglion cell complex thickness. Second, only patients with either retinal degeneration or glaucoma were selected for this study. Therefore, the results are not immediately transferrable to patients with both types of disease, in whom microperimetry may be of benefit in distinguishing between disease progressions due to photoreceptor versus ganglion cell loss. Third, the sample size was small and the cohorts were not age-matched, reflecting the difficulty in recruiting for intersession studies in patients and volunteers who do not usually require such frequent clinic visits. Age of the study participant may have an impact on TRV, but this has not been examined in previous studies. Finally, our study investigated TRV over three visits separated by only 1 month. Intersession TRV over longer test–retest intervals or more than three testing sessions remains to be investigated. We chose a study period of only 2 months as it was deemed too short a period for true progression to become a significant factor in assessing the TRV of the data. These limitations will need to be addressed by future studies using the pilot data from our study for sample size calculation.
Conclusion
This pilot study provided an estimated CR for MAIA microperimetry in glaucoma patients. We demonstrated differences in CR values in glaucoma patients compared with healthy controls and retinal patients. The estimated CR has implications for sample size calculation in future glaucoma treatment trials using microperimetry as a clinical endpoint.
Acknowledgment
Dr FK Chen has received funding from the Sylvia and Charles Viertel Clinical Investigatorship Grant, Ophthalmic Research Institute of Australia Research Grant, Retina Australia Research Grant, and the NHMRC Early Career Fellowship (APP1054712) for this work.
Disclosure
The authors report no conflicts of interest in this work.
References
Kameda T, Tanabe T, Hangai M, Ojima T, Aikawa H, Yoshimura N. Fixation behavior in advanced stage glaucoma assessed by the MicroPerimeter MP-1. Jpn J Ophthalmol. 2009;53(6):580–587. | ||
Griffith J, Goldberg J. Prevalence of comorbid retinal disease in patients with glaucoma at an academic medical center. Clin Ophthalmol. 2015;9:1275–1284. | ||
Wong EN, Mackey DA, Morgan WH, Chen FK. Intersession test-retest variability of conventional and novel parameters using the MP-1 microperimeter. Clin Ophthalmol. 2015;10:29–42. | ||
Rohrschneider K, Bültmann S, Springer C. Use of fundus perimetry (microperimetry) to quantify macular sensitivity. Prog Retin Eye Res. 2008;27(5):536–548. | ||
Arrico L, Giannotti R, Fratipietro M, Malagola R. Fascicular visual field defects in open-angle glaucoma: evaluation with microperimetry. J Ophthalmol. 2016;2016:8274954. | ||
Kulkarni SV, Coupland SG, Stitt DM, Hamilton J, Brownstein JJ, Damji KF. Efficacy of SLO-Microperimetry and Humphrey for evaluating macular sensitivity changes in advanced glaucoma. Can J Ophthalmol. 2013;48(5):406–412. | ||
Huang P, Shi Y, Wang X, Zhang SS, Zhang C. Use of microperimetry to compare macular light sensitivity in eyes with open-angle and angle-closure glaucoma. Jpn J Ophthalmol. 2012;56(2):138–144. | ||
Sato S, Hirooka K, Baba T, Tenkumo K, Nitta E, Shiraga F. Correlation between the ganglion cell-inner plexiform layer thickness measured with cirrus HD-OCT and macular visual field sensitivity measured with microperimetry. Invest Ophthalmol Vis Sci. 2013;54(4):3046–3051. | ||
Heijl A, Lindgren A, Lindgren G. Test-retest variability in glaucomatous visual fields. Am J Ophthalmol. 1989;108:130–135. | ||
Wall M, Woodward KR, Doyle CK, Artes PH. Repeatability of automated perimetry: a comparison between standard automated perimetry with stimulus size III and V, matrix, and motion perimetry. Invest Ophthalmol Vis Sci. 2009;50(2):974–379. | ||
Artes PH, Iwase A, Ohno Y, Kitazawa Y, Chauhan BC. Properties of perimetric threshold estimates from Full Threshold, SITA Standard, and SITA Fast strategies. Invest Ophthalmol Vis Sci. 2002;43(8):2654–2659. | ||
Spenceley SE, Henson DB. Visual field test simulation and error in threshold estimation. Br J Ophthalmol. 1996;80(4):304–308. | ||
Jeffrey BG, Cukras CA, Vitale S, Turriff A, Bowles K, Sieving PA. Test–retest intervisit variability of functional and structural parameters in X-linked retinoschisis. Transl Vis Sci Technol. 2014;3(5):5. | ||
Chen FK, Patel PJ, Xing W, et al. Test-retest variability of microperimetry using the Nidek MP1 in patients with macular disease. Invest Ophthalmol Vis Sci. 2009;50(7):3464–3472. | ||
Anastasakis A, McAnany JJ, Fishman GA, Seiple WH. Clinical value, normative retinal sensitivity values, and intrasession repeatability using a combined spectral domain optical coherence tomography/scanning laser ophthalmoscope microperimeter. Eye (Lond). 2011;25(2):245–251. | ||
Cideciyan AV, Swider M, Aleman TS, et al. Macular function in macular degenerations: repeatability of microperimetry as a potential outcome measure for ABCA4-associated retinopathy trials. Invest Ophthalmol Vis Sci. 2012;53(2):841–852. | ||
Wu Z, Ayton LN, Guymer RH, Luu CD. Intrasession test-retest variability of microperimetry in age-related macular degeneration. Invest Ophthalmol Vis Sci. 2013;54(12):7378–7385. | ||
Wu Z, Jung CJ, Ayton LN, Luu CD, Guymer RH. Test-retest repeatability of microperimetry at the border of deep scotomas. Invest Ophthalmol Vis Sci. 2015;56(4):2606–2611. | ||
Ismail SA, Sharanjeet-Kaur S, Mutalib HA, Ngah NF. Macular retinal sensitivity using MP-1 in healthy Malaysian subjects of different ages. J Optom. 2015;8(4):266–272. | ||
Molina-Martín A, Piñero DP, Pérez-Cambrodí RJ. Reliability and intersession agreement of microperimetric and fixation measurements obtained with a new microperimeter in normal eyes. Curr Eye Res. 2016;41(3):400–409. | ||
Bland JM, Altman DG. Agreement between methods of measurement with multiple observations per individual. J Biopharm Stat. 2007;17(4):571–582. | ||
University of York. [webpage on the Internet]. What is the standard error of the wihin-subject stand deviation, sw? Available from http://www-users.york.ac.uk/~mb55/meas/seofsw.htm. Accessed February 23, 2017. | ||
Bland JM, Altman DG. Statistical methods for assessing agreement between two methods of clinical measurement. Lancet. 1986;1(8476):307–310. | ||
Bland JM, Altman DG. Measuring agreement in method comparison studies. Stat Methods Med Res. 1999;8(2):135–160. | ||
Wu Z, McKendrick AM, Hadoux X, et al. Test-retest variability of fundus-tracked perimetry at the peripapillary region in open angle glaucoma. Invest Ophthalmol Vis Sci. 2016;57(8):3619–3625. |
 © 2017 The Author(s). This work is published and licensed by Dove Medical Press Limited. The
full terms of this license are available at https://www.dovepress.com/terms
and incorporate the Creative Commons Attribution
- Non Commercial (unported, 3.0) License.
By accessing the work you hereby accept the Terms. Non-commercial uses of the work are permitted
without any further permission from Dove Medical Press Limited, provided the work is properly
attributed. For permission for commercial use of this work, please see paragraphs 4.2 and 5 of our Terms.
© 2017 The Author(s). This work is published and licensed by Dove Medical Press Limited. The
full terms of this license are available at https://www.dovepress.com/terms
and incorporate the Creative Commons Attribution
- Non Commercial (unported, 3.0) License.
By accessing the work you hereby accept the Terms. Non-commercial uses of the work are permitted
without any further permission from Dove Medical Press Limited, provided the work is properly
attributed. For permission for commercial use of this work, please see paragraphs 4.2 and 5 of our Terms.