
Back to Journals » Drug Design, Development and Therapy » Volume 20
Interpretable Machine Learning Identifies Hub Biomarkers of Renal Fibrosis and Their Potential Medical Applications
Authors Zhang X, Lv Y, Wang H  , Yao R, Du Y, Shi J, Fan J, Yu B, Zheng G
Received 15 July 2025
Accepted for publication 1 March 2026
Published 30 March 2026 Volume 2026:20 536281
DOI https://doi.org/10.2147/DDDT.S536281
Checked for plagiarism Yes
Review by Single anonymous peer review
Peer reviewer comments 2
Editor who approved publication: Dr Tuo Deng
Xiaotian Zhang,1,2 Yue Lv,3 Heng Wang,4 Ruixin Yao,3 Yurun Du,5 Jiarong Shi,2 Jerry Fan,6 Baofeng Yu,1 Guoping Zheng4
1School of Basic Medicine and Forensic Medicine, Shanxi Medical University, Taiyuan, People’s Republic of China; 2Department of Medical Laboratory, Shanxi University of Medicine, Fenyang, People’s Republic of China; 3Basic Sciences Department, Shanxi University of Medicine, Fenyang, People’s Republic of China; 4Centre for Transplant and Renal Research, Westmead Institute for Medical Research, The University of Sydney, Sydney, NSW Australia; 5Department of Nephrology, Second Clinical School of Shanxi Medical University, Taiyuan, People’s Republic of China; 6The Hotchkiss School, Lakeville, CT, USA
Correspondence: Guoping Zheng; Baofeng Yu, Email [email protected]; [email protected]
Background: Renal fibrosis is a crucial pathogenic driver of chronic kidney disease (CKD). However, its heterogeneous limits accurate assessment by renal biopsy. The study aimed to identify accurate diagnostic biomarkers and potential therapeutic targets for renal fibrosis.
Methods: We analyzed renal fibrosis transcriptomic datasets from the GEO database to identify differentially expressed genes (DEGs). Hub genes were selected through the Least Absolute Shrinkage and Selection Operator (LASSO) regression, with their association to immune infiltration subsequently analyzed using CIBERSORT. Interpretable machine learning models, specifically eXtreme Gradient Boosting (XGBoost) and Deep Neural Network (DNN), were developed for sample classification, with their interpretability and key biomarker contribution assessed through Shapley Additive Explanations (SHAP) analysis. The predicted hub genes were validated using histological staining, Western blot (WB) experiments, and functional cellular assays in rat renal fibroblast cells and mouse renal fibrosis models. Finally, potential therapeutic drugs targeting the hub genes were identified through molecular docking.
Results: We identified 26 fibrosis-related genes for renal fibrosis and established their correlations with inflammatory and immune infiltration. Machine learning models demonstrated high diagnostic accuracy (XGBoost: 96%; DNN:92%). SHAP analysis highlighted AGR2 and DOCK2 as top predictors. Subsequent experimental validation confirmed their significant upregulation and functional involvement in fibrotic processes. Molecular docking identified several existing drugs such as Dexamethasone and Ciclosporin as potential AGR2-targeting agents.
Conclusion: This study identifies AGR2 and DOCK2 as novel biomarkers and therapeutic targets for renal fibrosis, highlighting their dual potential for diagnostic application and targeted therapy development.
Keywords: renal fibrosis, immune microenvironment, myofibroblasts, SHAP, DOCK2, AGR2
Introduction
Chronic kidney disease (CKD) is a progressive condition characterized by decreased kidney function and irreversible structural damage, with renal fibrosis being a pivotal pathological driver.1,2 Fibrotic niches describe specialized tissue microenvironments that enable the activation of fibroblasts in fibrosis.3,4 In the niches, the fibroblasts are transformed into myofibroblasts by expressing α-SMA (alpha-Smooth Muscle Actin), the key process leading to the establishment of renal fibrosis.5,6 In recent years, although there has been significant progress in the processes involved in understanding the mechanisms of renal fibrosis, treatment for the condition remains grossly inadequate. Consequently, the identification of reliable biomarkers for early detection and precise monitoring has become even more critical.
Renal biopsy continues to be the gold standard for the diagnosis of renal fibrosis.7,8 However, invasive by nature, it only measures the pathological changes within the sampled region and cannot provide the complete picture of fibrosis in the entire kidney.9–11 That makes the identification of sensitive and low-risk biomarkers for renal fibrosis even more critical.
In recent years, the marriage between high-throughput sequencing and bioinformatics has proven to be an effective means for the identification of genes involved in renal fibrosis.12,13 While the complexity and sheer volume of biological information these technologies provide pose significant challenges for analysis using conventional means, machine learning (ML) has proven itself capable of overcoming these by being able to analyze large datasets, recognize patterns, and make accurate predictions.14–16 Despite the potential that ML offers, the “black-box” nature of the majority of ML models makes them less interpretable in biological research and has kept them from being widely accepted.17,18 To overcome this problem, SHAP have been developed as an effective method for interpreting the predictions made by ML models and boosting the transparency and dependability of these predictions. It quantifies the contribution of each gene to the model’s output, providing direct biological interpretability. This allows the model’s decisions to be traced back to relevant genes, moving beyond a black box.19
In this study, we identified two key genes, DOCK2 and AGR2, which are strongly linked to renal fibrosis through transcriptome data analysis and machine learning (ML) approaches. High-accuracy models highlighted their importance, and functional experiments confirmed that they critically promote fibrotic activation. These results establish DOCK2 and AGR2 as promising diagnostic biomarkers and validated therapeutic targets.
Materials and Methods
Dataset Acquisition
The gene expression data for renal fibrosis samples and control samples were obtained from the Gene Expression Omnibus (GEO) database. To overcome the batch effects and process the data, we applied the Combat algorithm on two datasets (GSE76882 and GSE22459) which were generated using expression profiling by the array. There were 124 control and 175 renal fibrosis samples in the combined dataset. We also analyzed dataset GSE135327 generated by high-throughput sequencing with 12 control and 18 renal fibrosis samples.
DEG Analysis
DEGs between control and renal fibrosis samples were identified utilizing the R package “limma”.20 The selection criteria were defined as a log fold change (FC) greater than 1 and a false discovery rate (FDR) below 0.05. Consequently, Gene Ontology (GO) and Kyoto Encyclopedia of Genes and Genomes (KEGG) enrichment analyses were conducted using the R packages “clusterProfiler” and “org.Hs.egdb”.21
Identification of Candidate Biomarkers for Renal Fibrosis
The two-step differential analysis was used to find the intersections of genes that were upregulated and those that were downregulated. Logistic regression based on the LASSO was employed to identify predictive genes associated with renal fibrosis. The optimal regularization parameter (λ) was determined via 10-fold cross-validation. We reported both λ.min (yielding the minimum classification error) and λ.1se (representing the most parsimonious model within one standard error), and selected λ.min for the final feature selection to enhance the reproducibility and robustness of the model. The R package “glmnet” was utilized for this analysis.22 The potential biomarkers associated with renal fibrosis were uploaded into the Search Tool for the Retrieval of Interacting Genes (STRING) database to generate the protein-protein interaction (PPI) network.
Correlation Analysis of Immune Infiltration and Potential Biomarkers
The CIBERSORT algorithm was applied to acquire the percentage of immune infiltration cells in the renal fibrosis and control samples. Specifically, the CIBERSORT algorithm was run using the LM22 leukocyte gene signature matrix as the reference, with 1000 permutations (perm = 1000) and quantile normalization enabled (QN = TRUE). The correlation between candidate biomarkers and immune cells was assessed using Spearman rank correlation analysis, and the results were visualized with the R package “ggplot2” to facilitate a more intuitive interpretation of their relationship.
The Construction of Two Classification Models for Renal Fibrosis
In the merged dataset for the renal fibrosis classification model, we randomly divided the patients into two groups: 70% were assigned to the training group for model development, and the remaining 30% were allocated to the testing group for performance evaluation. We built the classification model using two machine learning approaches: DNN and XGBoost. To assess the model’s performance, we evaluated it on the test set using multiple metrics, including AUC, accuracy, sensitivity, specificity, precision, and F1 score. Finally, we used SHAP values to interpret how the machine learning models made their predictions, providing insights into their underlying mechanisms.
Molecular Docking
Gene set analysis was performed using the Drug Signatures Database (DSigDB) to identify drug signatures associated with the genes.23 The three-dimensional structures of the target human protein receptors and the identified drug compounds were retrieved from the Protein Data Bank (PDB), PubChem and ChemSpider databases, respectively. All structures were prepared for docking using standard preprocessing steps (eg, removal of water molecules, addition of hydrogens, calculation of charges, and format conversion). Molecular docking simulations were performed using AutoDock Vina. The detailed parameters for the docking simulations are provided in the Supplemental Material 1. A binding energy (affinity) of less than −7.0 kcal/mol is generally considered indicative of strong binding activity, suggesting a stable interaction model. For each compound, the conformation with the most favorable binding affinity was selected as the final model for further analysis. Visualization and analysis of the docking results were conducted using PyMOL.
Cell Culture
The rat renal fibroblast (NRK-49F) cells were acquired from the National Infrastructure of Cell Line Resource (NICR) and grown in DMEM containing 10% fetal bovine serum (FBS) under normal conditions at 37°C with 5% CO2 in a humidified incubator. The NRK-49F cells were stimulated with varying concentration of recombinant TGF-β for 48h.
Cell Transfection
To knock down AGR2 or DOCK2 expression, NRK-49F cells were transfected with gene-specific or control siRNAs using Lipofectamine 2000. After 48 hours, the cells were treated with TGF-β (10 ng/mL) for 24 hours to induce fibrotic responses before being harvested for analysis. The sequences of the siRNAs are provided in the Supplemental Table 1.
Animal Models
Male C57BL/6 mice weighing approximately 18–20g (n=6 per group) were anesthetized with isoflurane. The mice to undergo surgery were randomly selected and assigned into two groups: the Sham group and the Unilateral Ureteral Obstruction (UUO) group, using a random number table The UUO model was established as follows: a small incision was made on the left dorsum to expose the kidney and ureter. The left ureter was ligated with 3–0 silk sutures, while the sham-operated group underwent the same procedure without ligation. Fourteen days following surgery, the mice were euthanized, and the left kidneys were harvested. All subsequent histological analyses and outcome assessments were performed by investigators blinded to the group allocation.
Histological Analysis and Immunofluorescence Staining
Renal tissues were fixed in 4% paraformaldehyde, embedded in paraffin, and sectioned to 4μm thickness. HE staining was done using histological staining, whereas Masson staining was used to assess collagen deposition and fibrosis. Tissue slices were deparaffinized, rehydrated, and antigen retrieved. Sections were blocked and treated with primary antibodies overnight at 4°C, followed by fluorescent secondary antibodies and DAPI counterstaining for imaging. The antibodies utilized in this study included: α-SMA (1:50, sc-53142, Santa Cruz), DOCK2 (1:50, A3595, Abclonal), AGR2 (1:50, A12411, A7064, Abclonal), Anti-mouse IgG (H+L), F(ab′)2 Fragment (Alexa Fluor® 594 Conjugate) (1:200, 8890S, CST), Anti-rabbit IgG (H+L), F(ab′)2 Fragment (Alexa Fluor® 488 Conjugate) (1:200, 4412S, CST).
Western Blot
Protein was extracted from kidney tissue using RIPA lysis buffer, and its concentration was measured using the BCA assay. Protein samples were electrophoresed using 10% or 15% SDS-PAGE gels and subsequently transferred onto a PVDF membrane. The membrane was blocked with 5% non-fat milk at room temperature for 2 hours, then incubated with the primary antibody at 4°C overnight. The dilution ratios of all antibodies are listed below: Fibronectin (1:1000, A16678, Abclonal), α-SMA (1:500, ab124964, Abcam), DOCK2 (1:500, A3595, Abclonal; 1:1000, PA5960, Abmart), AGR2 (1:1000, A12411, A7064, Abclonal). After thorough washing, the membrane was incubated with HRP-conjugated secondary antibody at room temperature for 2 hours. Finally, the membranes were quantitatively analyzed with Image J software.
Statistical Analysis
Data are presented as mean ± SEM. Statistical analyses were performed using GraphPad Prism 8.0 software, with between-group comparisons assessed by Student’s t-test (for two groups) or one-way ANOVA (for multiple groups). A P-value < 0.05 was considered statistically significant.
Results
Differential Expression Gene Analysis
To identify and validate key biomarkers for kidney fibrosis (see the overall analytical workflow in Supplemental Figure 1), we collected datasets from the GEO database, where GSE22459 and GSE76882 were sequenced on the Affymetrix platform, while GSE135327 was sequenced on the Illumina platform. To maximize data mining and avoid bias, we performed differential analysis separately for datasets from the Affymetrix and Illumina platforms. First, we merged the GSE22459 and GSE76882 datasets and applied the Combat algorithm to remove batch effects. PCA analysis demonstrated that the batch effects between the two datasets had been successfully eliminated (Figure 1A and B). Next, we conducted differential expression analysis on the merged dataset and identified 297 DEGs based on the criteria of an absolute logFC >1 and an adjusted p-value < 0.05, including 233 upregulated and 64 downregulated genes. A volcano plot illustrates the p-values and logFC values of these genes (Figure 1C), at the same time, the heatmap displays the distinct expression patterns of these DEGs between kidney fibrosis samples and control samples (Figure 1D). GO and KEGG enrichment analyses revealed that these DEGs were predominantly associated with immune and inflammatory processes, showing significant enrichment in pathways related to immune cell activation, chemokine signaling, and cytokine-receptor interactions (Figure 2A and B). This pervasive immune signature strongly suggests that dysregulation of the immune microenvironment is a fundamental driver of renal fibrosis. In the GSE135327 dataset, we identified 5011 DEGs (894 upregulated and 4117 downregulated). Similarly, the heatmap reveals significant expression differences between kidney fibrosis samples and control samples (Figure 3A), and the volcano plot shows these genes (Figure 3B). Significantly, compared with the Combat dataset (the merged GSE22459 and GSE76882 datasets), 136 overlapping DEGs were identified (128 upregulated and 8 downregulated) (Figure 3C and D). The convergence of these dysregulated genes across two distinct sequencing platforms highlights a robust and central transcriptional signature in renal fibrosis.
 |
Figure 1 Removal of batch effects and differential analysis in the Combat dataset (Including 175 renal fibrosis samples and 124 healthy control samples): PCA plots before (A) and after (B) batch effect removal, and a volcano plot (C) and heatmap (D) illustrating differentially expressed genes. An Adjust p-value < 0.05 was considered statistically significant. |
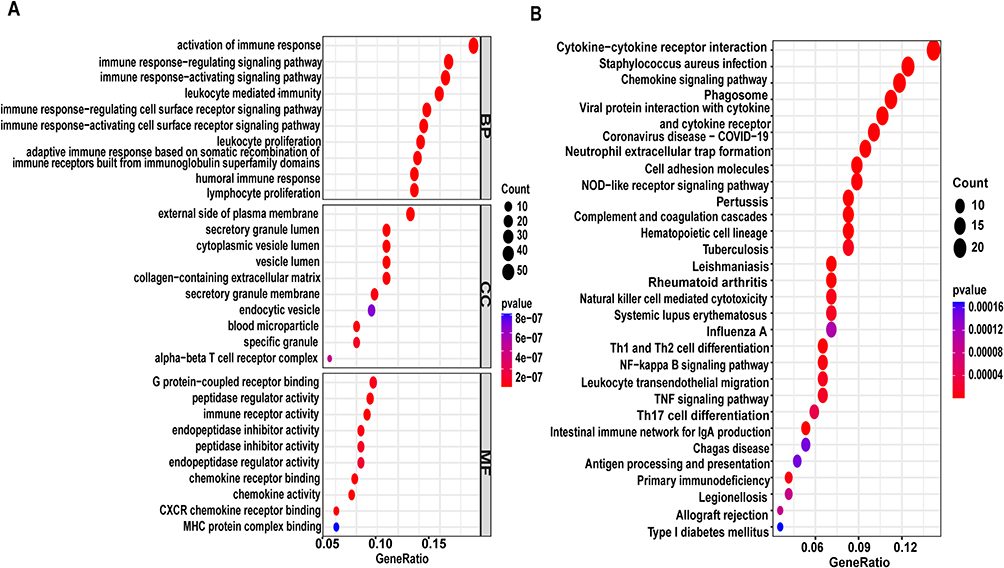 |
Figure 2 Enrichment analysis of DEGs in the Combat datase (Including 175 renal fibrosis samples and 124 healthy control samplest): (A) Bubble chart of GO enrichment analysis (B) Bubble chart of KEGG enrichment analysis. |
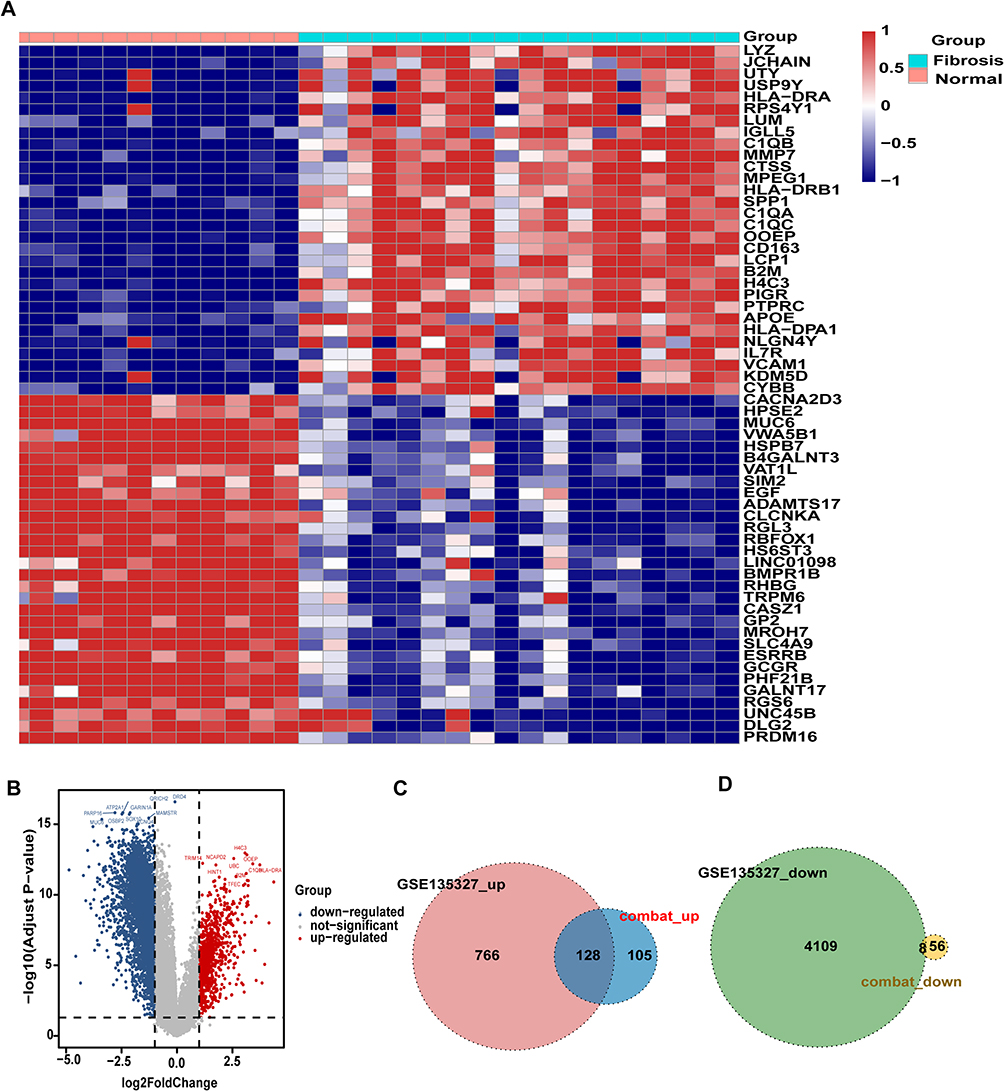 |
Figure 3 Differential analysis of the GSE135327 dataset (Including 18 renal fibrosis samples and 12 healthy control samples): (A) Heatmap and (B) volcano plot showing DEGs; (C) downregulated and (D) upregulated overlapping genes between DEGs in the GSE135327 and Combat datasets. An Adjust p-value < 0.05 was considered statistically significant. |
Screening Key DEGs Using the LASSO Algorithm
The LASSO algorithm was applied to further screen the overlapping DEGs, identifying 26 significant genes (predictive genes) (Figure 4A and B). A protein-protein interaction network revealed these genes form a highly interconnected subnetwork. Functional analysis indicated that this subnetwork is enriched for key immune cell activities, most notably phagocytosis, granule-mediated secretion, and leukocyte proliferation (Figure 4C). Box plots confirmed that all 26 predictive genes were differentially expressed between kidney fibrosis and control samples in both independent datasets (Figure 4D and E, p < 0.001). Taken together, our analysis identified a tightly co-expressed set of 26 genes from the broader fibrosis transcriptome. These genes set represents a core driver and key mediator of pathology in renal fibrosis.
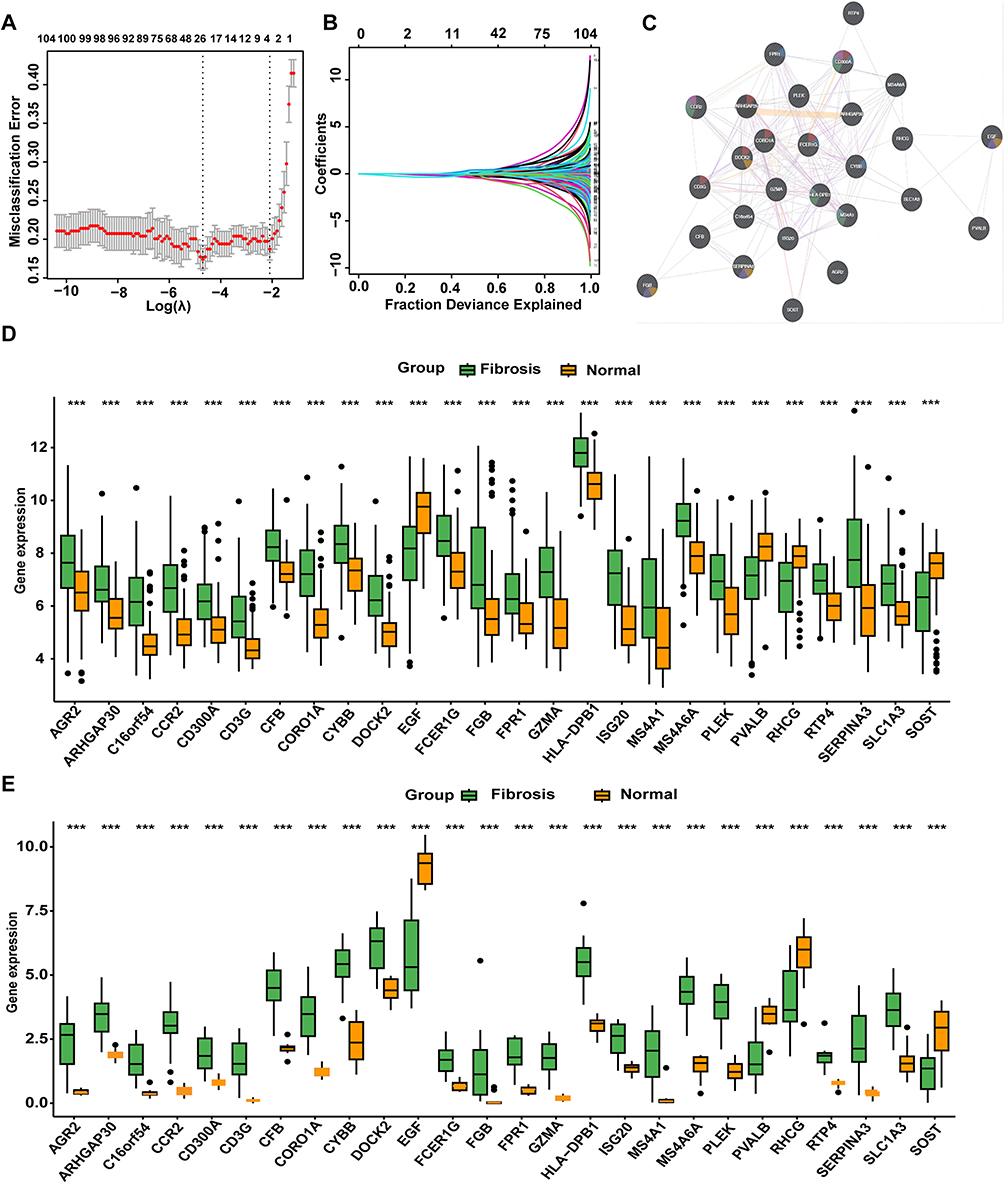 |
Figure 4 Identification of key DEGs using the LASSO algorithm: (A and B) Selection process of the LASSO algorithm; (C) PPI network of predictive genes ; (D)Expression levels of predictive genes in the Combat dataset ; (E)Expression levels of predictive genes in the GSE135327 dataset. Statistical significance: *** p < 0.001. |
Immune Characteristics in the Samples
We performed deconvolution analysis on the Combat dataset to assess the infiltration levels of 22 immune cell types by using the CIBERSORT algorithm. The results revealed that memory B cells, naive CD4(+) T cells, activated memory CD4(+) T cells, resting NK cells, activated dendritic cells, and resting mast cells were present at consistently low levels in both sample groups. In contrast, plasma cells, M1 macrophages, and gamma delta T cells exhibited significantly higher infiltration levels in kidney fibrosis samples compared to control samples. Conversely, resting memory CD4(+) T cells, activated NK cells, monocytes, M0 macrophages, and resting mast cells were less abundant in kidney fibrosis samples than in controls (Figure 5A). To investigate the relationship between predictive genes and immune cells, a correlation analysis was performed. The results revealed that all predictive genes exhibited strong correlations with immune cell infiltration. Specifically, gamma delta T cells, M1 macrophages, activated memory CD(4+) T cells, follicular helper T cells, eosinophils, and neutrophils exhibited significant positive correlations with the most of predictive genes. In contrast, activated NK cells, resting mast cells, resting NK cells, monocytes, resting memory CD4(+) T cells, and regulatory T cells (Tregs) demonstrated significant negative correlations with the majority of predictive genes (Figure 5B). Together, these results highlight that M1 macrophages and gamma delta T cells are the immune subsets most relevant to fibrosis progression, as they are not only significantly enriched in fibrotic kidneys but also show the strongest positive correlations with the predictive fibrosis-related genes.
 |
Figure 5 Immune characteristics of samples in the Combat dataset: (A) Comparison of the abundance of 22 immune cell types between kidney fibrosis and control samples; (B) Heatmap illustrating the correlations between predictive genes and the 22 immune cell types. Statistical significance: * p < 0.05, ** p < 0.01, *** p < 0.001. |
Kidney Fibrosis Classification Models
Previous findings confirmed that the predictive genes play a critical role in kidney fibrosis and are strongly associated with immune processes. To facilitate the translation of these findings into clinical research, the Combat dataset was randomly divided into a training set and a validation set at a 7:3 ratio. Based on the predictive genes, two classification models were developed to distinguish kidney fibrosis samples from control samples. Notably, the DNN model achieved a classification accuracy of 92% on the validation set (Figure 6A), while the XGBoost model demonstrated an even higher accuracy of 96% (Figure 6B). Furthermore, other performance metrics of both models were highly satisfactory (Table 1), demonstrating the robust diagnostic potential of the 26-gene signature. To investigate the contribution of predictive genes to the performance of the two machine learning models, SHAP values were employed to enhance model interpretability and indirectly evaluate the importance of each predictive gene. The SHAP summary plots visualize the impact of individual predictive genes on the outputs of the DNN model (Figure 6C) and the XGBoost model (Figure 6D), respectively. Through integrative analysis of the DEGs identified by both classification models and existing literature evidence, DOCK2 and AGR2 were selected for further experimental validation, representing the translation of our computational findings into functional validation.
 |
Table 1 Performance Metrics of the DNN and XGBoost Models |
 |
Figure 6 Kidney fibrosis classification models: ROC curves for the DNN model (A) and XGBoost model (B); SHAP summary plots for the DNN model (C) and XGBoost model (D). |
Expression of Hub Biomarkers in Rat Renal Fibroblast Cells
TGF-β can induce the activation of fibroblasts into myofibroblasts, which are characterized by the expression of α-SMA and the production of abundant ECM.24,25 To investigate the expression of hub biomarkers during fibroblast activation, the NRK-49F cells were treated with different concentrations of TGF-β. The double immunofluorescence staining revealed co-localization of AGR2 and the myofibroblast marker α-SMA, indicating that AGR2 is closely associated with fibroblast activation (Figure 7A). Unfortunately, the co-localization of DOCK2 with α-SMA could not be assessed due to the unavailability of a suitable antibody for immunofluorescence. The Western blot showed an increased expression of AGR2, DOCK2, Fibronectin and Collagen Ι in a concentration-dependent manner (Figure 7B). This result provides direct evidence that both AGR2 and DOCK2 are upregulated during the critical transition of fibroblasts to myofibroblasts.
 |
Figure 7 Effects of TGF-β on the expression of AGR2 and fibrosis markers in NRK-49F cells (A) Immunofluorescence staining of AGR2 (green) and α-SMA (red) in NRK-49F cells with or without TGF-β1 treatment. (Magnification: 200×. Scale bar: 100 µM, n=5) (B) Western blot analysis of fibrosis markers and AGR2 expression in NRK-49F cells under different concentrations of TGF-β treatment. The data are presented as the mean±SEM, n=5 **P<0.01, *P<0.05 vs TGF-β (0ng/mL). |
Expression of Hub Biomarkers in a Murine Model of Renal Fibrosis
To determine whether hub biomarkers are induced in renal fibrosis, we established the UUO model, a widely utilized experimental model for renal fibrosis research.26 HE staining demonstrated that the renal structure of UUO model mice exhibited tubular atrophy and interstitial widening. Similarly, Masson staining revealed a significant accumulation of blue collagen fibers in the renal interstitium of UUO model mice, confirming the presence of fibrosis (Figure 8A). To determine whether hub biomarkers activation occurs in renal myofibroblasts, we performed dual immunofluorescence staining to assess the co-expression of AGR2 and DOCK2 with α-SMA (a marker of myofibroblasts). The results demonstrated that DOCK2 (Figure 8B) showed limited colocalization with α-SMA positive regions, whereas AGR2 (Figure 8C) exhibited strong colocalization. Furthermore, the Western blot analysis demonstrated that the expression of DOCK2 and AGR2 was significantly upregulated in UUO model mice (Figure 8D). Hence, our experimental results confirmed that AGR2 and DOCK2 are upregulated in renal fibrosis. Significantly, the strong co-localization of AGR2 with α-SMA+ myofibroblasts suggests a direct role in these fibrogenic effector cells. In contrast, the limited co-localization of DOCK2 implies that its pro-fibrotic function may involve a more complex or indirect mechanism. This disparity prompted us to directly test their functional necessity.
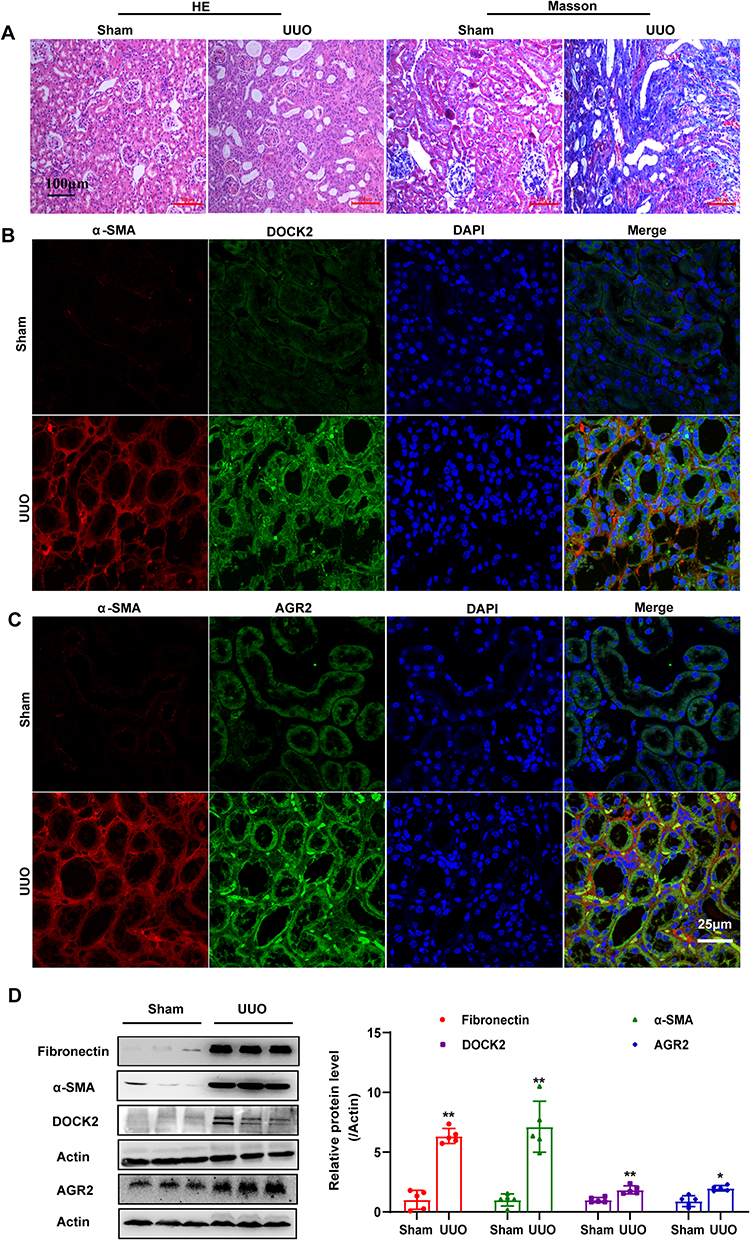 |
Figure 8 Expression of Hub Biomarkers in the Mouse UUO Model. (A) Representative micrographs of HE saining and Masson’s trichrome staining in sham and UUO group. Magnification:200×. Scale bar: 100 µM, n=5. (B and C) Representative micrographs of immunofluorescence of hub biomarkers and α-SMA in sham and UUO group. Magnification: 600×. Scale bar: 25 µM, n=5. (D) Western blot analysis of hub biomarkers and fibrosis markers expression in sham and UUO group. The data are presented as the mean±SEM, n=5 **P<0.01, *P<0.05 vs Sham group. |
Functional Validation of AGR2 and DOCK2 in Fibroblast Activation
To further investigate the functional roles of AGR2 and DOCK2 in renal fibrosis, we performed rescue experiments in NRK-49F cells. Following transfection with AGR2 or DOCK2 specific siRNAs and subsequent TGF-β stimulation, we assessed myofibroblast differentiation and extracellular matrix production. Immunofluorescence staining revealed a marked reduction in the expression level of α-SMA upon knockdown of either gene compared to control cells (Figure 9A). Consistently, Western blot analysis confirmed that the TGF-β induced protein expression of Fibronectin and Collagen I was significantly attenuated following AGR2 or DOCK2 knockdown (Figure 9B). These data demonstrate that both AGR2 and DOCK2 are functionally essential for driving key pro-fibrotic responses in renal fibroblasts.
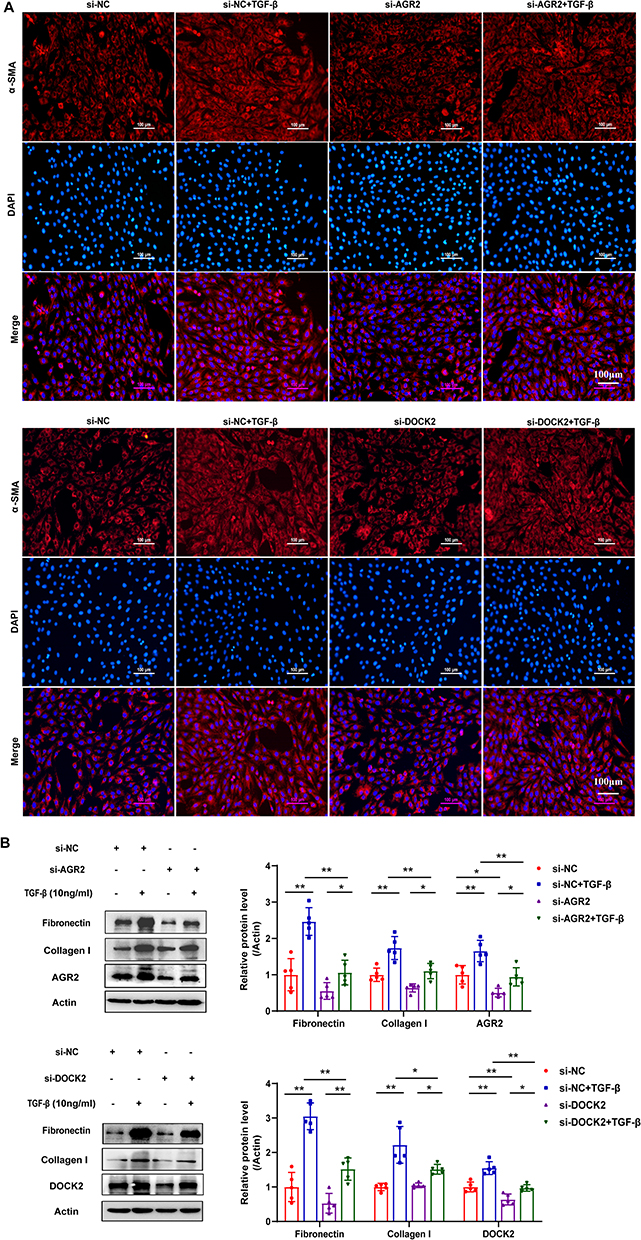 |
Figure 9 Functional validation of AGR2 and DOCK2 in renal fibroblast activation. (A) Immunofluorescence staining of α-SMA in NRK-49F cells following gene knockdown and TGF-β treatment. Magnification: 200×. Scale bar: 100 µM, n=5. (B) Western blot analysis of Fibronectin and Collagen I expression in NRK-49F cells following gene knockdown and TGF-β treatment. The data are presented as the mean±SEM, n=5 **P<0.01, *P<0.05 vs Control group. |
Screening Potential Therapeutic Drugs
To identify potential therapeutic drugs for kidney fibrosis, drug-gene association datasets were retrieved from the DsigDB database, and a drug enrichment analysis was performed (Supplemental Table 2). This analysis identified drugs significantly associated with the predictive genes. Furthermore, an extensive literature review revealed that two predictive genes, AGR2 and DOCK2, play critical roles in the progression of fibrosis.27,28 However, the drug enrichment analysis did not identify any drugs associated with DOCK2, whereas AGR2 was linked to four drugs: Dexamethasone, Dobutamine, Ciclosporin, and Fenoterol. To computationally evaluate their potential binding interactions with the target protein, molecular docking simulations were conducted for these drugs against AGR2. The computational predictions revealed that Dexamethasone formed five hydrogen bonds with the amino acid residues of the AGR2 protein, with bond lengths of 2.0 Å, 2.1 Å, 2.7 Å, 2.8 Å, and 3.1 Å, and a predicted binding energy of −9.3 kcal/mol (Figure 10). Dobutamine established two hydrogen bonds with AGR2 protein residues, both with bond lengths of 2.5 Å, and a predicted binding energy of −7.1 kcal/mol. Fenoterol formed two hydrogen bonds with AGR2 protein residues, with bond lengths of 2.2 Å and 2.3 Å, and a predicted binding energy of −7.9 kcal/mol. Ciclosporin formed a single hydrogen bond with AGR2 protein residues, with a bond length of 2.5 Å and a predicted binding energy of −8.1 kcal/mol. These findings suggest that AGR2 exhibits strong binding affinity for these four drugs. Of particular interest is the high-affinity binding of Dexamethasone and Ciclosporin, as it suggests AGR2 could be a novel intracellular target mediating the anti-fibrotic effects of these clinically relevant compounds.
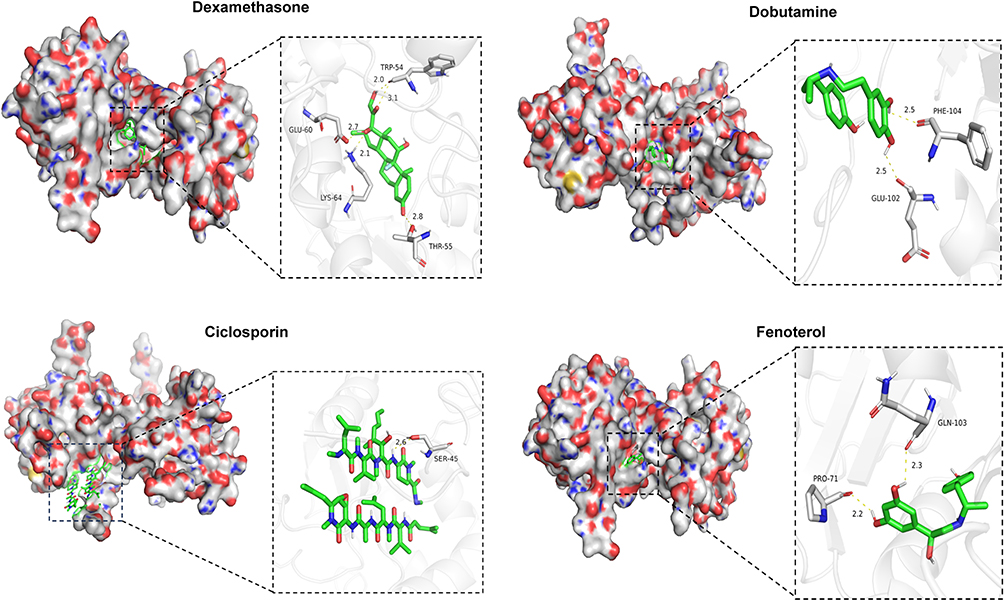 |
Figure 10 Visualization of the optimal molecular docking models. |
Discussion
Renal fibrosis lesions are unevenly distributed within the renal parenchyma, and this “patchy distribution” characteristic poses significant limitations for renal biopsy as a diagnostic tool.8 This highlights the urgent need for specific and sensitive biomarkers to improve the diagnosis and management of renal fibrosis. In this study, we utilized advanced bioinformatics and machine learning approaches to identify key biomarkers associated with renal fibrosis. By integrating transcriptomic datasets and applying interpretable machine learning models (with SHAP analysis), we identified two hub genes, AGR2 and DOCK2, that demonstrated strong associations with renal fibrosis and were validated through in vitro and in vivo experiments. Additionally, through computational molecular docking screening, four small-molecule compounds were identified as potential therapeutic agents for renal fibrosis, based on their predicted ability to bind AGR2 and downregulate its expression. Our study uniquely combines the discovery of a biomarker signature with model interpretability, providing not only predictive power but also mechanistic insights into renal fibrosis.
In contrast to prior studies that identified targets from overlapping DEGs in limited datasets,29–31 our study integrated the Combat dataset (GSE22459 and GSE7682) with GSE135327, which enhances the robustness of the identified overlapping DEGs. Critically, the application of interpretable machine learning and SHAP value analysis allowed us to move beyond simple association; it quantified the specific contribution of AGR2 and DOCK2 to the model’s diagnostic decision, thereby establishing them as high-confidence, explainable drivers of disease.
DOCK2, which is a member of the DOCK-A subfamily, is an atypical activator of Rac and is expressed highly in lymphocytes and macrophages.32,33 Growing evidence suggests it drives fibrosis in lung and liver by promoting mesenchymal transitions and myofibroblasts activation.27,34–36 Our study extends this paradigm to renal fibrosis. We first found that DOCK2 is robustly upregulated in vivo UUO model and in TGF-β stimulated renal fibroblasts. Despite its clear upregulation and essential pro-fibrotic function, dual immunofluorescence in UUO kidneys revealed only limited co-localization of DOCK2 with α-SMA+ myofibroblasts. These results suggested that DOCK2 may not predominantly exert its pro-fibrotic effect from within the differentiated myofibroblasts themselves. In addition to its potential role in fibroblast activation, DOCK2 likely drives renal fibrosis by modulating the pro-fibrotic immune microenvironment.37 It is a key regulator of diverse immune processes, including lymphocyte activation,38–41 macrophage polarization,42 adhesion molecule secretion,43,44 plasma cell differentiation45 and NK cell cytotoxicity.46,47 Notably, its role in driving pro-inflammatory M1 macrophage polarization is strongly implicated in fibrosis.36,42 Our bioinformatics analyses (GO/KEGG, PPI, CIBERSORT) consistently highlighted this immune-regulatory function, particularly in macrophage and CD4+ T cell activation. Therefore, DOCK2 may exacerbate fibrosis through its known role in promoting pro-inflammatory M1 macrophage polarization. This could foster an injurious microenvironment that sustains myofibroblast activation-a process potentially amplified by mechanisms such as macrophage-to-myofibroblast transition (MMT).48,49
AGR2, a member of the protein disulfide isomerase family, is an ER resident protein critical for mitigating ER stress.50,51 Chronic ER stress is a well-documented driver of fibrotic pathologies.52–58 Within this context, AGR2 has been implicated in promoting myofibroblast activation and enhancing migratory capacity.28,59 To define its role in renal fibrosis, we first demonstrated that AGR2 is significantly upregulated in TGF-β induced fibroblasts and the UUO model, with prominent co-localization with α-SMA, further supporting its involvement in myofibroblast differentiation during renal fibrosis. Critically, siRNA-mediated knockdown of AGR2 potently suppressed the TGF-β induced expression of key fibrotic markers, confirming that AGR2 plays a causal role in mediating the fibrotic cascade. This functional indispensability establishes AGR2 as an active driver of the fibrotic process. We propose that AGR2 induction alleviates the ER stress caused by excessive matrix synthesis, thereby enabling the sustained activation and survival of fibroblasts. In addition to the role in promoting fibroblast activation, AGR2 may also exacerbate renal fibrosis through modulation of the inflammatory microenvironment. This notion is supported not only by its documented association with cytokine signaling and immune regulation in other contexts,50,60,61 but also by our bioinformatics analyses, which indicated an association between AGR2 and immune-regulatory processes. Based on these findings, we hypothesize that AGR2 contributes to renal fibrosis via a dual mechanism: directly by mitigating ER stress to sustain myofibroblast activation; and indirectly by regulating inflammatory crosstalk among fibroblasts, immune cells, and tubular epithelial cells to promote a pro-fibrotic niche.
However, this study has several limitations. First, the analysis relies on public transcriptomic datasets, which are constrained by relatively small sample sizes and static sampling, limiting their ability to fully capture disease heterogeneity and dynamic gene expression changes during fibrosis progression. Second, while our bioinformatics-based approach identified promising AGR2-binding compounds, it did not yield candidates for DOCK2. Most critically, regarding the drug discovery aspect, the molecular docking results are preliminary computational predictions. Their therapeutic potential requires validation through subsequent in vitro and in vivo pharmacological studies. In parallel, molecular dynamics simulations could be employed as a supplementary approach to optimize the preliminary computational predictions.
In addition to these methodological limitations, further clinical translation faces two challenges: the need for external validation to overcome dataset heterogeneity, and the requirement to connect biomarker levels with patient outcomes. Therefore, future work should employ single-cell sequencing to define the cellular roles of AGR2/DOCK2, and rigorously validate these biomarkers in independent patient groups to establish their reliability and clinical relevance.
Conclusion
This study establishes an interpretable machine-learning framework that identifies and validates AGR2 and DOCK2 as central drivers of renal fibrosis. Beyond being functionally essential, their distinct localization within fibrotic kidneys suggests different pro-fibrotic mechanisms. The high diagnostic accuracy of models based on these biomarkers underscores their clinical potential. Furthermore, the computational identification of AGR2-targeting compounds offers a novel therapeutic hypothesis. Our work demonstrates that integrating explainable AI with experimental validation can uncover not only biomarkers but also mechanistic insights and therapeutic leads for renal fibrosis.
Data Sharing Statement
Data are available from the corresponding author upon reasonable request.
Ethics Approval
All animal experiments were conducted in accordance with the guidelines established by the Institutional Animal Care and Ethics Committee and were approved by the Ethics Committee of Fenyang College, Shanxi Medical University (No. 2024065). This bioinformatics study analyzed publicly available, anonymized data. Ethical review and patient consent were handled by the original data sources. In accordance with China’s “Measures for Ethical Review of Life Science and Medical Research Involving Human Subjects” (2023, Article 32, Items 1 and 2), no additional IRB approval was required for this work.
Author Contributions
All authors made a significant contribution to the work reported, whether that is in the conception, study design, execution, acquisition of data, analysis and interpretation, or in all these areas; took part in drafting, revising or critically reviewing the article; gave final approval of the version to be published; have agreed on the journal to which the article has been submitted; and agree to be accountable for all aspects of the work.
Funding
This study was supported by: (1) Natural Science Foundation of LVliang Science Bureau (No.2024SHFZ38); (2) Shanxi Province College Student Innovation and Entrepreneurship Training Program Project (No. 20241011401002); (3) Key Discipline of Biochemistry and Molecular Biology, Fenyang College of Shanxi Medical University.
Disclosure
The authors declare no competing interests.
References
1. Chen TK, Knicely DH, Grams ME. Chronic kidney disease diagnosis and management: a review. JAMA. 2019;322(13):1294–18. doi:10.1001/jama.2019.14745
2. Glassock RJ, Warnock DG, Delanaye P. The global burden of chronic kidney disease: estimates, variability and pitfalls. Nat Rev Nephrol. 2017;13(2):104–114. doi:10.1038/nrneph.2016.163
3. Huang R, Fu P, Ma L. Kidney fibrosis: from mechanisms to therapeutic medicines. Signal Transduct Target Ther. 2023;8(1):129. doi:10.1038/s41392-023-01379-7
4. Nastase MV, Zeng-Brouwers J, Wygrecka M, et al. Targeting renal fibrosis: mechanisms and drug delivery systems. Adv Drug Deliv Rev. 2018;129:295–307. doi:10.1016/j.addr.2017.12.019
5. LeBleu VS, Taduri G, O’Connell J, et al. Origin and function of myofibroblasts in kidney fibrosis. Nat Med. 2013;19(8):1047–1053. doi:10.1038/nm.3218
6. Mack M, Yanagita M. Origin of myofibroblasts and cellular events triggering fibrosis. Kidney Int. 2015;87(2):297–307. doi:10.1038/ki.2014.287
7. Hogan JJ, Mocanu M, Berns JS. The native kidney biopsy: update and evidence for best practice. Clin J Am Soc Nephrol. 2016;11(2):354–362. doi:10.2215/CJN.05750515
8. Dhaun N, Bellamy CO, Cattran DC, et al. Utility of renal biopsy in the clinical management of renal disease. Kidney Int. 2014;85(5):1039–1048. doi:10.1038/ki.2013.512
9. Poggio ED, McClelland RL, Blank KN, et al. Systematic review and meta-analysis of native kidney biopsy complications. Clin J Am Soc Nephrol. 2020;15(11):1595–1602. doi:10.2215/CJN.04710420
10. Menn-Josephy H, Lee CS, Nolin A, et al. Renal interstitial fibrosis: an imperfect predictor of kidney disease progression in some patient cohorts. Am J Nephrol. 2016;44(4):289–299. doi:10.1159/000449511
11. Berchtold L, Friedli I, Vallee JP, et al. Diagnosis and assessment of renal fibrosis: the state of the art. Swiss Med Wkly. 2017;147(1920):w14442. doi:10.4414/smw.2017.14442
12. Bai F, Han L, Yang J, et al. Integrated analysis reveals crosstalk between pyroptosis and immune regulation in renal fibrosis. Front Immunol. 2024;15:1247382. doi:10.3389/fimmu.2024.1247382
13. O’Sullivan ED, Mylonas KJ, Bell R, et al. Single-cell analysis of senescent epithelia reveals targetable mechanisms promoting fibrosis. JCI Insight. 2022;7(22):e154124. doi:10.1172/jci.insight.154124
14. Handelman GS, Kok HK, Chandra RV, et al. eDoctor: machine learning and the future of medicine. J Intern Med. 2018;284(6):603–619. doi:10.1111/joim.12822
15. Feng C, Wang Z, Liu C, et al. Integrated bioinformatical analysis, machine learning and in vitro experiment-identified m6A subtype, and predictive drug target signatures for diagnosing renal fibrosis. Front Pharmacol. 2022;13:909784. doi:10.3389/fphar.2022.909784
16. Chang D, Truong E, Mena EA, et al. Machine learning models are superior to noninvasive tests in identifying clinically significant stages of NAFLD and NAFLD-related cirrhosis. Hepatology. 2023;77(2):546–557. doi:10.1002/hep.32655
17. Cabitza F, Rasoini R, Gensini GF. Unintended consequences of machine learning in medicine. JAMA. 2017;318(6):517–518. doi:10.1001/jama.2017.7797
18. Petch J, Di S, Nelson W. Opening the black box: the promise and limitations of explainable machine learning in cardiology. Can J Cardiol. 2022;38(2):204–213. doi:10.1016/j.cjca.2021.09.004
19. Wang K, Tian J, Zheng C, et al. Interpretable prediction of 3-year all-cause mortality in patients with heart failure caused by coronary heart disease based on machine learning and SHAP. Comput Biol Med. 2021;137:104813. doi:10.1016/j.compbiomed.2021.104813
20. Ritchie ME, Phipson B, Wu D, et al. limma powers differential expression analyses for RNA-sequencing and microarray studies. Nucleic Acids Res. 2015;43(7):e47. doi:10.1093/nar/gkv007
21. Yu G, Wang LG, Han Y, et al. clusterProfiler: an R package for comparing biological themes among gene clusters. OMICS. 2012;16(5):284–287. doi:10.1089/omi.2011.0118
22. Engebretsen S, Bohlin J. Statistical predictions with glmnet. Clin Epigenet. 2019;11(1):123. doi:10.1186/s13148-019-0730-1
23. Yoo M, Shin J, Kim J, et al. DSigDB: drug signatures database for gene set analysis. Bioinformatics. 2015;31(18):3069–3071. doi:10.1093/bioinformatics/btv313
24. Leask A, Abraham DJ. TGF-beta signaling and the fibrotic response. FASEB J. 2004;18(7):816–827. doi:10.1096/fj.03-1273rev
25. Sun YB, Qu X, Caruana G, et al. The origin of renal fibroblasts/myofibroblasts and the signals that trigger fibrosis. Differentiation. 2016;92(3):102–107. doi:10.1016/j.diff.2016.05.008
26. Martinez-Klimova E, Aparicio-Trejo OE, Tapia E, et al. Unilateral ureteral obstruction as a model to investigate fibrosis-attenuating treatments. Biomolecules. 2019;9(4):141. doi:10.3390/biom9040141
27. Qian G, Adeyanju O, Roy S, et al. DOCK2 promotes pleural fibrosis by modulating mesothelial to mesenchymal transition. Am J Respir Cell Mol Biol. 2022;66(2):171–182. doi:10.1165/rcmb.2021-0175OC
28. Vieujean S, Hu S, Bequet E, et al. Potential role of epithelial endoplasmic reticulum stress and anterior gradient protein 2 homologue in crohn’s disease fibrosis. J Crohns Colitis. 2021;15(10):1737–1750. doi:10.1093/ecco-jcc/jjab061
29. Kwon S, Cheon S, Kim KH, et al. Unveiling the role of transgelin as a prognostic and therapeutic target in kidney fibrosis via a proteomic approach. Exp Mol Med. 2024;56(10):2296–2308. doi:10.1038/s12276-024-01319-7
30. Guo Y, Yuan Z, Hu Z, et al. Diagnostic model constructed by five EMT-related genes for renal fibrosis and reflecting the condition of immune-related cells. Front Immunol. 2023;14:1161436. doi:10.3389/fimmu.2023.1161436
31. Sun YC, Qiu ZZ, Wen FL, et al. Revealing potential diagnostic gene biomarkers associated with immune infiltration in patients with renal fibrosis based on machine learning analysis. J Immunol Res. 2022;2022:3027200. doi:10.1155/2022/3027200
32. Guo X, Chen SY. Dedicator of cytokinesis 2 in cell signaling regulation and disease development. J Cell Physiol. 2017;232(8):1931–1940. doi:10.1002/jcp.25512
33. Ji L, Xu S, Luo H, et al. Insights from DOCK2 in cell function and pathophysiology. Front Mol Biosci. 2022;9:997659. doi:10.3389/fmolb.2022.997659
34. Shi N, Zhang J, Chen SY. DOCK2 promotes asthma development by eliciting airway epithelial-mesenchymal transition. Am J Respir Cell Mol Biol. 2023;69(3):310–320. doi:10.1165/rcmb.2022-0273OC
35. Guo X, Adeyanju O, Sunil C, et al. DOCK2 contributes to pulmonary fibrosis by promoting lung fibroblast to myofibroblast transition. Am J Physiol Cell Physiol. 2022;323(1):C133–C144. doi:10.1152/ajpcell.00067.2022
36. Qiu J, Qu Y, Li Y, et al. Inhibition of RAC1 activator DOCK2 ameliorates cholestatic liver injury via regulating macrophage polarisation and hepatic stellate cell activation. Biol Direct. 2025;20(1):21. doi:10.1186/s13062-025-00612-3
37. Li L, Fu H, Liu Y. The fibrogenic niche in kidney fibrosis: components and mechanisms. Nat Rev Nephrol. 2022;18(9):545–557. doi:10.1038/s41581-022-00590-z
38. Nishikimi A, Uruno T, Duan X, et al. Blockade of inflammatory responses by a small-molecule inhibitor of the Rac activator DOCK2. Chem Biol. 2012;19(4):488–497. doi:10.1016/j.chembiol.2012.03.008
39. Sanui T, Inayoshi A, Noda M, et al. DOCK2 is essential for antigen-induced translocation of TCR and lipid rafts, but not PKC-theta and LFA-1, in T cells. Immunity. 2003;19(1):119–129. doi:10.1016/S1074-7613(03)00169-9
40. Nombela-Arrieta C, Lacalle RA, Montoya MC, et al. Differential requirements for DOCK2 and phosphoinositide-3-kinase gamma during T and B lymphocyte homing. Immunity. 2004;21(3):429–441. doi:10.1016/j.immuni.2004.07.012
41. Jiang H, Pan F, Erickson LM, et al. Deletion of DOCK2, a regulator of the actin cytoskeleton in lymphocytes, suppresses cardiac allograft rejection. J Exp Med. 2005;202(8):1121–1130. doi:10.1084/jem.20050911
42. Xu X, Su Y, Wu K, et al. DOCK2 contributes to endotoxemia-induced acute lung injury in mice by activating proinflammatory macrophages. Biochem Pharmacol. 2021;184:114399. doi:10.1016/j.bcp.2020.114399
43. Qian G, Adeyanju O, Cai D, et al. DOCK2 promotes atherosclerosis by mediating the endothelial cell inflammatory response. Am J Pathol. 2024;194(4):599–611. doi:10.1016/j.ajpath.2023.09.015
44. Watanabe M, Terasawa M, Miyano K, et al. DOCK2 and DOCK5 act additively in neutrophils to regulate chemotaxis, superoxide production, and extracellular trap formation. J Immunol. 2014;193(11):5660–5667. doi:10.4049/jimmunol.1400885
45. Ushijima M, Uruno T, Nishikimi A, et al. The Rac activator DOCK2 mediates plasma cell differentiation and IgG antibody production. Front Immunol. 2018;9:243. doi:10.3389/fimmu.2018.00243
46. Dobbs K, Dominguez Conde C, Zhang SY, et al. Inherited DOCK2 deficiency in patients with early-onset invasive infections. N Engl J Med. 2015;372(25):2409–2422. doi:10.1056/NEJMoa1413462
47. Sakai Y, Tanaka Y, Yanagihara T, et al. The Rac activator DOCK2 regulates natural killer cell-mediated cytotoxicity in mice through the lytic synapse formation. Blood. 2013;122(3):386–393. doi:10.1182/blood-2012-12-475897
48. Meng XM, Wang S, Huang XR, et al. Inflammatory macrophages can transdifferentiate into myofibroblasts during renal fibrosis. Cell Death Dis. 2016;7(12):e2495. doi:10.1038/cddis.2016.402
49. Tang PM, Nikolic-Paterson DJ, Lan HY. Macrophages: versatile players in renal inflammation and fibrosis. Nat Rev Nephrol. 2019;15(3):144–158. doi:10.1038/s41581-019-0110-2
50. Schroeder BW, Verhaeghe C, Park SW, et al. AGR2 is induced in asthma and promotes allergen-induced mucin overproduction. Am J Respir Cell Mol Biol. 2012;47(2):178–185. doi:10.1165/rcmb.2011-0421OC
51. Higa A, Mulot A, Delom F, et al. Role of pro-oncogenic protein disulfide isomerase (PDI) family member anterior gradient 2 (AGR2) in the control of endoplasmic reticulum homeostasis. J Biol Chem. 2011;286(52):44855–44868. doi:10.1074/jbc.M111.275529
52. Zhang CY, Zhong WJ, Liu YB, et al. EETs alleviate alveolar epithelial cell senescence by inhibiting endoplasmic reticulum stress through the Trim25/Keap1/Nrf2 axis. Redox Biol. 2023;63:102765. doi:10.1016/j.redox.2023.102765
53. Ajoolabady A, Kaplowitz N, Lebeaupin C, et al. Endoplasmic reticulum stress in liver diseases. Hepatology. 2023;77(2):619–639. doi:10.1002/hep.32562
54. Guo S, Tong Y, Li T, et al. Endoplasmic reticulum stress-mediated cell death in renal fibrosis. Biomolecules. 2024;14(8):919. doi:10.3390/biom14080919
55. Martinez-Klimova E, Aparicio-Trejo OE, Gomez-Sierra T, et al. Mitochondrial dysfunction and endoplasmic reticulum stress in the promotion of fibrosis in obstructive nephropathy induced by unilateral ureteral obstruction. Biofactors. 2020;46(5):716–733. doi:10.1002/biof.1673
56. Chen YT, Jhao PY, Hung CT, et al. Endoplasmic reticulum protein TXNDC5 promotes renal fibrosis by enforcing TGF-beta signaling in kidney fibroblasts. J Clin Invest. 2021;131(5):e143645. doi:10.1172/JCI143645
57. Liu Y, Wu X, Wang Y, et al. Endoplasmic reticulum stress and autophagy are involved in adipocyte-induced fibrosis in hepatic stellate cells. Mol Cell Biochem. 2021;476(6):2527–2538. doi:10.1007/s11010-020-03990-6
58. Shan B, Wang X, Wu Y, et al. The metabolic ER stress sensor IRE1alpha suppresses alternative activation of macrophages and impairs energy expenditure in obesity. Nat Immunol. 2017;18(5):519–529. doi:10.1038/ni.3709
59. Zhu Q, Mangukiya HB, Mashausi DS, et al. Anterior gradient 2 is induced in cutaneous wound and promotes wound healing through its adhesion domain. FEBS J. 2017;284(17):2856–2869. doi:10.1111/febs.14155
60. Lai TY, Chiang TC, Lee CY, et al. Unraveling the impact of cancer-associated fibroblasts on hypovascular pancreatic neuroendocrine tumors. Br J Cancer. 2024;130(7):1096–1108. doi:10.1038/s41416-023-02565-8
61. Zhang S, Liu Q, Wei Y, et al. Anterior gradient-2 regulates cell communication by coordinating cytokine-chemokine signaling and immune infiltration in breast cancer. Cancer Sci. 2023;114(6):2238–2253. doi:10.1111/cas.15775
 © 2026 The Author(s). This work is published and licensed by Dove Medical Press Limited. The
full terms of this license are available at https://www.dovepress.com/terms
and incorporate the Creative Commons Attribution
- Non Commercial (unported, 4.0) License.
By accessing the work you hereby accept the Terms. Non-commercial uses of the work are permitted
without any further permission from Dove Medical Press Limited, provided the work is properly
attributed. For permission for commercial use of this work, please see paragraphs 4.2 and 5 of our Terms.
© 2026 The Author(s). This work is published and licensed by Dove Medical Press Limited. The
full terms of this license are available at https://www.dovepress.com/terms
and incorporate the Creative Commons Attribution
- Non Commercial (unported, 4.0) License.
By accessing the work you hereby accept the Terms. Non-commercial uses of the work are permitted
without any further permission from Dove Medical Press Limited, provided the work is properly
attributed. For permission for commercial use of this work, please see paragraphs 4.2 and 5 of our Terms.