Back to Journals » Drug Design, Development and Therapy » Volume 8
Interferon-γ and celecoxib inhibit lung-tumor growth through modulating M2/M1 macrophage ratio in the tumor microenvironment
Authors Ren F, Fan M, Mei J ![]() , Wu Y, Liu C, Pu Q, You Z, Liu L
, Wu Y, Liu C, Pu Q, You Z, Liu L ![]()
Received 18 April 2014
Accepted for publication 16 July 2014
Published 23 September 2014 Volume 2014:8 Pages 1527—1538
DOI https://doi.org/10.2147/DDDT.S66302
Checked for plagiarism Yes
Review by Single anonymous peer review
Peer reviewer comments 5
Fuqiang Ren,1,2,* Mingyu Fan,1,2,* Jiandong Mei,1,2 Yongqiang Wu,3 Chengwu Liu,1,2 Qiang Pu,1,2 Zongbing You,4–9 Lunxu Liu1,2
1Department of Thoracic Surgery, West China Hospital, 2Western China Collaborative Innovation Center for Early Diagnosis and Multidisciplinary Therapy of Lung Cancer, 3Regenerative Medicine Research Center, West China Hospital, Sichuan University, Chengdu, People’s Republic of China; 4Department of Structural and Cellular Biology, 5Department of Orthopaedic Surgery, 6Tulane Cancer Center, 7Louisiana Cancer Research Consortium, 8Tulane Center for Stem Cell Research and Regenerative Medicine, 9Tulane Center for Aging, Tulane University Health Sciences Center, New Orleans, LA, USA
*These two authors contributed equally to this study
Abstract: Tumor-associated macrophages play an important role in tumor growth and progression. These macrophages are heterogeneous with diverse functions, eg, M1 macrophages inhibit tumor growth, whereas M2 macrophages promote tumor growth. In this study, we found that IFNγ and/or celecoxib (cyclooxygenase-2 inhibitor) treatment consistently inhibited tumor growth in a mouse lung cancer model. IFNγ alone and celecoxib alone increased the percentage of M1 macrophages but decreased the percentage of M2 macrophages in the tumors, and thus the M2/M1 macrophage ratio was reduced to 1.1 and 1.7 by IFNγ alone and celecoxib alone, respectively, compared to the M2/M1 macrophage ratio of 4.4 in the control group. A combination of IFNγ and celecoxib treatment reduced the M2/M1 macrophage ratio to 0.8. Furthermore, IFNγ and/or celecoxib treatment decreased expression of matrix metalloproteinase (MMP)-2, MMP-9, and VEGF, as well as the density of microvessels in the tumors, compared to the control group. This study provides the proof of principle that IFNγ and/or celecoxib treatment may inhibit lung-tumor growth through modulating the M2/M1 macrophage ratio in the tumor microenvironment, suggesting that IFNγ and celecoxib have potential to be further optimized into a new anticancer therapy.
Keywords: tumor-associated macrophages, M1 macrophages, M2 macrophages, lung cancer, interferon-γ, celecoxib
Introduction
Globally, lung cancer is the most common cause of cancer-related deaths. Currently, surgical resection is the standard of care for most patients with nonmetastatic non-small-cell lung cancer. Other therapeutic approaches are needed to improve the survival of lung cancer patients. Cancer immunotherapy has reappeared as a powerful weapon against cancer recently,1 since the US Food and Drug Administration approved Provenge® (sipuleucel-T) for the treatment of metastatic castration-resistant prostate cancer and Yervoy® (ipilimumab) for the treatment of metastatic melanoma.2,3 Inhibitors of PD-1, an immunosuppressive checkpoint protein, and its ligand PD-L1 and PD-L2, have shown promising results in the treatment of cancers, including lung cancer, in clinical trials.4 A Phase I clinical trial showed that anti-PD-1 antibody produced objective responses in approximately one in four to one in five patients with non-small-cell lung cancer, melanoma, or renal cell cancer; the adverse-event profile did not appear to preclude its use.5 Another Phase I clinical trial showed that anti-PD-L1 antibody induced objective response rates of 6%–17% and a stabilization of disease at rates of 12%–41% at 24 weeks in patients with advanced cancers, including non-small-cell lung cancer, melanoma, and renal cell cancer.6 Three patients sustained long-term partial or complete response 16 months to 3 years off therapy.7
The tumor microenvironment is critical for lung cancer growth and progression. The tumor microenvironment consists of tumor cells, fibroblasts, endothelial cells, and immune cells (including macrophages, dendritic cells, and lymphocytes), as well as these cells’ products, such as extracellular matrix, cytokines, chemokines, growth factors, enzymes, and cellular metabolites.8 Macrophages influence tumor growth, angiogenesis, invasion, and metastasis through producing growth factors, cytokines, chemokines, and enzymes.9 The tumor-associated macrophages (TAMs) are heterogeneous, with diverse, and even opposite, biological properties, such as the so called M1 (classically activated) and M2 (alternatively activated) macrophages.10 IFNγ, lipopolysaccharides, TNFα, and GM-CSF induce monocytes to differentiate into M1 macrophages that express high levels of inducible nitric oxide synthase (iNOS), TNFα, IL-1β, IL-6, IL-12, IL-18, IL-23, CXCL10, human leukocyte antigen DR, and reactive oxygen and nitrogen intermediates.10–14 IL-4, IL-10, IL-13, IL-21, activin A, immune complexes, and glucocorticoids are able to induce monocyte differentiation into M2 macrophages that express high levels of arginase (ARG)-1, IL-1RA, IL-10, CCL22, mannose receptor, galactose receptor, and CD163 antigen.10,15 M1 macrophages can inhibit tumor growth by producing effector molecules, such as reactive oxygen intermediates, reactive nitrogen intermediates, and TNFα, whereas M2 macrophages promote tumor growth and metastasis by secretion of growth factors, VEGF, matrix metalloproteinases (MMPs), and immunosuppressive cytokines/chemokines.11 The ratio of M1 and M2 macrophages determines the net anti- or protumor effects of the TAM population in the tumor microenvironment.16 However, it is very common that M2 macrophages outnumber M1 macrophages in the tumors, so the TAMs provide a protumor microenvironment to support tumor progression.17
We previously found that about 70% of TAMs are M2 macrophages and the remaining 30% are M1 macrophages in human non-small-cell lung cancer.18 We have demonstrated that cyclooxygenase (COX)-2 is expressed at higher levels in human lung tumors than normal lung tissues, leading to increased prostaglandin E2 (PGE2) in lung tumors, which facilitates M2 macrophage differentiation.19 Given that IFNγ can induce M1 macrophage polarization,20,21 and celecoxib can inhibit COX-2 enzyme activity,22 we hypothesized that IFNγ and celecoxib might have a synergistic effect in reversing the M2/M1 macrophage ratio in the tumor microenvironment by promoting M1 macrophage differentiation and inhibiting M2 macrophage differentiation, thus inhibiting tumor growth. In the present study, we designed an in vivo animal study to test this hypothesis. In addition, because zoledronic acid has been shown to deplete TAMs and inhibit tumor progression in a human liver cancer xenograft model,23 we also tested if zoledronic acid could inhibit lung-tumor growth in a mouse lung cancer model in immunocompetent syngeneic mice. We found that IFNγ alone or celecoxib alone was able to significantly reduce the M2/M1 macrophage ratio in the tumors (P<0.01), and thus significantly inhibited tumor growth (P<0.01). However, although the combination of IFNγ and celecoxib further reduced the M2/M1 macrophage ratio, the combined treatment did not significantly inhibit tumor growth further, compared to the single-agent treatment. Furthermore, zoledronic acid alone did not show any consistent antitumor effects.
Materials and methods
Animal model
The animal study was approved by the Animal Care and Use Committee of West China Hospital, Sichuan University, Chengdu, People’s Republic of China (PRC). The mouse Lewis lung carcinoma (LLC)-1 cell line was obtained from the American Type Culture Collection, Manassas, VA, USA. LLC1 was originally derived from C57BL/6 mouse LLC.24 The cells were cultured in Dulbecco’s modified Eagle’s medium containing 10% fetal bovine serum (HyClone, Logan, UT, USA) and 100 IU/mL penicillin/streptomycin, in a 5% CO2 humidified incubator at 37°C. A total of 115 8-week-old female C57BL/6 mice were purchased from the West China Laboratory Animal Center, Sichuan University, and were housed at this facility in a specific pathogen-free condition. The mice were used in two independent experiments. The first experiment used 75 mice (n=15 mice per group), and the second experiment used 40 mice (n=8 mice per group). In each experiment, 50 μL (containing 1×10⁶ cells) LLC1 cell suspension was mixed with 50 μL of Matrigel® (BD Biosciences, San Jose, CA, USA), which was injected subcutaneously in the left axilla of each mouse, using a 20-gauge needle and 1 cc tuberculin syringe.
Experimental groups and treatment
One day after tumor-cell implantation, each mouse was randomly assigned to the following five groups (n=15 and n=8 per group, in the first and second independent experiments, respectively) and treated accordingly: a) treated with saline as a placebo control group; b) treated with recombinant human IFNγ (Shanghai Chemo Wanbang Biopharm, Shanghai, PRC), at a dose of 10,000 IU in 200 μL saline by intraperitoneal injection once a day for 5 consecutive days, then discontinued for 2 days, and followed by another 5 days (Figure 1A); c) treated with celecoxib (Pfizer China, Shanghai, PRC), at a dose of 60 mg/kg in 200 μL saline, administered by gavage on every other day (Figure 1A); d) treated with a combination of IFNγ and celecoxib at the same dose and schedule described earlier (Figure 1A); and e) treated with zoledronic acid (China National Medicines Guorui Pharmaceutical, Beijing, PRC), at a dose of 0.4 mg/kg in 100 μL saline intraperitoneally twice a week (Figure 1A). Animal body weight was weighed on days 1, 4, 7, 10, and 14. Animals were killed on day 14, when the largest tumors reached about 1.5 cm in diameter.
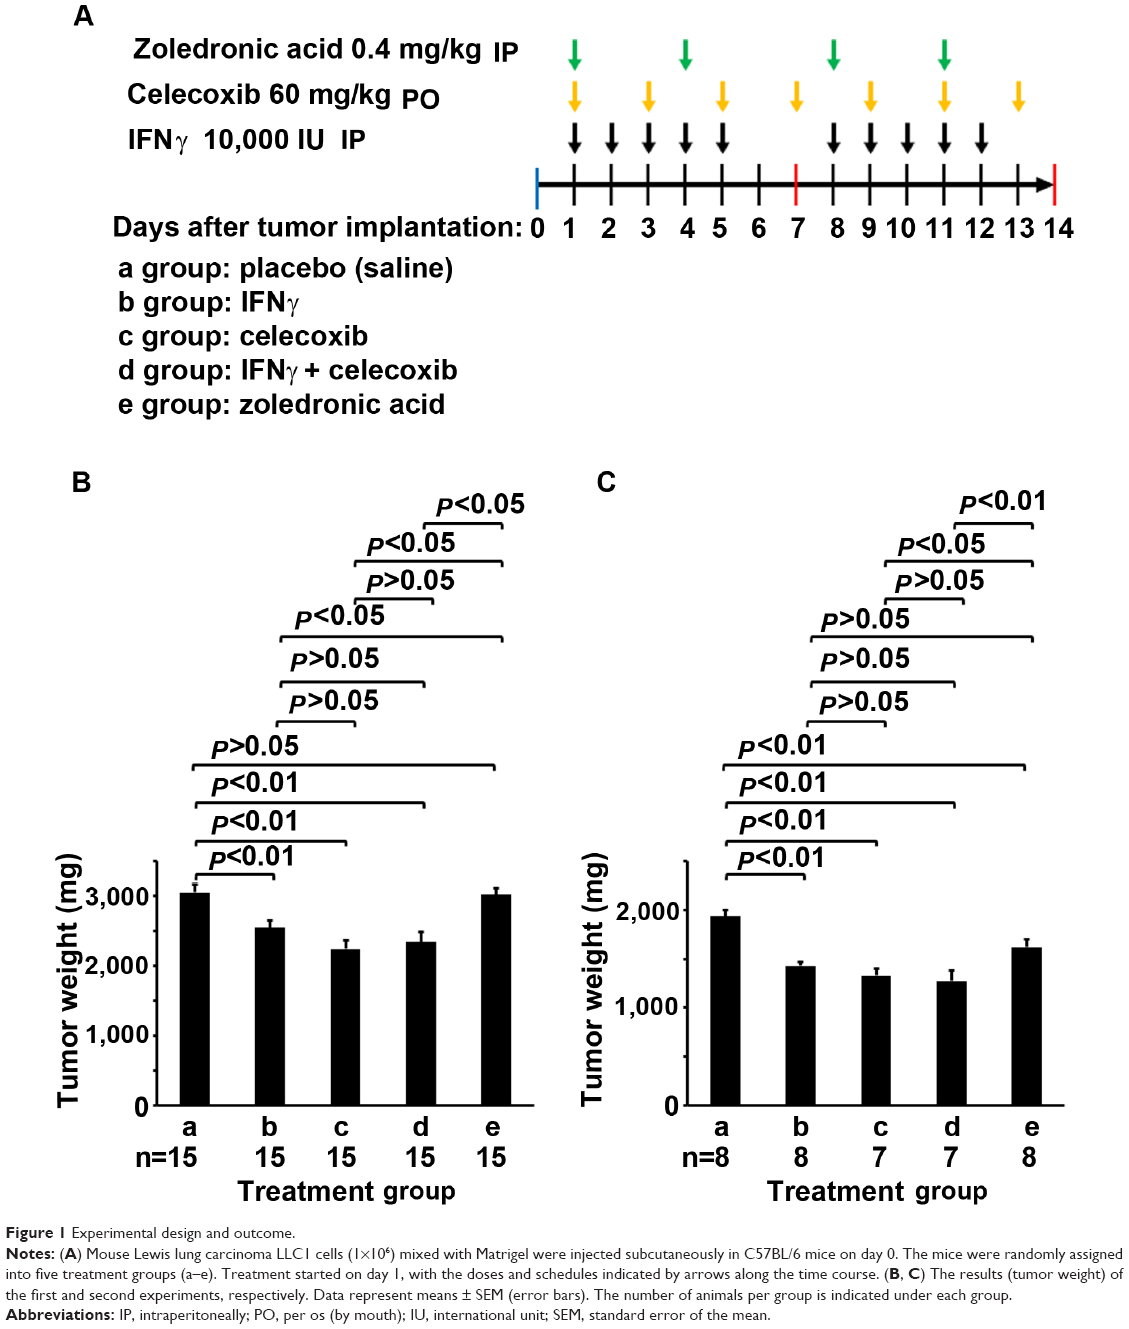 | Figure 1 Experimental design and outcome. |
Histopathology
The subcutaneous tumors were dissected out en bloc and weighed for wet weight. In the first experiment, all tumor tissues were fixed with 10% formalin and embedded in paraffin. Five-micrometer sections were cut for histopathologic examination and immunohistochemical (IHC) staining. In the second experiment, approximately 10% of each tumor was fixed and paraffin-sectioned for histopathologic examination, and the rest was used for flow-cytometry analysis.
Immunohistochemical staining
IHC staining was performed as described previously.25,26 The primary antibodies used were: rabbit anti-MMP-2 (1:50 dilution), rabbit anti-MMP-9 (1:150 dilution), rabbit anti-VEGF (1:100 dilution), and rabbit anti-factor VIII (1:200). All primary antibodies were purchased from Beijing Biosynthesis Biotechnology (Beijing, PRC). Tissue sections previously stained positively were used as positive controls, while tissue sections with primary antibodies replaced by phosphate-buffered saline (PBS) served as negative controls. Streptavidin peroxidase-conjugated secondary antibodies (SP-9002) and a diaminobenzidine substrate kit were obtained from Zhongshan Golden Bridge Biotechnology (Beijing, PRC). The staining was performed according to the kit manufacturer’s instructions. Sections were then counterstained with hematoxylin and mounted in an aqueous mounting medium. Positive cells showed brown particles on the cellular membrane and/or in the cytoplasm. The stained sections were evaluated in a blinded manner (ie, the examiner did not know which group the sections belonged to). Staining of MMP-2, MMP-9, and VEGF was graded in a two-score system according to a previous report.27 The proportion score represented the estimated fraction of positive staining: 0= no staining, 1=1%–25%, 2=26%–50%, 3=51%–75%, 4=76%–100%. The intensity score represented the estimated average staining intensity of the positive staining: 0= no staining, 1= weak, 2= intermediate, 3= strong. The overall score of staining is the sum of the proportion score and the intensity score (range 0–7). The average score from five high-power fields (magnification 200×) represented the staining score of each tumor. The density of microvessels was assessed according to a previous study.28 The number of factor VIII-positive microvessels was counted under five high-power fields (magnification 200×), and the average number per high-power field represented the density of microvessels in each tumor. The data represent means ± standard error of the mean of 15 tumors per group (n=15).
Flow-cytometry analysis
Fresh tumors were cut into approximately 1 mm3 pieces and digested with 0.5 mg/mL collagenase IV in Dulbecco’s modified Eagle’s medium at 37°C with shaking at 100 rounds per minute for 2 hours. The cells were filtered through a 70 μm filter and subjected to red cell-lysis buffer. Then, the cells were fixed with 4% paraformaldehyde and permeabilized with 0.5% Triton X-100. After being washed twice with PBS, the cells were aliquoted into 1×10⁶ cells in 100 μL PBS in 1.5 mL microcentrifuge tubes for staining. To each test tube was added three antibodies conjugated with different fluorophores: rat antimouse CD68-phycoerythrin (PE) (1:100 dilution; BioLegend, San Diego, CA, USA), rat antimouse iNOS-Alexa Fluor® 488 (1:50 dilution; eBioscience, San Diego, CA, USA), and sheep antimouse arginase 1-allophycocyanin (APC) (1:50 dilution, R&D Systems, Minneapolis, MN, USA). As negative control, three isotype control antibodies were used: rat IgG2α, κ-PE (1:100 dilution, BioLegend), rat IgG2α, κ-Alexa Fluor 488 (1:50 dilution; eBioscience), and sheep IgG-APC (1:50 dilution; R&D Systems). The cells were stained for 1 hour at 4°C, with gentle shaking every 10 minutes. After being washed twice with PBS, the cells were suspended in 0.5 mL PBS and analyzed with Cytomics FC500 flow cytometry and its software (Beckman Coulter, Brea, CA, USA). Unstained and single antibody-stained samples were used to adjust color compensation and gating of the positively stained population. The CD68-PE-positive cells (macrophages) were gated first, from which population the iNOS-Alexa Fluor 488-positive cells (CD68+iNOS+ M1 macrophages) and ARG1-APC-positive cells (CD68+ARG1+ M2 macrophages) were gated. Data represent the means ± standard error of the mean of seven or eight tumors (n=7 for groups c and d, in which one mouse each died due to injuries caused by gavage, and thus only seven mice per group survived to the end point; n=8 for groups a, b, and e, as originally planned).
Statistical analysis
Statistical analysis was carried out using the SPSS version 19.0 for Windows (SPSS, Chicago, IL, USA). Comparison among multiple groups was analyzed with analysis of variance. P-values <0.05 were considered statistically significant.
Results
IFNγ and celecoxib inhibit mouse lung-tumor growth
We implanted mouse LLC1 cells subcutaneously into syngeneic C57BL/6 mice. The mice were randomly assigned into five groups: a) treated with saline as the placebo control group, b) treated with IFNγ, c) treated with celecoxib (COX-2 inhibitor), d) treated with a combination of IFNγ and celecoxib, and e) treated with zoledronic acid that can kill macrophages (Figure 1A). In the first experiment, we found that IFNγ alone reduced tumor weight by 17% compared to the control group (P<0.01, Figure 1B). Celecoxib alone reduced tumor weight by 27% compared to the control group (P<0.01, Figure 1B). The combination of IFNγ and celecoxib reduced tumor weight by 23% compared to the control group (P<0.01, Figure 1B). However, there was no statistically significant difference between the combined-treatment group and IFNγ-alone or the celecoxib-alone groups (P>0.05, Figure 1B). Zoledronic acid did not significantly reduce tumor weight compared to the control group (P>0.05, Figure 1B). In the second experiment, we found that IFNγ alone reduced tumor weight by 26% compared to the control group (P<0.01, Figure 1C). Celecoxib alone reduced tumor weight by 31% compared to the control group (P<0.01, Figure 1C). The combination of IFNγ and celecoxib reduced tumor weight by 34% compared to the control group (P<0.01, Figure 1C). Like the first experiment, there was no statistically significant difference between the combined-treatment group and IFNγ-alone or celecoxib alone groups (P>0.05, Figure 1C). Unlike the first experiment, zoledronic acid reduced tumor weight by 16% compared to the control group (P<0.01, Figure 1C). Of note, we found that all animals gained body weight during the treatment, and there was no statistically significant difference among the five groups (data not shown).
IFNγ and celecoxib modulate the M2/M1 macrophage ratio in the tumors
We examined the percentage of macrophages in the cellular population of the tumors by staining with anti-CD68 antibodies and analyzing with flow cytometry. The CD68-positive macrophages were gated in window C of the histograms (Figure 2, A–E, left panels). From the CD68-positive population, iNOS-positive (CD68+iNOS+) cells and ARG1-positive (CD68+ARG1+) cells were separately gated out, representing M1 and M2 macrophages, respectively (Figure 2, A–E, right panels). Isotype antibody controls are shown in Figure 2F. We found that IFNγ or celecoxib alone did not change the percentage of macrophages, while the combination of IFNγ and celecoxib increased the proportion of macrophages by approximately 11% (P<0.05, Figure 2G). In contrast, zoledronic acid decreased the proportion of macrophages by approximately 30% (P<0.01, Figure 2G). Both IFNγ alone and celecoxib alone increased the proportion of M1 macrophages by 116% compared to the control group (P<0.01, Figure 2H). The combination of IFNγ and celecoxib increased the proportion of M1 macrophages by 158% compared to the control group (P<0.01, Figure 2H), the increase of which was also significantly higher than IFNγ alone or celecoxib alone (P<0.01). In contrast, zoledronic acid did not change the proportion of M1 macrophages (P>0.05, Figure 2H). On the other hand, IFNγ decreased the proportion of M2 macrophages by 48% compared to the control group (P<0.01, Figure 2I). Celecoxib decreased the proportion of M2 macrophages by 19% compared to the control group (P<0.01, Figure 2I). The combination of IFNγ and celecoxib decreased the proportion of M2 macrophages by 52% compared to the control group (P<0.01, Figure 2I), the decrease of which was significantly more than celecoxib alone (P<0.01), but not significantly more than IFNγ alone (P>0.05). In contrast, zoledronic acid did not change the proportion of M2 macrophages (P>0.05, Figure 2I). Based on the proportions of M1 and M2 macrophages in the tumors (Figure 2, H and I), we calculated that the M2/M1 macrophage ratio in the control group was 4.4, whereas IFNγ reduced the M2/M1 macrophage ratio to 1.1. Celecoxib reduced the M2/M1 macrophage ratio to 1.7, and the combination of the IFNγ and celecoxib reduced the M2/M1 macrophage ratio to 0.8. In contrast, zoledronic acid slightly increased the M2/M1 macrophage ratio to 4.8.
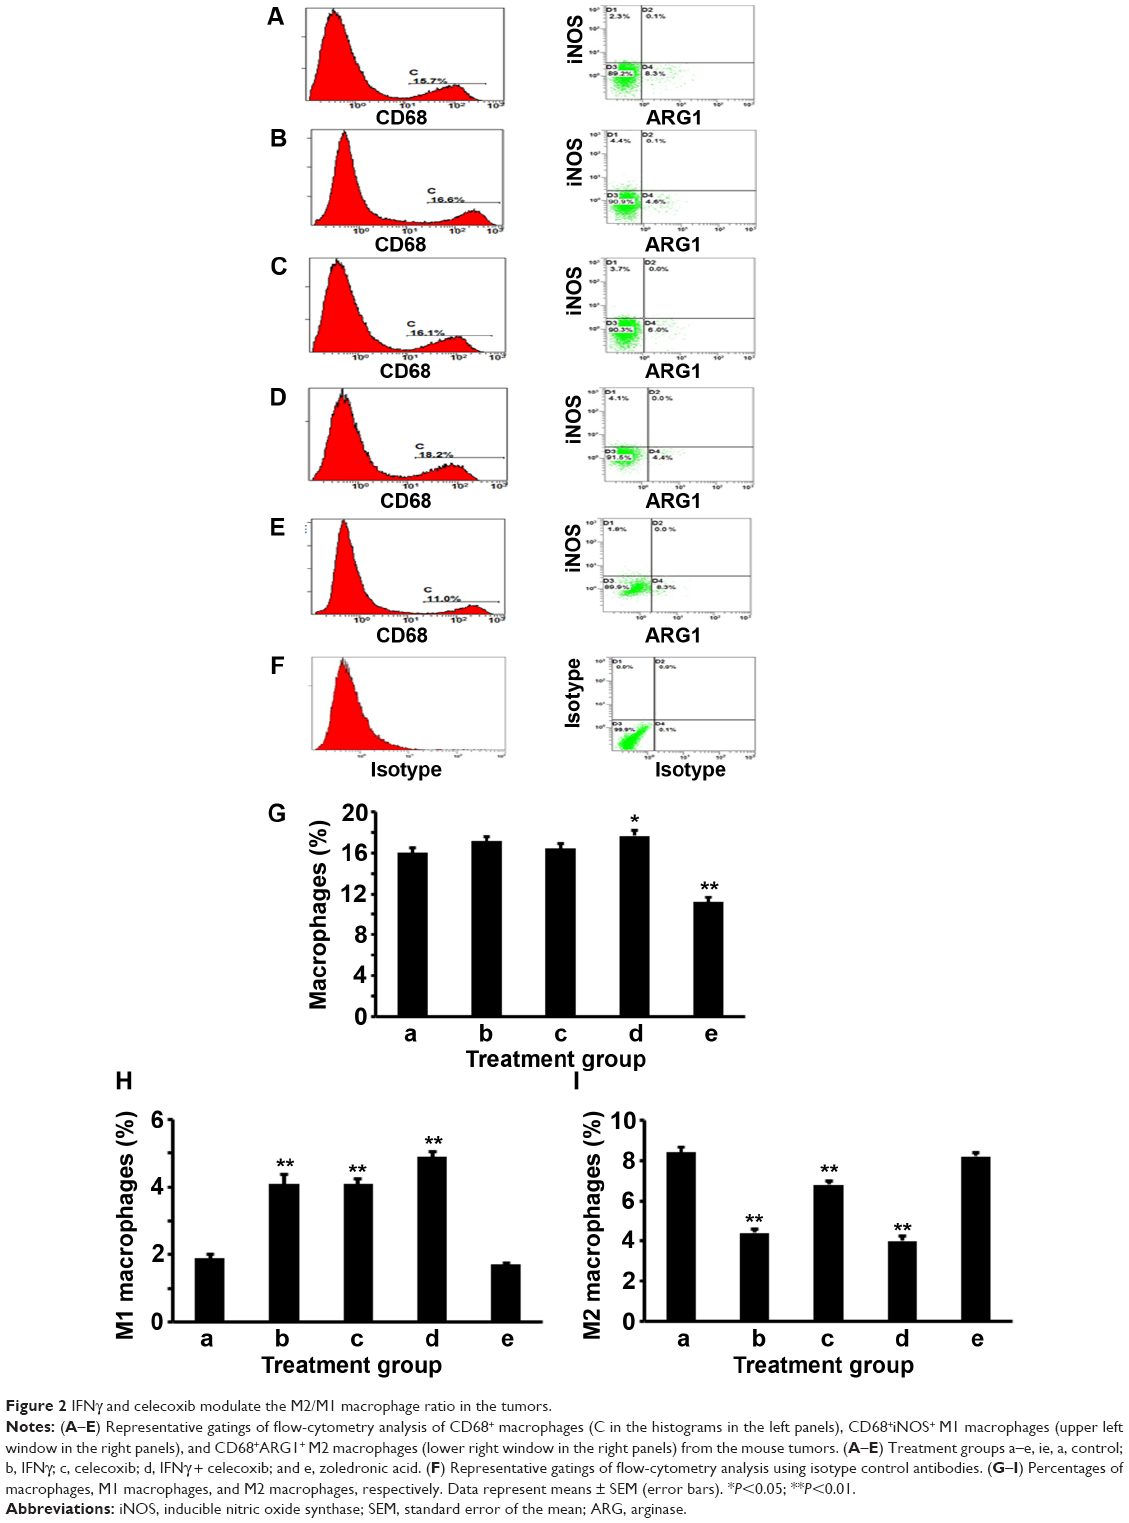 | Figure 2 IFNγ and celecoxib modulate the M2/M1 macrophage ratio in the tumors. |
IFNγ, celecoxib, and zoledronic acid decrease expression of MMP-2 and MMP-9
We did IHC staining of MMP-2 and MMP-9 in the tumor sections and quantified the staining using a two-score grading system.27 We found that MMP-2 expression was significantly reduced by IFNγ alone, celecoxib alone, a combination of IFNγ and celecoxib, and zoledronic acid, compared to the control group (Figure 3, A–G, P<0.01). However, there was no statistically significant difference among the four drug-treatment groups (P>0.05). Similarly, we found that MMP-9 expression was significantly reduced by IFNγ alone, celecoxib alone, a combination of IFNγ and celecoxib, and zoledronic acid, compared to the control group (Figure 4, A–G, P<0.05 and P<0.01, respectively). Again, there was no statistically significant difference among the four drug-treatment groups (P>0.05).
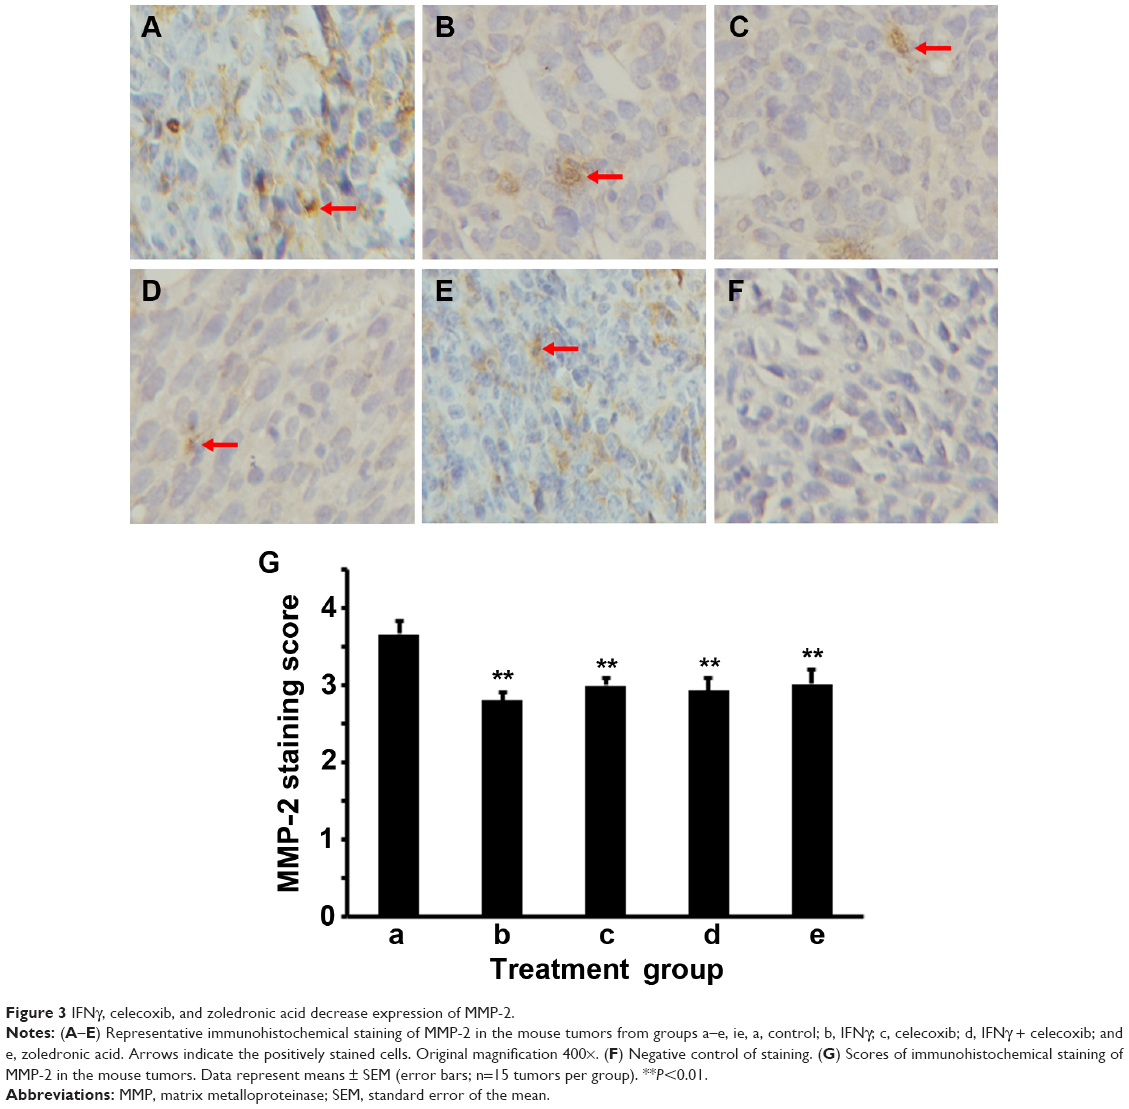 | Figure 3 IFNγ, celecoxib, and zoledronic acid decrease expression of MMP-2. |
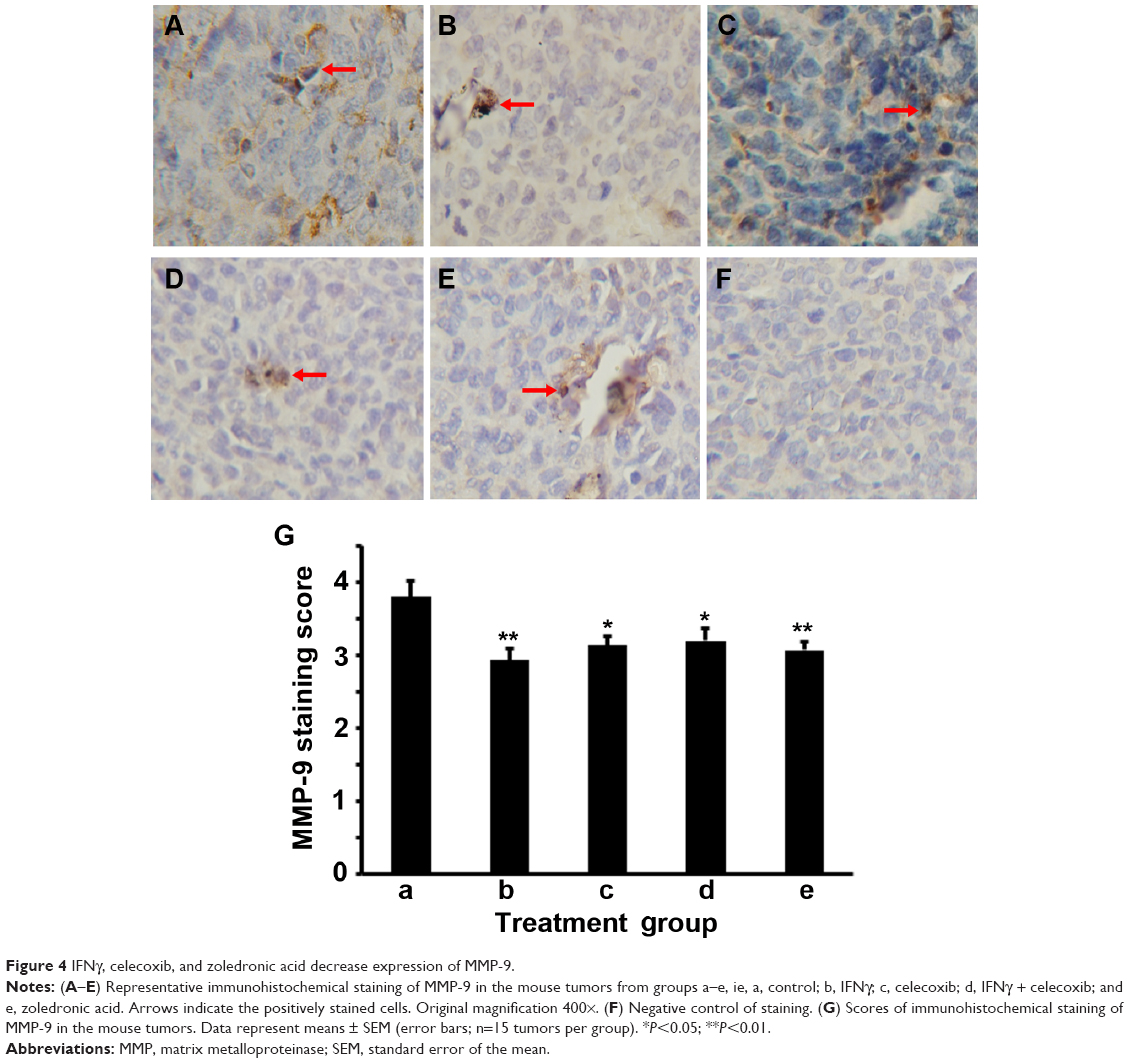 | Figure 4 IFNγ, celecoxib, and zoledronic acid decrease expression of MMP-9. |
IFNγ and celecoxib decrease VEGF expression and density of microvessels
We did IHC staining of VEGF in the tumor sections and quantified the staining using a two-score grading system.27 We found that VEGF expression was significantly reduced by IFNγ alone, celecoxib alone, and a combination of IFNγ and celecoxib, compared to the control group (Figure 5, A–D, F, G; P<0.01). However, there was no statistically significant difference among these three drug-treatment groups (P>0.05). In contrast, zoledronic acid did not significantly change the expression of VEGF (P>0.05, Figure 5, E–G). We assessed the density of microvessels in the tumors by factor VIII staining according to a previous study.28 We found that IFNγ alone, celecoxib alone, and a combination of IFNγ and celecoxib significantly decreased the density of microvessels compared to the control group (Figure 6, A–D, F, G; P<0.05 and P<0.01, respectively). The density of microvessels was significantly lower in the combined-treatment group than the IFNγ-alone group (P<0.05), but not significantly different from the celecoxib-alone group (P>0.05). In contrast, zoledronic acid did not significantly change the density of microvessels in the tumors (P>0.05, Figure 6, E–G).
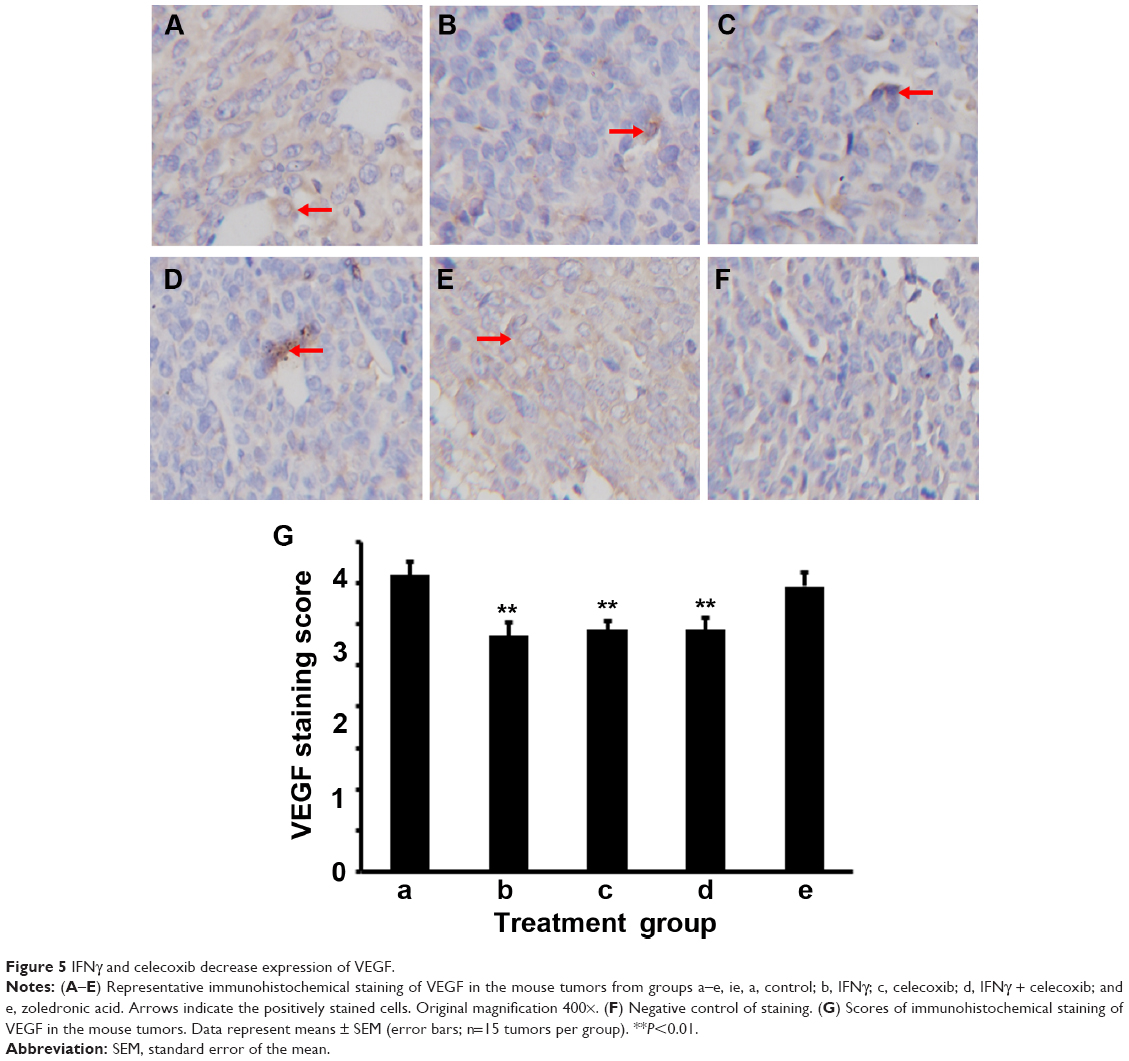 | Figure 5 IFNγ and celecoxib decrease expression of VEGF. |
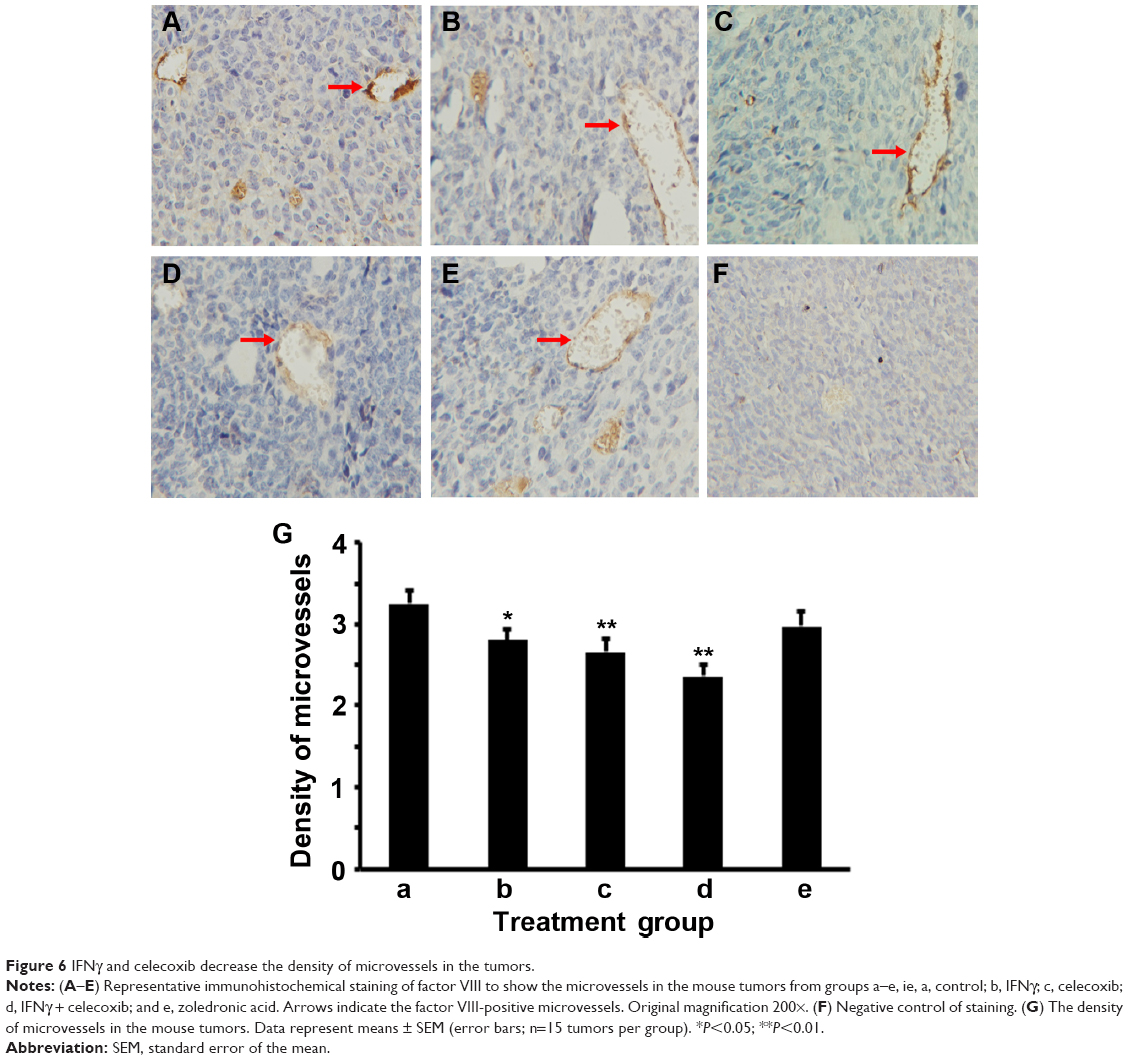 | Figure 6 IFNγ and celecoxib decrease the density of microvessels in the tumors. |
Discussion
In the lung-tumor microenvironment, M2 macrophages usually outnumber M1 macrophages, creating a protumor immune microenvironment. Other cancers also present an M2-dominant tumor microenvironment, including prostate cancer and ovarian cancer.29–31 Since M1 macrophages inhibit tumor growth while M2 macrophages promote tumor growth by expressing VEGF and MMPs,11 it is intriguing to investigate if enhancing M1 macrophage differentiation and inhibiting M2 macrophage differentiation would affect tumor growth.
In the present study, we tested IFNγ, a well-known inducer of M1 macrophage differentiation,20,21 and celecoxib, a COX-2 inhibitor.22 We speculated that celecoxib could inhibit COX-2 and reduce PGE2 production, thus inhibiting M2 macrophage differentiation, based on our previous study showing that PGE2 facilitates M2 macrophage differentiation.19 We found that IFNγ and celecoxib, either used alone or in combination, consistently inhibited lung-tumor growth in two independent experiments. IFNγ or celecoxib alone did not change the percentage of total macrophages, but their combination slightly increased the percentage of total macrophages. What was remarkable was that both IFNγ alone and celecoxib alone significantly increased the percentage of M1 macrophages, but decreased the percentage of M2 macrophages in the tumors. Therefore, the M2/M1 macrophage ratio was reduced to 1.1 and 1.7 by IFNγ alone and celecoxib alone, respectively. In contrast, the M2/M1 macrophage ratio in the control group was 4.4, which is four times and 2.6 times of those in the IFNγ-alone and celecoxib-alone groups, respectively. These results suggest that IFNγ and celecoxib indeed can modulate the M2/M1 macrophage ratio in the lung-tumor microenvironment. However, we only observed a slight further reduction of the M2/M1 macrophage ratio to 0.8 by the combination of IFNγ and celecoxib. This is because the combined treatment did not reduce M2 macrophages further than IFNγ alone, although the combined treatment increased the M1 percentage significantly more than IFNγ alone or celecoxib alone. Therefore, the synergy between IFNγ and celecoxib in modulating the M2/M1 macrophage ratio is not obvious, which is consistent with the lack of synergy in inhibition of tumor growth. Furthermore, IFNγ alone, celecoxib alone, and their combination reduced the expression of MMP-2, MMP-9, and VEGF to similar levels, which is another piece of evidence showing the lack of synergy between IFNγ and celecoxib. The density of microvessels in the tumors was also decreased by IFNγ alone, celecoxib alone, and their combination, except that the decrease with the combined treatment was significantly more than the IFNγ-alone treatment. Taken together, these results suggest that IFNγ alone or celecoxib alone can reduce the M2/M1 macrophage ratio in the tumor microenvironment, thus decreasing expression of MMP-2, MMP-9, and VEGF and associated angiogenesis, resulting in inhibition of mouse lung-tumor growth. IFNγ and celecoxib given at the current doses and schedules appear to have neither any synergy in modulating the M2/M1 macrophage ratio nor any synergy in inhibiting tumor growth.
It has been shown that TAM depletion reprograms the immunosuppressive tumor microenvironment and creates an antitumor immune microenvironment in breast cancer and liver cancer.23,32 TAMs may be a therapeutic target in other tumors, such as prostate cancer, renal cell carcinoma, and osteosarcoma.31,33,34 In addition, anti-EGFR antibody (cetuximab) may activate M2 macrophages, which might be the reason that addition of cetuximab to bevacizumab plus chemotherapy showed a negative outcome.35 This finding implies that anti-TAM approaches may have potential in combinatory therapies. In this study, we tested if TAM depletion by zoledronic acid could affect tumor growth in our mouse lung cancer model. We did not find any inhibition of tumor growth in the first experiment, but we did see a 16% decrease in the tumor weight in the second experiment. The percentage of total macrophages was decreased in both experiments. We speculate that the discrepancy between the two experiments may be due to the difference in tumor growth. On average, the tumors in the first experiment grew much bigger than the second experiment. Although we implanted the same number of cells in both experiments, it could be that the cell viability and cellular growth status were not the same, so the live cell number was fewer in the second experiment than the first experiment. Therefore, inhibition of tumor growth was more obvious in the second experiment by IFNγ alone, celecoxib alone, and a combination of IFNγ and celecoxib, as well as zoledronic acid. Although zoledronic acid reduced expression of MMP-2 and MMP-9, it did not affect VEGF expression or the density of microvessels in the tumors. This may partially explain the fact that in small tumors, zoledronic acid may have some effects, but in large tumors where more angiogenesis occurs, zoledronic acid becomes ineffective in treating subcutaneous tumors. It is worth pointing out that zoledronic acid has only been approved for treating multiple myeloma and cancer bone metastasis, as well as other bone-related diseases.36 Based on our study, we are not optimistic about zoledronic acid’s effects on lung tumors other than bone metastasis.
One limitation of the present study is that only a single dosage of each drug was tested. The doses and administration schedules were chosen based on previous reports.37–39 It is reasonable to speculate that those doses may not necessarily be the optimal ones. Nevertheless, the positive results from the empirical doses used in this study are encouraging. Future studies are warranted to investigate the dose-dependent effects of IFNγ alone, celecoxib alone, and a combination of the optimal doses of IFNγ and celecoxib. The second limitation is that the treatments were given immediately after tumor inoculation. Any effects should be considered prophylactic in terms of preventing tumor growth, and the effects observed were minimal. The design of treatments after establishment of tumors and optimization to obtain more dramatic effects shall be considered in further studies. The third limitation of this study is that only CD68 in combination with iNOS and ARG1 were used for defining M1 and M2 macrophages, because the flow-cytometry instrument used was only able to show three colors. Ideally, a panel of six to eight markers (including F4/80) should be used. Finally, the association between macrophages and MMP-2, MMP-9, and VEGF is only suggestive, as other cells (tumor cells, fibroblasts, etc) may also express them.
In conclusion, this study provides the proof of principle that IFNγ and/or celecoxib treatment may inhibit lung-tumor growth through modulating the M2/M1 macrophage ratio in the tumor microenvironment, suggesting that IFNγ and celecoxib have potential to be further optimized in a new anticancer therapy.
Acknowledgments
This work was partially supported by the National Natural Science Foundation of China (NSFC 81172236 – The mechanism of TAMs activation in lung cancer and a novel immunotherapy; NSFC 81372505 – The role of IL-17 in formation and progression of primary lung cancer and the underlying molecular mechanisms) and the Key Science and Technology Program of Sichuan Province, People’s Republic of China (2009SZ0152 and 2011SZ0111) to LL. ZY was partially supported by two grants from the National Institute of General Medical Sciences (P20GM103518) and the National Cancer Institute (R01CA174714) of the National Institutes of Health, three grants from Department of Defense Health Program through the Prostate Cancer Research Program (W81XWH-14-1-0050, W81XWH-14-1-0149, and PC130118; the US Army Medical Research Acquisition Activity, 820 Chandler Street, Fort Detrick, MD 21702-5014 is the awarding and administering acquisition office), the Developmental Fund of Tulane Cancer Center (TCC), and Louisiana Cancer Research Consortium (LCRC) Fund. The content of this article is solely the responsibility of the authors, and does not necessarily represent the official views of the National Institutes of Health or the Department of Defense.
Disclosure
The authors report no conflicts of interest in this work.
References
Ledford H. Cancer treatment: the killer within. Nature. 2014; 508(7494):24–26. | ||
Kantoff PW, Higano CS, Shore ND, et al. Sipuleucel-T immunotherapy for castration-resistant prostate cancer. N Engl J Med. 2010;363(5): 411–422. | ||
Hodi FS, O’Day SJ, McDermott DF, et al. Improved survival with ipilimumab in patients with metastatic melanoma. N Engl J Med. 2010;363(8):711–723. | ||
Harvey RD. Immunologic and clinical effects of targeting of PD-1 in lung cancer. Clin Pharmacol Ther. 2014;96(2):214–223. | ||
Topalian SL, Hodi FS, Brahmer JR, et al. Safety, activity, and immune correlates of anti-PD-1 antibody in cancer. N Engl J Med. 2012;366(26): 2443–2454. | ||
Brahmer JR, Tykodi SS, Chow LQ, et al. Safety and activity of anti-PD-L1 antibody in patients with advanced cancer. N Engl J Med. 2012;366(26):2455–2465. | ||
Lipson EJ, Sharfman WH, Drake CG, et al. Durable cancer regression off-treatment and effective reinduction therapy with an anti-PD-1 antibody. Clin Cancer Res. 2013;19(2):462–468. | ||
Witz IP, Levy-Nissenbaum O. The tumor microenvironment in the post-PAGET era. Cancer Lett. 2006;242(1):1–10. | ||
Lewis CE, Pollard JW. Distinct role of macrophages in different tumor microenvironments. Cancer Res. 2006;66(2):605–612. | ||
Mantovani A, Sica A, Locati M. New vistas on macrophage differentiation and activation. Eur J Immunol. 2007;37(1):14–16. | ||
Mantovani A, Sica A, Locati M. Macrophage polarization comes of age. Immunity. 2005;23(4):344–346. | ||
Baj-Krzyworzeka M, Szatanek R, Weglarczyk K, Baran J, Zembala M. Tumour-derived microvesicles modulate biological activity of human monocytes. Immunol Lett. 2007;113(2):76–82. | ||
Mantovani A, Sozzani S, Locati M, Allavena P, Sica A. Macrophage polarization: tumor-associated macrophages as a paradigm for polarized M2 mononuclear phagocytes. Trends Immunol. 2002;23(11): 549–555. | ||
Martinez FO, Sica A, Mantovani A, Locati M. Macrophage activation and polarization. Front Biosci. 2008;13:453–461. | ||
Gordon S. Alternative activation of macrophages. Nat Rev Immunol. 2003;3(1):23–35. | ||
Mantovani A, Bottazzi B, Colotta F, Sozzani S, Ruco L. The origin and function of tumor-associated macrophages. Immunol Today. 1992;13(7):265–270. | ||
Galdiero MR, Garlanda C, Jaillon S, Marone G, Mantovani A. Tumor associated macrophages and neutrophils in tumor progression. J Cell Physiol. 2013;228(7):1404–1412. | ||
Ma J, Liu L, Che G, Yu N, Dai F, You Z. The M1 form of tumor-associated macrophages in non-small cell lung cancer is positively associated with survival time. BMC Cancer. 2010;10:112. | ||
Liu L, Ge D, Ma L, et al. Interleukin-17 and prostaglandin E2 are involved in formation of an M2 macrophage-dominant microenvironment in lung cancer. J Thorac Oncol. 2012;7(7):1091–1100. | ||
Davis MJ, Tsang TM, Qiu Y, et al. Macrophage M1/M2 polarization dynamically adapts to changes in cytokine microenvironments in Cryptococcus neoformans infection. MBio. 2013;4(3):e00264-13. | ||
Sica A, Mantovani A. Macrophage plasticity and polarization: in vivo veritas. J Clin Invest. 2012;122(3):787–795. | ||
Zhang H, Li Z, Wang K. Combining sorafenib with celecoxib synergistically inhibits tumor growth of non-small cell lung cancer cells in vitro and in vivo. Oncol Rep. 2014;31(4):1954–1960. | ||
Zhang W, Zhu XD, Sun HC, et al. Depletion of tumor-associated macrophages enhances the effect of sorafenib in metastatic liver cancer models by antimetastatic and antiangiogenic effects. Clin Cancer Res. 2010;16(13):3420–3430. | ||
Bertram JS, Janik P. Establishment of a cloned line of Lewis lung carcinoma cells adapted to cell culture. Cancer Lett. 1980;11(1):63–73. | ||
Zhang Q, Liu S, Ge D, et al. Interleukin-17 promotes formation and growth of prostate adenocarcinoma in mouse models. Cancer Res. 2012; 72(10):2589–2599. | ||
Dai F, Liu L, Che G, et al. The number and microlocalization of tumor-associated immune cells are associated with patient’s survival time in non-small cell lung cancer. BMC Cancer. 2010;10:220. | ||
Rahman MA, Dhar DK, Yamaguchi E, et al. Coexpression of inducible nitric oxide synthase and COX-2 in hepatocellular carcinoma and surrounding liver: possible involvement of COX-2 in the angiogenesis of hepatitis C virus-positive cases. Clin Cancer Res. 2001;7(5): 1325–1332. | ||
Weidner N. Current pathologic methods for measuring intratumoral microvessel density within breast carcinoma and other solid tumors. Breast Cancer Res Treat. 1995;36(2):169–180. | ||
Redente EF, Dwyer-Nield LD, Merrick DT, et al. Tumor progression stage and anatomical site regulate tumor-associated macrophage and bone marrow-derived monocyte polarization. Am J Pathol. 2010;176(6): 2972–2985. | ||
Zhang M, He Y, Sun X, et al. A high M1/M2 ratio of tumor-associated macrophages is associated with extended survival in ovarian cancer patients. J Ovarian Res. 2014;7(1):19. | ||
Lanciotti M, Masieri L, Raspollini MR, et al. The role of M1 and M2 macrophages in prostate cancer in relation to extracapsular tumor extension and biochemical recurrence after radical prostatectomy. Biomed Res Int. 2014;2014:486798. | ||
DeNardo DG, Brennan DJ, Rexhepaj E, et al. Leukocyte complexity predicts breast cancer survival and functionally regulates responses to chemotherapy. Cancer Discov. 2011;1(1):54–67. | ||
Santoni M, Massari F, Amantini C, et al. Emerging role of tumor-associated macrophages as therapeutic targets in patients with metastatic renal cell carcinoma. Cancer Immunol Immunother. 2013;62(12): 1757–1768. | ||
Pahl JH, Kwappenberg KM, Varypataki EM, et al. Macrophages inhibit human osteosarcoma cell growth after activation with the bacterial cell wall derivative liposomal muramyl tripeptide in combination with interferon-γ. J Exp Clin Cancer Res. 2014;33:27. | ||
Pander J, Heusinkveld M, van der Straaten T, et al. Activation of tumor-promoting type 2 macrophages by EGFR-targeting antibody cetuximab. Clin Cancer Res. 2011;17(17):5668–5673. | ||
Ibrahim A, Scher N, Williams G, et al. Approval summary for zoledronic acid for treatment of multiple myeloma and cancer bone metastases. Clin Cancer Res. 2003;9(7):2394–2399. | ||
Senzaki M, Ishida S, Yada A, et al. CS-706, a novel cyclooxygenase-2 selective inhibitor, prolonged the survival of tumor-bearing mice when treated alone or in combination with anti-tumor chemotherapeutic agents. Int J Cancer. 2008;122(6):1384–1390. | ||
Curnis F, Gasparri A, Sacchi A, Cattaneo A, Magni F, Corti A. Targeted delivery of IFNγ to tumor vessels uncouples antitumor from counterregulatory mechanisms. Cancer Res. 2005;65(7):2906–2913. | ||
Hung TT, Chan J, Russell PJ, Power CA. Zoledronic acid preserves bone structure and increases survival but does not limit tumour incidence in a prostate cancer bone metastasis model. PLoS One. 2011;6(5):e19389. |
 © 2014 The Author(s). This work is published and licensed by Dove Medical Press Limited. The
full terms of this license are available at https://www.dovepress.com/terms
and incorporate the Creative Commons Attribution
- Non Commercial (unported, 3.0) License.
By accessing the work you hereby accept the Terms. Non-commercial uses of the work are permitted
without any further permission from Dove Medical Press Limited, provided the work is properly
attributed. For permission for commercial use of this work, please see paragraphs 4.2 and 5 of our Terms.
© 2014 The Author(s). This work is published and licensed by Dove Medical Press Limited. The
full terms of this license are available at https://www.dovepress.com/terms
and incorporate the Creative Commons Attribution
- Non Commercial (unported, 3.0) License.
By accessing the work you hereby accept the Terms. Non-commercial uses of the work are permitted
without any further permission from Dove Medical Press Limited, provided the work is properly
attributed. For permission for commercial use of this work, please see paragraphs 4.2 and 5 of our Terms.