Back to Journals » Nanotechnology, Science and Applications » Volume 10
Interfacial surfactant competition and its impact on poly(ethylene oxide)/Au and poly(ethylene oxide)/Ag nanocomposite properties
Authors Seyhan M, Kucharczyk W, Yarar UE, Rickard K, Rende D, Baysal N ![]() , Bucak S
, Bucak S ![]() , Ozisik R
, Ozisik R ![]()
Received 5 December 2016
Accepted for publication 3 February 2017
Published 20 April 2017 Volume 2017:10 Pages 69—77
DOI https://doi.org/10.2147/NSA.S129468
Checked for plagiarism Yes
Review by Single anonymous peer review
Peer reviewer comments 3
Editor who approved publication: Professor Israel Rubinstein
Merve Seyhan,1 William Kucharczyk,2 U Ecem Yarar,1 Katherine Rickard,2 Deniz Rende,2,3 Nihat Baysal,4 Seyda Bucak,1 Rahmi Ozisik2,3
1Department of Chemical Engineering, Yeditepe University, Istanbul, Turkey; 2Department of Materials Science and Engineering, 3Center for Materials, Devices, and Integrated Systems, 4Department of Chemical and Biological Engineering, Rensselaer Polytechnic Institute, Troy, NY, USA
Abstract: The structure and properties of nanocomposites of poly(ethylene oxide), with Ag and Au nanoparticles, surface modified with a 1:1 (by volume) oleylamine/oleic acid mixture, were investigated via transmission electron microscopy, scanning electron microscopy, thermogravimetric analysis, differential scanning calorimetry (DSC), infrared spectroscopy, dynamic mechanical analysis, and static mechanical testing. Results indicated that there was more oleylamine on Ag nanoparticles but more oleic acid on Au nanoparticles. This difference in surfactant populations on each nanoparticle led to different interfacial interactions with poly(ethylene oxide) and drastically influenced the glass transition temperature of these two nanocomposite systems. Almost all other properties were found to correlate strongly with dispersion and distribution state of Au and Ag nanoparticles, such that the property in question changed direction at the onset of agglomeration.
Keywords: polymer nanocomposites, surfactants, interfacial interactions
Introduction
It is known that gold (Au) and silver (Ag) have been widely used in ancient times for mostly esthetic and curing purposes. The first “scientific” use of Au was reported by Faraday1 in 1857. Faraday suggested a synthesis route for Au nanoparticles through reduction of Au salts (chloroaurate, AuCl4–) using phosphorus-stabilized carbon disulfide (CS2) and studied their optical properties by drop casting Au nanoparticle solution on thin films. Since then, metal nanoparticles, especially Au and Ag nanoparticles, have attracted great interest due to their unique properties.
In the nanometer size scale, electronic, physical, and chemical properties of metallic nanoparticles show variations. The fundamental properties of nanoparticles depend not only on their structure but also on their shape, crystallinity, and crystal phase.2 Nanoparticles have been added to synthetic materials to improve their properties such as mechanical,3,4 electrical,4–6 and optical properties,7 and gas permeability.8,9 Usually, inorganic nanofillers, including metals and metal alloys (e.g., Au, Ag, Cu, Ge, Pt, Fe, and CoPt), semiconductors (e.g., PbS, CdS, CdSe, CdTe, and ZnO), clay minerals (e.g., montmorillonite, vermiculite, hectorite, and CaCO3), other oxides (e.g., TiO2, SiO2, and ferric oxide), and carbon-based materials (e.g., carbon nanotubes, graphene, and carbon nanofibers), are added to polymers to be used in various applications.2 The significant changes observed in the physical and mechanical properties of polymers due to incorporation of inorganic nanoparticles are generally explained by interfacial interactions between polymer matrix and nanofillers, and by confinement of polymer chains due to nanoscale filler to filler distances. Polymer nanocomposites are used in many industrial areas such as electronic devices,10,11 food packaging,12 and automotive or aircraft components13 because of their unique properties such as high mechanical strength, thermal and chemical stability, good optical clarity, and heat resistance. In addition, the use of polymer nanocomposites as biomaterials became very popular due to their favorable properties such as good biocompatibility, easy design and preparation, and ability to obtain a variety of structures and interesting biomimetic characteristics. Drug delivery techniques that use polymeric nanocomposites cover cancer targeting,14 protein and gene delivery,15,16 micro- and nanofabricated self-regulated devices,17 biorecognizable systems, etc.
Poly(ethylene oxide) (PEO) is commercially available in a wide range of molecular weights (Mw) from 200 to 7×10⁶ g/mol. Low-molecular-weight PEOs (Mw < 20,000 g/mol) are generally referred to as poly(ethylene glycol) (PEG) and have been widely used since the 1960s in various scientific and biomedical fields.18 PEO is also known for its solubility in water as well as in organic solvents such as toluene and chloroform. The amphiphilicity of PEO comes from its molecular structure. The backbone of PEO consists of both hydrophobic (CH2 groups) and hydrophilic parts. High-molecular-weight PEOs are insoluble in water.19 The major application areas of PEO-based nanocomposites are electrical and biomedical.20 PEG and PEO/lithium-intercalated tungsten disulfide nanocomposites exhibited good conductivity.21 PEO electrolytes have also gained much interest due to their potential applications such as lithium rechargeable batteries and fuel cells.10
Fillers play important roles in modifying structural, mechanical, and thermal properties of nanocomposites. Several researchers studied the influence of Au and Ag nanoparticles on thermal and mechanical properties of polymers. For example, poly(vinyl acetate), and Ag nanocomposite films containing 0–1.5% Ag (by weight) showed a huge increase (~20 times) in Young’s modulus at the highest Ag nanoparticle concentration.22 Similarly, liquid crystal elastomers doped with Au nanoparticles at various concentrations (0.024, 0.048, and 0.096 mol%) showed an enhancement in Young’s modulus of ~75%.23 On the other hand, dispersing 5.6 nm-sized Ag nanoparticles up to 0.5% (by weight) in poly(methyl methacrylate) was found to slightly decrease its Young’s modulus.24
The glass transition temperature (Tg) provides information on dynamics and thermal behavior of polymers. Experiments performed on polymer nanocomposites showed a relationship between polymer mobility and Tg.24,25 Tg of polystyrene/Au nanocomposites was found to decrease gradually with increasing nanoparticle concentration compared to that of neat polystyrene.24 Tg of epoxy/Ag nanocomposites containing Ag nanoparticles with an average diameter of 65 nm at concentrations of 68, 72, and 75% showed a decrease of ~7°C.26 On the contrary, Feyzi et al27 found an increase of 5°C in Tg of polyimide/Ag nanocomposites.
In order to achieve theoretically predicted mechanical property enhancements, for example, in strength or modulus, nanoparticles generally need to be uniformly dispersed and distributed within polymers. However, a homogeneous dispersion of nanoparticles in a polymeric matrix is a very difficult task due to the strong tendency of nanoparticles to agglomerate.28 Consequently, phase separation between components of nanocomposites induces clustering of nanoparticles in polymer matrix. One possible approach to avoid agglomeration and improve dispersion and distribution of nanoparticles in polymers is to alter nanocomposite synthesis such as in situ polymerization of monomers in the presence of nanoparticles, such as the sol–gel process29 and the intercalation polymerization technique.30 Nevertheless, chemically modifying nanoparticles with surfactants remains the simplest and most convenient method to improve dispersion and distribution of nanoparticles in polymers.
In the current study, Au and Ag nanoparticles of comparable sizes were synthesized using the same surfactants and were dispersed in PEO. The effect of nanoparticle type (Au vs. Ag) and concentration on various properties such as thermal and mechanical were then investigated. The current study clearly shows the importance of the state of nanoparticle dispersion and dispersion/distribution of nanoparticles on nanocomposite properties. Most importantly, results indicate that surfactant competition at polymer–nanofiller interface strongly affects final composite properties.
Experimental
Materials
Gold(III) acetate (Alfa Aesar, 99.9%, metal basis), silver acetate (ChemPur GmbH, 99%), oleylamine (Fluka, technical, ≥70%, GC), oleic acid (Aldrich, 65.0–88.0%, GC), and toluene (AnalaR, NORMAPUR®, minimum 99.5%, Tb = 110°C) were used in the synthesis of gold (Au) and silver (Ag) nanoparticles. Chloroform (Sigma Aldrich, St. Louis, MO, USA; anhydrous, ≥99%) and methanol (Chromasolv®; Sigma Aldrich, ≥99.9%) were used to remove excess reagents after nanoparticle synthesis and to suspend Au and Ag nanoparticles. PEO (POLYOX™, WSR 205, Mw = 600,000 g/mol) was kindly donated by Dow Chemicals.
Synthesis and characterization of nanoparticles
An inexpensive and reproducible method for synthesis of Au and Ag nanoparticles was previously proposed by Hiramatsu and Osterloh.31 This method involves the reduction of silver or gold salts via addition of organic surfactants with hydrocarbon chains such as oleylamine and oleic acid. This method is also known to produce organoamine-protected nanoparticles with low polydispersity (6.9%). In a typical synthesis, 0.9 mmol of gold (III) acetate or silver acetate was reduced to metal nanoparticles by refluxing in 150 mL toluene. The resulting solution was mixed with 7.5 mL of oleylamine/oleic acid/chloroform solution in the case of Au nanoparticle synthesis or oleylamine/oleic acid/methanol solution in the case of Ag nanoparticle synthesis. The volumetric ratio of oleylamine and oleic acid in the solution was 1:1. The combined solution was left at room temperature for 24 hours, after which it was centrifuged with methanol three times in order to remove excess reagents. The remaining precipitate was dried at 30°C in an oven, and dried nanoparticles were dispersed in chloroform. The reaction yielded ~0.176 g of Au or 0.097 g of Ag nanoparticles.
The characterization of nanoparticles and nanocomposites was performed via UV–Vis spectrophotometry (Lambda 25 UV/VIS Spectrometer; Perkin Elmer, Waltham, MA, USA), dynamic light scattering (DLS; Zetasizer Nano ZS, Malvern Instruments, Malvern, UK), transmission electron microscopy (TEM; JEM-ARM200CFEG UHR, Jeol Inc., Peabody, MA, USA), Fourier transform infrared spectroscopy (FTIR; Spectrum One, Perkin Elmer), and thermogravimetric analysis (TGA; Pyris 1-TGA, Perkin Elmer). UV–Vis absorption spectra between the wavelengths of 300 and 600 nm were obtained for both Au and Ag nanoparticles dissolved in chloroform by placing samples in optical glass cuvettes with 10 mm path width. Size distribution of Ag and Au nanoparticles and their complexes in chloroform suspensions were measured via DLS experiments. Three independent DLS measurements were performed for each sample at 25°C. Transmission electron microscopy images of nanoparticles were obtained at an accelerating voltage of 200 kV by placing droplets of nanoparticle suspensions onto carbon-coated 200-mesh copper grids and after drying at ambient conditions. Transmission electron microscopy images were analyzed using ImageJ.32,33 Surface coverage of nanoparticles with oleylamine and oleic acid ligands was studied via TGA by heating samples at a constant rate of 10°C/min up to 600°C in nitrogen atmosphere. FTIR measurements of oleylamine, oleic acid, bare Au and Ag nanoparticles, nanoparticles coated with oleylamine and oleic acid, and Au/PEO and Ag/PEO nanocomposite solutions were conducted at room temperature in the transmission mode between 500 and 4,000 cm-1. The FTIR measurements were performed on KBr pellets, which were prepared by pressing KBr powder to 13 mm diameter and 1.5–2.0 mm thickness in a manual hydraulic press. Approximately 10 μL of sample was placed on KBr pellet. Finally, FTIR experiments were performed with dried pellets.
Preparation of nanocomposites
Solvent evaporation method was used to mix Au and Ag nanoparticles with PEO. Nanoparticles, which were previously suspended in chloroform, were added to PEO/chloroform solution (3.8 g/dL), and the resulting mixture was mechanically stirred overnight. The resulting PEO/nanoparticle solutions were left at room temperature for 1 hour to remove air bubbles. The solutions were then transferred to glass Petri dishes and were dried in an oven at 30°C overnight. This method produced thin films with an average thickness of 0.17±0.03 mm. Neat PEO films were prepared in the same way as nanoparticle containing samples. A list of all samples is provided in Table 1.
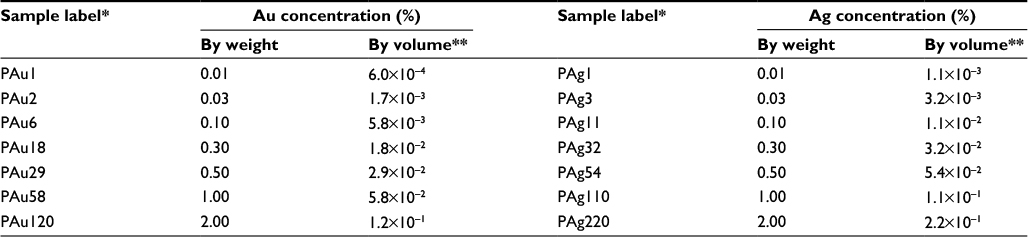 | Table 1 List of PEO/Au and PEO/Ag nanocomposites Notes: *Numbers in sample labels represent nanoparticle volume concentrations rounded to the nearest thousandths. **The following densities were used to calculate volumetric concentrations: 1.13 g/cm3 for PEO, 19.6 g/cm3 for gold, and 10.5 g/cm3 for silver. Abbreviation: PEO, poly(ethylene oxide). |
Characterization of nanocomposites
The dispersion and distribution state of Ag and Au nanoparticles in PEO matrix was analyzed via TEM (Tecnai Sphera, FEI, Hillsboro, OR, USA) and environmental scanning electron microscope (XL30 ESEM FEG equipped with an energy-dispersive X-ray spectrometer; Philips Amsterdam, The Netherlands). For both TEM and field-emission environmental scanning electron microscopy (FE-ESEM) analysis, carbon-coated 200-mesh copper grids were first dipped into dilute PEO/nanoparticle/chloroform solutions and then were left to dry overnight at room temperature. Transmission electron microscopy images were collected at a voltage of 200 kV. For FE-ESEM analysis, samples were fractured in liquid nitrogen, and images of the fracture surfaces were collected with a voltage of 4 kV at a magnification of 8,000.
Differential scanning calorimetry (DSC) measurements were performed using a Setaram DSC 131 apparatus under nitrogen atmosphere. The sample weights ranged between 5 and 8 mg, and each sample was tested three to five times. All samples were subjected to the same heating and cooling protocol: 1) heating from 25 to 100°C at a rate of 10°C/min, 2) holding at 100°C for 10 min, and 3) cooling from 100 to 25°C at a rate of 10°C/min. Crystallization was calculated from DSC experiments by normalizing the melting enthalpy (from second heating) with the theoretical heat of melting of 100% crystalline PEO, which was reported to be 197 J/g by Wunderlich.34
Mechanical and viscoelastic properties of neat PEO and PEO/Au and PEO/Ag nanocomposites were characterized with a dynamic mechanical analyzer (TA Instruments, New Castle, DE, USA) equipped with a liquid nitrogen tank. Two types of experiments (both in tensile mode) were performed 1) static isothermal testing and 2) dynamic temperature scan. Each experiment was repeated four to six times. The static isothermal tensile tests were performed at 32°C by changing the applied force at a rate of 0.5 N/min during which the deformation of the sample was measured and strain vs. stress plots were constructed to obtain compliance. Strain-controlled dynamic temperature scan tests were performed by varying the temperature from -100 to 100°C at 5°C/min increments while keeping the frequency constant at 1 Hz. The maximum displacement amplitude was set to 15 μm.
Results and discussion
Characterization of nanoparticles
Size distribution and average size (diameter) of Au and Ag nanoparticles were determined by image analysis of transmission electron micrographs (Figure 1). The average size of Au and Ag nanoparticles was calculated to be 8.92±2.71 nm (from 196 independent measurements) and 8.38±2.00 nm (from 200 independent measurements), respectively. Light scattering of Au and Ag nanoparticles in chloroform showed a single peak in each case, suggesting that nanoparticles were well dispersed in chloroform (not shown). The UV absorption spectra showed peaks at 530 and 432 nm for Au and Ag nanoparticles, respectively (not shown).
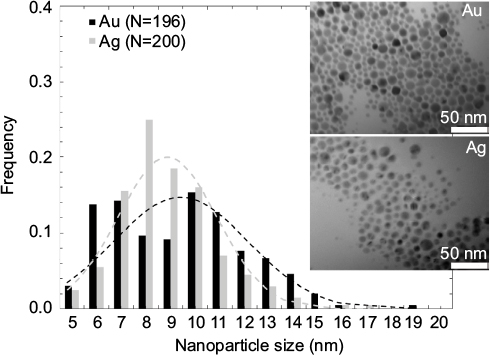 | Figure 1 Au and Ag nanoparticle size distributions along with representative transmission electron microscopy images. Notes: The distributions were compiled from 196 and 200 independent measurements of Au and Ag nanoparticles, respectively. Dashed lines represent normal distribution fit to the experimental data. |
Based on DLS analysis, it is concluded that both Au and Ag nanoparticles displayed good colloidal properties in chloroform. The mean hydrodynamic diameters (Z-average) of oleylamine- and oleic acid-modified Au and Ag nanoparticles were found to be 12.36±0.26 and 12.53±4.06 nm, respectively. As expected, the average sizes obtained from DLS were greater than those obtained from TEM.
TGA was used to determine the surfactant (oleic acid and oleylamine) surface coverage on Au and Ag nanoparticles. TGA results of oleylamine,35 oleic acid,36 oleylamine/oleic acid mixture37,38 (1:1 by volume), and Au and Ag nanoparticles that were surface modified with oleylamine/oleic acid mixture are presented in Figure 2. Both pure oleylamine and oleic acid TGA profiles showed single degradation events at ~240 and 280°C, respectively. The oleylamine/oleic acid mixture presented two degradation events at ~225 and ~335°C. These two degradation events are attributed to the degradation of oleylamine and oleic acid, respectively.
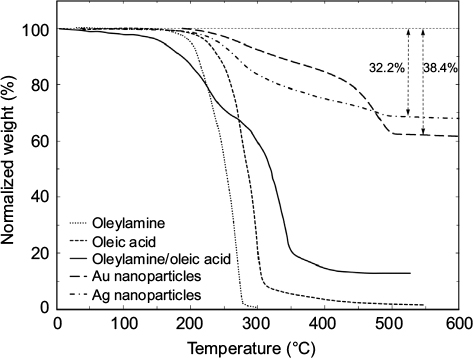 | Figure 2 TGA plots of oleylamine,35 oleic acid,36 oleylamine/oleic acid mixture,37,38 and oleylamine/oleic acid-modified Au and Ag nanoparticles. Abbreviation: TGA, thermogravimetric analysis. |
The TGA curves of oleylamine/oleic acid mixture-modified Au and Ag nanoparticles also showed two degradation events at approximately the same temperatures as the oleylamine/oleic acid mixture: ~270 and ~475°C. These two degradation events are also attributed to the degradation of oleylamine (at ~270°C) and oleic acid (at ~475°C). The observed increase in the degradation temperatures of adsorbed surfactants compared to pure surfactants is attributed to the fact that adsorbed surfactants are protected from degradation due to their close proximity to the nanoparticles.
The most interesting finding of the TGA experiments was the respective amounts of oleylamine and oleic acid on Au and Ag nanoparticles. Differential weight change curves for modified Au and Ag nanoparticles showed that Ag nanoparticles had a greater amount of adsorbed oleylamine than oleic acid, and Au nanoparticles mostly contained oleic acid. This difference in surfactant populations on Au and Ag nanoparticles indicates that oleylamine and oleic acid are preferentially adsorbed to Ag and Au nanoparticles, respectively, which can be explained by the different surface energies of these two nanoparticles.
Overall surfactant surface coverage on Au and Ag nanoparticles was calculated by subtracting the remaining inorganic mass from the initial mass of the sample. Results indicated that surface-modified Au and Ag nanoparticles contained ~38.4 and 32.2% surfactant, respectively. Although total surfactant amounts on Au and Ag nanoparticles are similar, as previously mentioned, there is a substantial difference in the amounts of oleylamine and oleic acid adsorbed onto the Au and Ag nanoparticles, which could influence variations in their overall mechanical properties.
FTIR experiments support this argument (Figure 3). Several peaks characteristic to oleylamine and/or oleic acid also appear on modified Au and Ag nanoparticles (ie, methylene rocking mode at 723 cm-1, methylene stretching modes38–40 at 2,800–3,000 cm-1 region, and C–H stretching38,39,41 in C=C–H at 3,005 cm-1). Because Au and Ag nanoparticles were washed prior to FTIR experiments, the presence of these peaks in nanoparticle spectra indicates that oleylamine and oleic acid are adsorbed onto nanoparticles. In addition, the splitting of the free N–H bending peak at 1,630 cm-1 in oleylamine into two peaks (~1,570 and ~1,660 cm-1) in modified Au and Ag nanoparticle spectra was shown to be the result of amine group oxidizing into amide.41 Finally, the shifting of the carbonyl stretching peak observed at 1,711 cm-1 in oleic acid to higher wavenumbers in modified Au and Ag nanoparticle spectra also suggests adsorption of the carbonyl groups to nanoparticles.
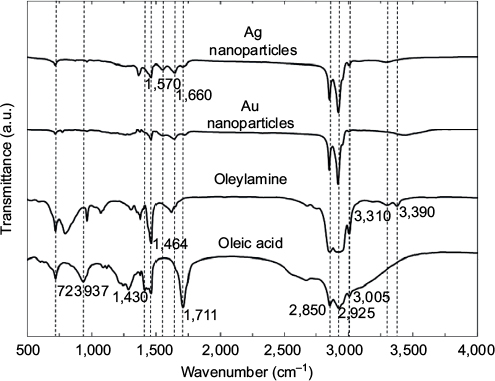 | Figure 3 FTIR spectra of oleylamine, oleic acid, and oleylamine/oleic acid-modified Au and Ag nanoparticles. Note: Curves are shifted with respect to each other to improve visibility. Abbreviations: a.u., arbitrary units; FTIR, Fourier transform infrared spectroscopy. |
Nanoparticle dispersion and distribution
TEM was used to investigate the state of dispersion and distribution of Au and Ag nanoparticles within the PEO matrix. At low concentrations, nanoparticles were observed to have excellent dispersion. When nanoparticle concentration approached 0.3% by weight, even though the overall dispersion and distribution of nanoparticles were very good, first signs of agglomerations were visible (Figure 4).
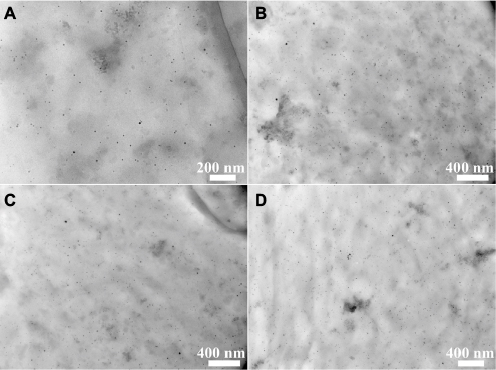 | Figure 4 Transmission electron microscopy images of PEO/Au nanocomposites at volume concentration of 0.018% (0.3% by weight). A, B, C, and D are images taken from different samples having a concentration of 0.018%. Abbreviation: PEO, poly(ethylene oxide). |
Crystallinity and melting temperature of PEO
Melting temperatures and melting enthalpies of neat PEO and PEO/Au and PEO/Ag nanocomposites are tabulated in Table 2. The average (peak) melting temperature and melting enthalpy of neat PEO were calculated to be 68.0±0.3°C and 142.1±15.7 J/g, respectively. This average enthalpy change corresponds to a crystallinity of ~72.1±8.0%. In the case of PEO/Au nanocomposites, both melting temperature and enthalpy were exactly the same as those of neat PEO and they did not show any dependence on Au nanoparticle concentration. However, in the case of PEO/Ag nanocomposites, the average peak melting temperature decreased with increasing Ag concentration (the decrease was greater than the statistical error observed), and although melting enthalpy and crystallinity values deviated from those of neat PEO but the deviations were within statistical error.
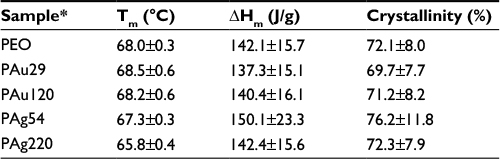 | Table 2 The melting temperature, melting enthalpy, and crystallinities of neat PEO and PEO/Au and PEO/Ag nanocomposites Note: *Only samples whose Tm deviated ±0.5°C (including error) with respect to PEO are reported. Abbreviation: PEO, poly(ethylene oxide). |
Static mechanical properties
Static isothermal tensile tests were carried out at 32°C for neat PEO and PEO/Au and PEO/Ag nanocomposites. Results were tabulated to obtain compliance from strain vs. stress plots, and ultimate tensile strength values were directly read from the curves. The results are presented in Figure 5 as a function of nanoparticle volume concentration (the values for neat PEO are indicated with a horizontal dashed line). The presence of nanoparticles influenced both compliance and ultimate strength especially at low concentrations. Initially, the compliance values of both PEO/Au and PEO/Ag nanocomposites decreased drastically compared to neat PEO. Following this initial decrease, the compliance values recovered slightly and showed an increasing trend toward that of neat PEO. A similar but opposite trend was observed in tensile strength. Initially, strength values increased with concentration compared to that of neat PEO. After showing a maximum value, ultimate strength of PEO/Au nanocomposites decreased approaching to that of neat PEO. In the case of PEO/Ag nanocomposites, the strength decreased even beyond that of neat PEO.
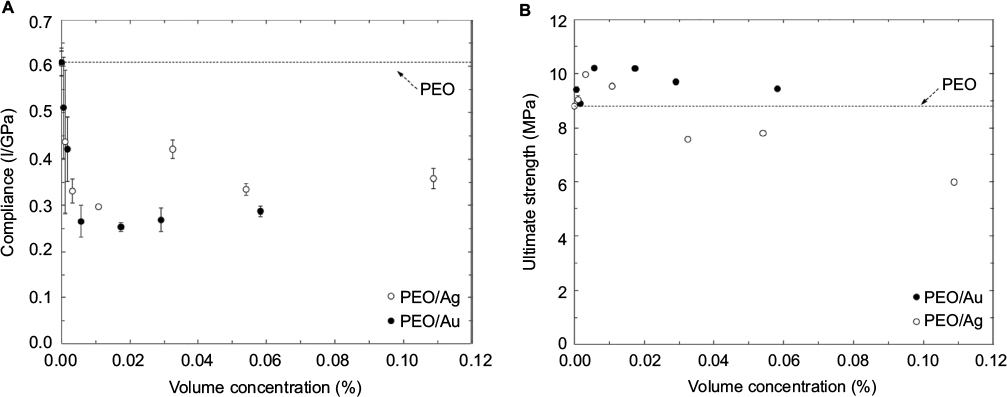 | Figure 5 (A) Compliance and (B) ultimate strength of PEO/Au and PEO/Ag nanocomposites as a function of concentration. Abbreviation: PEO, poly(ethylene oxide). |
The behavior observed in the compliance and ultimate strength of PEO/Au and PEO/Ag nanocomposites as a function of nanoparticle concentration cannot be attributed to changes in the crystallinity of the PEO matrix because it was shown that PEO crystallinity remained constant (or at least within the measured experimental error). Both compliance and ultimate strength showed a transition within a concentration range of 0.01–0.02% (0.10–0.35% by weight), which corresponds to onset of nanoparticle agglomeration as was indicated by transmission electron microscopy images (Figure 4). Therefore, the observed behavior of static mechanical properties is related to the dispersion and distribution state of nanoparticles within the PEO matrix. At low concentrations, when dispersion and distribution of nanoparticles were found to be excellent, static mechanical properties strongly and almost linearly depended on nanoparticle concentration. With the onset of nanoparticle agglomeration, concentration dependence changed direction and started a slow approach toward those of the matrix polymer. It should be noted that the stronger than expected decrease of ultimate strength in the case of PEO/Ag nanocomposites with respect to that of neat PEO at high concentrations indicates that agglomeration of nanoparticles is not the only structural factor that influences mechanical properties. Although overall crystallinity was found to remain constant within experimental error, it is possible that Au and Ag nanoparticles might influence the crystallite size distribution, which would also influence mechanical properties.
The glass transition temperature
The Tg of neat PEO, and PEO/Au and PEO/Ag nanocomposites were obtained from strain-controlled temperature scan dynamic mechanical analysis experiments that were performed at 1 Hz and with a maximum displacement amplitude of 15 μm. Samples were tested at 5°C intervals between -100 and 100°C. Tg was recorded as the peak temperature of the loss factor. The results are shown in Figure 6 as a function of nanoparticle volume concentration. Tg of neat PEO was measured to be –45°C, which is close to the reported value of -52°C.42 The Tg of PEO/Au nanocomposites followed a trend similar to that observed for compliance. Initially, Tg decreased as a function of nanoparticle concentration and reached a minimum value of -49.5°C at a volume concentration of 0.02% (0.3% by weight), then showed an increasing trend toward the Tg of neat PEO. On the other hand, the Tg of PEO/Ag nanocomposites showed almost a linearly increasing trend with nanoparticle concentration, reaching a Tg of -35°C at a volume concentration of 0.11% (1.0% by weight).
 | Figure 6 The glass transition temperature of neat PEO, PEO/Au, and PEO/Ag nanocomposites obtained from dynamic mechanical analysis experiments. Abbreviation: PEO, poly(ethylene oxide). |
The effect of nanofillers on polymers could be explained by interfacial and confinement effects. Interfacial effects arise due to intermolecular interactions at the polymer–nanofiller interface, whereas confinement is related to the average distance between nanofillers, but in essence, all are realized because of the increased surface area per unit volume with decreasing nanofiller size.43 As a result of interfacial and confinement effects, structure and dynamic properties of polymer chains are strongly influenced by the presence of nanofillers,44–47 and various and sometimes contradictory results have been obtained.48–51 In some composites, nanofillers were found to restrict polymer chain dynamics while in others they resulted in enhanced mobility.52–54
The behavior of Tg of PEO/Au nanocomposites seems to follow the dispersion/distribution state of the nanoparticles, whereas PEO/Ag nanocomposite system showed a completely different behavior that was independent of dispersion/distribution state. Given that Tg of the PEO/Ag nanocomposite system increased with Ag nanoparticle concentration, it could be assumed that this system exhibits a completely different interface than that of PEO/Au. In fact, TGA experiments showed that Au and Ag interfaces are different than each other. In the case of Ag, TGA experiments revealed the presence of more oleylamine than oleic acid, whereas Au nanoparticles had more oleic acid and less oleylamine. Therefore, it is suggested that this difference in oleylamine and oleic acid populations on Au and Ag nanoparticles leads to different nanoparticle–polymer matrix interfacial interactions in these two nanocomposite systems. As a result (of having different interfacial interactions), the Tg behavior of PEO/Au and PEO/Ag nanocomposites drastically differ from each other.
Conclusion
Nanocomposites of PEO containing Au or Ag nanoparticles showed many similarities to each other and with respect to neat PEO. For example, the crystallinity of PEO did not show any particular dependency on the type or concentration of nanoparticle. Both nanocomposite systems showed similar tendencies with respect to nanoparticle concentration, where the property in question either showed a sudden increase (ultimate strength, modulus) or decrease (compliance) at low concentrations with respect to neat PEO. This was followed by a change in direction and slow approach to the properties of neat PEO. The concentration at which the change in direction was observed in each property was found to correlate with the formation of nanoparticle agglomerates.
However, the two composite systems also showed subtle but undeniable differences such as in their Tgs. The Tg of the PEO/Ag nanocomposite system was found to be always greater than that of neat PEO, whereas Tg of the PEO/Au nanocomposites was always less than that of neat PEO. In addition, the PEO/Au nanocomposite system showed the same correlation with nanoparticle concentration as other properties – sudden decrease followed by a slow approach to neat PEO Tg, where the change in Tg behavior coincided with the onset of nanoparticle agglomeration. However, the PEO/Ag system did not show any correlation with agglomeration. These peculiar and drastic differences in the Tgs of the two systems were explained by the difference of surfactant populations adsorbed onto each nanofiller. TGA results clearly pointed out that more oleylamine was present on Ag nanoparticles, whereas more oleic acid was present on Au nanoparticles. This difference in oleylamine vs. oleic acid populations on nanoparticle surfaces leads to different interfacial interactions between nanoparticles and PEO, and as a result, the Tg of the two systems differs from each other. It is also important to note that Ag nanoparticles contained less surfactant than Au nanoparticles (~6%), which could also be contributing to the observed differences in their Tgs.
Acknowledgments
This material is based upon work supported by the National Science Foundation under grant no. CMMI-1538730 and the Scientific and Technological Research Council of Turkey (TUBITAK) under grant no. 112M666. K Rickard is an undergraduate student.
Disclosure
The authors report no conflicts of interest in this work.
References
Faraday M. The Bakerian lecture: experimental relations of gold (and other metals) to light. Philos Trans R Soc Lond. 1857;147:145–181. | ||
Sau TK, Rogach AL, editors. Complex-Shaped Metal Nanoparticles: Bottom-Up Syntheses and Applications. Weinheim, Germany: Wiley-VCH Verlag; 2012. doi:10.1002/9783527652570. | ||
Payne AR. Effect of dispersion on the dynamic properties of filler-loaded rubbers. J Appl Polym Sci. 1965;9(6):2273–2284. | ||
Gusev AA. Micromechanical mechanism of reinforcement and losses in filled rubbers. Macromolecules. 2006;39(18):5960–5962. | ||
Payne AR. A note on the conductivity and modulus of carbon black-loaded rubbers. J Appl Polym Sci. 1965;9(3):1073–1082. | ||
Ounaies Z, Park C, Wise KE, Siochi EJ, Harrison JS. Electrical properties of single wall carbon nanotube reinforced polyimide composites. Compos Sci Technol. 2003;63(11):1637–1646. | ||
Udayabhaskar R, Mangalaraja RV, Manikandan D, Arjunan V, Karthikeyan B. Room temperature synthesis and optical studies on Ag and Au mixed nanocomposite polyvinylpyrrolidone polymer films. Spectrochim Acta A Mol Biomol Spectrosc. 2012;99:69–73. | ||
Okada A, Usuki A. Twenty years of polymer-clay nanocomposites. Macromol Mater Eng. 2006;291(12):1449–1476. | ||
Böhning M, Goering H, Hao N, Mach R, Schönhals A. Polycarbonate/SiC nanocomposites – influence of nanoparticle dispersion on molecular mobility and gas transport. Polym Adv Technol. 2005;16(2–3):262–268. | ||
Ibrahim S, Rafie Johan M. Thermolysis and conductivity studies of poly(ethylene oxide) (PEO) based polymer electrolytes doped with carbon nanotube. Int J Electrochem Sci. 2012;7:2596–2615. | ||
Appetecchi GB, Montanino M, Balducci A, Lux SF, Winterb M, Passerini S. Lithium insertion in graphite from ternary ionic liquid-lithium salt electrolytes I. Electrochemical characterization of the electrolytes. J Power Sources. 2009;192(2):599–605. | ||
de Azeredo HMC. Nanocomposites for food packaging applications. Food Res Int. 2009;42:1240–1253. | ||
Garcés JM, Moll DJ, Bicerano J, Fibiger R, McLeod DG. Polymeric nanocomposites for automotive applications. Adv Mater. 2000;12(23):1835–1839. | ||
Brigger I, Dubernet C, Couvreur P. Nanoparticles in cancer therapy and diagnosis. Adv Drug Deliv Rev. 2002;54(5):631–651. | ||
Panyam J, Labhasetwar V. Biodegradable nanoparticles for drug and gene delivery to cells and tissue. Adv Drug Deliv Rev. 2003;55(3):329–347. | ||
Cui Z, Mumper RJ. Plasmid DNA-entrapped nanoparticles engineered from microemulsion precursors: in vitro and in vivo evaluation. Bioconjug Chem. 2002;13(6):1319–1327. | ||
Cao X, Lai S, James Lee L. Design of a self-regulated drug delivery device. Biomed Microdevices. 2001;3(2):109–118. | ||
Zhang Q. Investigating Polymer Conformation in Poly (Ethylene Oxide) (PEO) Based Systems for Pharmaceutical Applications: A Raman Spectroscopic Study of the Hydration Process of PEO Tablet. Göteborg, Sweden: Chalmers University of Technology; 2011. | ||
van Oss CJ, Giese RF. On the structure of poly(ethylene oxide) when immersed in water. J Dispers Sci Technol. 2010;31(12):1697–1703. | ||
Arzhakov D, Artemenko A, Gordeev I, Choukourov A, Slavinska D, Biederman H. Nanocomposite metal/poly(ethylene oxide)-like plasma polymer films and their properties. In: Safrankova J, Pavlu J, eds. 19th Annual Conference of Doctoral Students, WDS’10, WEEK OF DOCTORAL STUDENTS 2010. Prague, Czech Republic: Charles University; 2010:19. | ||
Xu BH, Lin BZ, Sun DY, Ding C. Preparation and electrical conductivity of polyethers/WS2 layered nanocomposites. Electrochim Acta. 2007;52(9):3028–3034. | ||
El-Shamy AG, Attia W, Abd El-Kader KM. The optical and mechanical properties of PVA-Ag nanocomposite films. J Alloys Compd. 2014;590:309–312. | ||
Montazami R, Spillmann CM, Naciri J, Ratna BR. Enhanced thermomechanical properties of a nematic liquid crystal elastomer doped with gold nanoparticles. Sens Actuators A Phys. 2012;178:175–178. | ||
Pandis C, Logakis E, Kyritsis A, et al. Glass transition and polymer dynamics in silver/poly(methyl methacrylate) nanocomposites. Eur Polym J. 2011;47(8):1514–1525. | ||
Kim JK, Ahn H. Fabrication and characterization of polystyrene/gold nanoparticle composite nanofibers. Macromol Res. 2008;16(2):163–168. | ||
Sun Y, Zhang Z, Moon K-S, Wong CP. Glass transition and relaxation behavior of epoxy nanocomposites. J Polym Sci Part B Polym Phys. 2004;42(21):3849–3858. | ||
Feyzi A, Faghihi K, Raeisi A, Koushki M, Farahani M. New optically active organo-soluble poly(amide-imide)s from [n,n,-(4,4,-diphtaloyl)-bis-l-amino diacid]s and 1,2-bis[4,4′-aminophenoxy] ethane: synthesis and characterization. J Chil Chem Soc. 2013;58(3):1884–1887. | ||
Rong MZ, Zhang MQ, Zheng YX, Zeng HM, Walter R, Friedrich K. Structure–property relationships of irradiation grafted nano-inorganic particle filled polypropylene composites. Polymer (Guildf). 2001;42(1):167–183. | ||
Novak BM. Hybrid nanocomposite materials—between inorganic glasses and organic polymers. Adv Mater. 1993;5(6):422–433. | ||
Giannelis EP. Polymer layered silicate nanocomposites. Adv Mater. 1996;8(1):29–35. | ||
Hiramatsu H, Osterloh FE. A simple large-scale synthesis of nearly monodisperse gold and silver nanoparticles with adjustable sizes and with exchangeable surfactants. Chem Mater. 2004;16(13):2509–2511. | ||
Schneider CA, Rasband WS, Eliceiri KW. NIH Image to ImageJ: 25 years of image analysis. Nat Methods. 2012;9(7):671–675. | ||
Collins TJ. ImageJ for microscopy. Biotechniques. 2007;43(1 suppl):25–30. | ||
Wunderlich B. Thermal Analysis of Polymeric Materials. Berlin Heidelberg: Springer; 2005. doi:10.1007/b137476. | ||
Qi B. Factors Controlling Synthesis of Iron Oxide Nanoparticles and the Effect of Surface Charge on Magnetic Hyperthermia [dissertation]. Clemson(SC): Clemson University; 2013. | ||
Li N, Guo P, Lou W, Chen S. Tribological properties of oleic acid capped copper nanoparticles prepared by the solventless thermolysis of single-source precursor. Adv Mater Res. 2012;55(7–559):1131–1139. | ||
Sahu NK, Prakash A, Bahadur D. Role of different platinum precursors on the formation and reaction mechanism of FePt nanoparticles and their electrocatalytic performance towards methanol oxidation. Dalton Trans. 2014;43(12):4892–4900. | ||
Wu XW, Liu C, Li L, Jones P, Chantrell RW, Weller D. Nonmagnetic shell in surfactant-coated FePt nanoparticles. J Appl Phys. 2004;95:6810–6812. | ||
Roonasi P, Holmgren A. A Fourier transform infrared (FTIR) and thermogravimetric analysis (TGA) study of oleate adsorbed on magnetite nano-particle surface. Appl Surf Sci. 2009;255(11):5891–5895. | ||
Lewis WK, Rosenberger AT, Gord JR, et al. Multispectroscopic (FTIR, XPS, and TOFMS-TPD) investigation of the core-shell bonding in sonochemically prepared aluminum nanoparticles capped with oleic acid. J Phys Chem C. 2010;114(14):6377–6380. | ||
Liu X, Atwater M, Wang J, et al. A study on gold nanoparticle synthesis using oleylamine as both reducing agent and protecting ligand. J Nanosci Nanotechnol. 2007;7(9):3126–3133. | ||
Branca C, Magazu S, Maisano G, Migliardo F, Migliardo P, Romeo G. Study of conformational properties of poly(ethylene oxide) by SANS and PCS techniques. Phys Scr. 2003;67(6):551–554. | ||
Liu H, Catherine Brinson L. A hybrid numerical-analytical method for modeling the viscoelastic properties of polymer nanocomposites. J Appl Mech Trans ASME. 2006;73(5):758–768. | ||
Avella M, Cosco S, Di Lorenzo ML, Di Pace E, Errico ME, Gentile G. Nucleation activity of nanosized CaCO3 on crystallization of isotactic polypropylene, in dependence on crystal modification, particle shape, and coating. Eur Polym J. 2006;42(7):1548–1557. | ||
Lipatov Y. Polymer Reinforcement. Ukraine: ChemTec; 1995. | ||
Menczel J, Varga J. Influence of nucleating-agents on crystallization of polypropylene.1. Talc as a nucleating-agent. J Therm Anal. 1983;28(1):161–174. | ||
Fujiyama M, Wakino T. Structures and properties of injection moldings of crystallization nucleator-added polypropylenes. II. Distribution of higher-order structures. J Appl Polym Sci. 1991;42(10):2749–2760. | ||
Di Lorenzo M, Errico M, Avella M. Thermal and morphological characterization of poly (ethylene terephthalate)/calcium carbonate nanocomposites. J Mater Sci. 2002;37(11):2351–2358. | ||
Ash BJ, Schadler LS, Siegel RW. Glass transition behavior of alumina/polymethylmethacrylate nanocomposites. Mater Lett. 2002;55(1–2):83–87. | ||
Ash BJ, Siegel RW, Schadler LS. Mechanical behavior of alumina/poly(methyl methacrylate) nanocomposites. Macromolecules. 2004;37(4):1358–1369. | ||
Lu H, Nutt S. Restricted relaxation in polymer nanocomposites near the glass transition. Macromolecules. 2003;36(11):4010–4016. | ||
Dekkers MEJ, Heikens D. Effect of interfacial adhesion on the tensile behavior of polystyrene-glass-bead composites. J Appl Polym Sci. 1983;28(12):3809–3815. | ||
Harmandaris VA, Daoulas KC, Mavrantzas VG. Molecular dynamics simulation of a polymer melt/solid interface: local dynamics and chain mobility in a thin film of polyethylene melt adsorbed on graphite. Macromolecules. 2005;38(13):5796–5809. | ||
Zhang W, Srivastava I, Zhu YF, Picu CR, Koratkar NA. Heterogeneity in epoxy nanocomposites initiates crazing: significant improvements in fatigue resistance and toughening. Small. 2009;5(12):1403–1407. |
 © 2017 The Author(s). This work is published and licensed by Dove Medical Press Limited. The
full terms of this license are available at https://www.dovepress.com/terms
and incorporate the Creative Commons Attribution
- Non Commercial (unported, 3.0) License.
By accessing the work you hereby accept the Terms. Non-commercial uses of the work are permitted
without any further permission from Dove Medical Press Limited, provided the work is properly
attributed. For permission for commercial use of this work, please see paragraphs 4.2 and 5 of our Terms.
© 2017 The Author(s). This work is published and licensed by Dove Medical Press Limited. The
full terms of this license are available at https://www.dovepress.com/terms
and incorporate the Creative Commons Attribution
- Non Commercial (unported, 3.0) License.
By accessing the work you hereby accept the Terms. Non-commercial uses of the work are permitted
without any further permission from Dove Medical Press Limited, provided the work is properly
attributed. For permission for commercial use of this work, please see paragraphs 4.2 and 5 of our Terms.